No where to go but up....What a mess! As you can see from the 240 minute chart, things are indeed ugly. But, isn't it strange that we made all time highs just a month or so ago? Look at the Magic 7 stocks and find one that doesn't look buyable here. All the bearish sentiment in the world cannot stop the flood of FOMO money that will attract to the negative look of the chart to the first clear sign of a trend reversal. I don't care about the rest of the world, I am going to try and buy this somewhere between where we are and an absolute bottom in the 5500's.
MES1! trade ideas
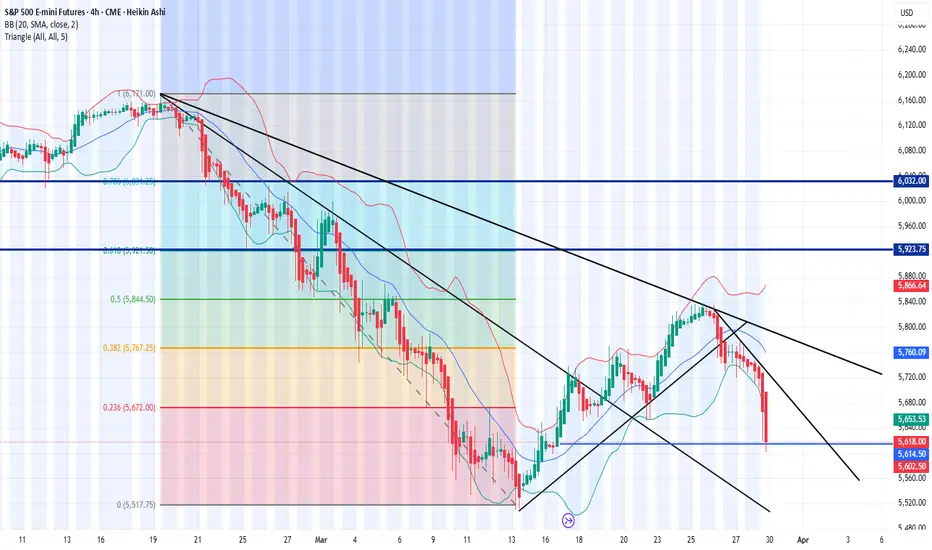
Here is my default setupMean Reversion Channel
Swing Failure Pattern
BUY-SELL MAs RSI
Pivot Trendlines with Breaks
BUY-SELL Requirements info

bearflag broke downno rate cuts but im still balling
we already tested that gap (rectangle) so a second attempt will probably close it.
that will throw us well below the year to date value range
so im looking at it as a potential bottom.
if this gap fails to hold im looking at the previous range for help and the previous value area high to turn support (classic what was once resistance is now support)
on the shorter timeframe i anticipate 5485 to act as support a small bounce can make it look like a head and shoulders pattern for the bearflag target if there's any bullish play
note this is not a trade i will take unless the data and reaction at the level will look bullish.
so make sure you know we can straight up nuke on monday. (eyes on BTC during this weekend)
anyone who saw my posts before i talked about how we need to rotate back to value thats exactly what happened.
previous range value area high was left untested, retesting it is quite the possibility. (theres a gap right above it )

ES/SPY Possible Enhancement On Idea.As per usually channel lines are nice but common price action includes big pushes past them and then reclaiming them. This provides great opportunities for big money to run the stops, scoop of the shares, paint a big wick and keep trucking. It's how the game is played and provides no real ability as to where to count on a bottom or to put stops. Non the less the channel lines provide an idea as to where to see signs of traction or of course a top for further bull traps or sell offs. Personally I think peak tariffs fears are near and at some point the market will accept them and move on.

ES Bull Unicorn Trade ReviewDaily bias: Bullish due to the 1hr NWOG that was created on Friday
Trade info:
- Price trades down into 1hr +NWOG
- Creates a 5min bull unicorn model
- I enter as price trades back down into the breaker block (BB) and target +2r profit
- Hits my +2r TP perfectly and falls back down
Let me know if this trade review helps and if you want more trade reviews.

SHORT ON ES?This could be a short rade idea for swing trade.
Las week price invalidate long ideas and the structure remain bearish.
Depending on how we open on Sunday, and with NFP week ahead, I would see ha Monday price will dive quick again, or retrace a little and offer short second half of he week.

29 March 2025S&P 500 falls due to US car tariffs are aggressive to the neighbourhood countries such as Mexico and Canada which may cause the rise in trade tensions. PCE rose to 2.8% on year over year from January 2.7% and the core measure rose to 0.4% from January 0.3% gain.

They Shut Down the AlgosYou can see in the chart that during the initial Feb/March drop that the algos were still running, and we'd see at least a small bounce when MFI/RSI got oversold, however you can see that they shut the algos down yesterday, MFI totally flatlined for 2 days which is something that did not happen on the initial drop.
So basically, there's no point for me to plot 3 hr charts until they turn the algos back on. I will post when that happens.
Made a bunch of mistakes this week, but managed to break even daytrading XLF puts twice today. XLF was lagging the market a bit which made it easier to trade.

Daily Trade Recap based on VX Algo SystemEOD accountability report: +$537.50
Sleep: 8 hour, Overall health: Energized
As mentioned in our trade recap video yesterday, today was suppose to be really bearish and go down more,
However, the inflation report ended up being really bad and that just crashed the market all day.
I was expecting to see some bounces here and there along the way but it was just straight drill with no buyers in sight.
Daily Trade Recap based on VX Algo System
8:24 AM Market Structure flipped bearish on VX Algo X3! Look to STR at 1 min MOB or resistance.
11:10 AM VXAlgo NQ 10M Buy Signal
3:36 PM VXAlgo NQ 48M Buy Signal

Risk offThe S&P 500 price action on Friday indicated risk off as demonstrated by the selling that came into this market. The expectation is further movement to the downside but not a big day down on Monday without new fundamental information.


Seeking a breakthrough within the fluctuation range.Using this indicator, Seeking a breakthrough within the fluctuation range.

3/21 Gap Fill Bullish BounceUS indices are poised to fill downside gaps from Friday's close. Could be good for a bounce w/ upside cash gap targets higher.

S&P 500 Futures Potential Short OpportunitiesThe S&P 500 futures index has retraced approximately half its previous losses from a steep sell-off that began at 6148. After rejection at 5818, prices now hover precariously above critical Support at 5732.
Immediate Support Test: Failure at 5732 would trigger additional bearish pressure toward the next support levels at 5649 and 5566.
Bullish Reversal Potential: Only a decisive close above 5818 would suggest a more constructive outlook, which currently appears improbable amid elevated VIX levels.

The stage is setThe stage is set in the S&P 500 daily chart for a potential kick in volatility on Friday as we go into the weekend. Even though we've had a down day on Thursday, the potential for a rally is set up.

ES UpdateSo MFI hit oversold this morning as the gap filled, so I figured we'd get a bounce....
but it looks like hedge funds sold off every algo pump and MFI totally flatlined at the bottom.
How do I know hedge funds were liquidating? Crap like FCEL went green because they close their short positions when they close their long positions.
Yeah, I got a little stupid and lost some money today, I tried to warn my followers in my comments not to go long today, sure enough market sold off EOD.
I think it's time to do chart pattern short plays. Will let you know if I see anything good.

Daily Trade Recap based on VX Algo SystemEOD accountability report: +$786.25
Sleep: :ok: Overall health: Day 1 of fasting, edgy as f
I finally got to test Caffeine and lions mane on an empty stomach and it was crazy, really sharp focus but jumpy as well.
We started the day off pretty scary, Huge drop to 5720 and instant recovery to the top. Traded a bit on one of my APEX evals that renewed today but
Didn't really touch the funded account until 11:20 when we hit the 48m resistance and got a 10m signal.
Overall day was pretty decent, 10m and 5 m chart worked really well.
Daily Trade Recap based on VX Algo System
9:50 AM VXAlgo ES 10M Buy signal 2x
11:10 AM VXAlgo ES 10M Sell Signal 2x
12:24 PM Market Structure flipped bearish on VX Algo X3!

The uncertainty of the economic impact of tariffsThe S&P 500 daily chart on Wednesday reflected uncertain economic impact of the new announcements on tariffs. The economic impact is unknown but we know stock markets hate uncertainty. The issue now is after is the downward absorption of the new tariffs will the market get cheap enough to become attractive to buyers.

ES Update1) My apologies for getting the PCE release date wrong, it's Friday, not today. Still made money on my XLF calls plus AAPL also went up this morning.
2) There's a small open gap on ES, RTY, and YM from the one hour break after market close. It looks like it might fill overnight. Make sure you check tomorrow morning.
3) The gap below is still open, and it looks like 3hr MFI and RSI want to hit oversold tomorrow.
4) Sorry for not checking the news, I can barely even make trades on my phone while at work. Had I known today was auto tariff day, I would have played things differently.
Personally, I think PCE numbers are a moo point (my Friends will get the joke) because auto tariffs will drive inflation up, but there's bound to be a bounce when MFI and RSI get oversold. If I decide to go long tomorrow, it'll probably just be a handful of XLF calls again.
XLF will probably dip tomorrow because higher auto prices means fewer auto loans and higher inflation this summer. Market will still go up Friday if indicators get oversold, so it's just a quick play, not an investment.
At this point, all I can recommend is that you keep an eye on the 3 hr indicators, seems to be working well. Also, XLF and AAPL completed intraday patterns from yesterday, so there is that too.

ES Melt upLook at the MFI, it's pegged. I guess we get a melt up, at least until tomorrow's PCE numbers. Maybe even into next Monday.
Anyways, I woke up, called in sick, and re-entered my AAPL trade this morning, I figured with TSLA's bad news they'd have to pump AAPL instead to get the market green, and they did. Plus XLF gapped up too much, though I suppose I could have bought that too when it went red on the gap close. Gonna just hold the AAPL calls as my PCE trade for tomorrow morning.
Expecting a slight kick up EOD because of PCE bets. Until then probably just a sideways whipsaw

S&P 500 – Corrective Structure in Progress
Everything is unfolding as planned for TVC:SPX AMEX:SPY OANDA:SPX500USD : after a completed impulse to the downside, we're seeing a complex WXY correction, with wave (y)potentially ending around the 0.618 retracement level and the MA20w.
Currently, wave B of the second leg is developing. Once it's complete, we may see a final push upward before a larger wave C to the downside.
⚠️ Key area to watch: 5780–5840 CME_MINI:ES1! zone for potential exhaustion.

Daily Trade Recap based on VX Algo SystemEOD accountability report: +$790
Sleep: Great Overall health: :check:
Overall pretty decent trading day, spotted long term sell signals on market across the board this morning pre market so I was expecting thing to be bearish and drop. It played out as expected and helped with the trades today as thing went according to plan most of the time.
I did expect a V shape recovery at some point but that didnt happen.
Daily Trade Recap based on VX Algo System
10:36 AM VXAlgo NQ 10M Buy Signal,( didn't work that well)
1:30PM 10min MOB bounce :check:
2:09 PM VXAlgo ES 10M Buy signal + 10min MOB (Double Signal) :check:
3:36 PM VXAlgo NQ 48M Buy Signal :check:

TRADE IDEAS: ES FUTURES (ESM2025) – 3/26/2025 PLAYBOOK# 📊 TRADE IDEAS: ES FUTURES (ESM2025) – 3/26/2025 PLAYBOOK
## 🟢 SCENARIO 1 (BULLISH)
**DIRECTION:** Long
**STRUCTURE BIAS:** Bullish
**ENTRY LEVEL:** 5,795-5,815 (current zone, buying sell-side liquidity raids)
**STOP LEVEL:** 5,785 (invalidate if hourly close below this level)
**TARGET LEVELS:**
- **Target 1:** 5,880-5900 (Weekly Key High Resistance Level)
**R/R RATIO:** ~3:1 (depending on final execution)
### EXECUTION STRATEGY
- **Entry Confirmation:** Look for price to raid previous unhit weekly lows (sell-side liquidity)
- **Long Entries:** Establish long positions as price successfully raids these lows but fails to sustain below them
- **Stop Placement:** Use 5,785 as a hard stop (hourly close below invalidates the trade idea)
- **Target:** Take profits at 5880 - 5,900 (Weekly Key High Resistance)
### KEY POINTS
- Current price action targeting sell-side liquidity in the form of previous unhit weekly lows
- Wednesday typically not a low/high of week formation day, suggesting potential for continued movement
- Tomorrow's High Impact News Event (GDP at 8:30 AM) likely to create volatility and could accelerate the move
- Bullish structure prevails as long as price maintains above liquidity raid zones
---
## 🔴 SCENARIO 2 (BEARISH)
**DIRECTION:** Short
**STRUCTURE BIAS:** Bearish after bullish extension
**ENTRY LEVEL:** 5,880-5910 (Weekly Key High Resistance Level)
**STOP LEVEL:** 5,9550 (invalidate if hourly close above this level)
**TARGET LEVELS:**
- **Target 1:** 5,740 (Weekly Opening Gap upper boundary)
**R/R RATIO:** ~3:1 (depending on final execution)
### EXECUTION STRATEGY
- **No Immediate Short:** Wait for price to extend to Weekly Key High Resistance Level (blue line ~5,900)
- **Rejection Confirmation:** Look for reversal candles and selling pressure at resistance
- **Short Entries:** Establish short positions once price trades below confirmation level after testing resistance
- **Stop Placement:** Use 5,925-5950 as a hard stop (hourly close above invalidates the trade idea)
- **Scaling Out:** Partial profit near 5,800, hold remaining for potential move to 5,745 area
### KEY POINTS
- After liquidity is taken at the Weekly Key High Resistance (blue line), expect manipulation and reversal
- Short opportunity emerges only after bulls exhaust momentum at key resistance
- Weekly Opening Gap (red zone) remains a significant downside target for next move
- Any sustained hourly close above 5,965 **invalidates** this bearish setup
## MARKET BIAS
- **SHORT TERM (Today – 1 Day):**
- **Bullish** bias as price is likely to find support at current levels and move toward the Weekly Key High Resistance
- Current price action suggests accumulation before a move higher
- Tomorrow's GDP numbers (8:30 AM) represent a potential catalyst for accelerated movement
- **LONGER TERM (1–2 Weeks):**
- After testing the Weekly Key High Resistance level (~5,900), expect a reversal and move back toward the Weekly Opening Gap (red zone)
- Market structure suggests a "liquidity hunt" pattern – first to the upside, then reversing to the downside
- Major liquidity draw currently at the blue line, once exhausted, focus will shift back to the Weekly Opening Gap
