ES Morning Update march 13thThis week has revolved around one key level in ES: 5568-72, which has been lost and reclaimed four times. At 11:20 PM yesterday, it triggered a long setup from an a textbook failed breakdown, leading to a 65+ point rally—and overnight, the same pattern repeated again.
As of now:
• No change—5568-72 remains weak support
• A 5599 reclaim sets up a move to 5616, 5643+
• If 5568 fails, expect further downside
MES1! trade ideas

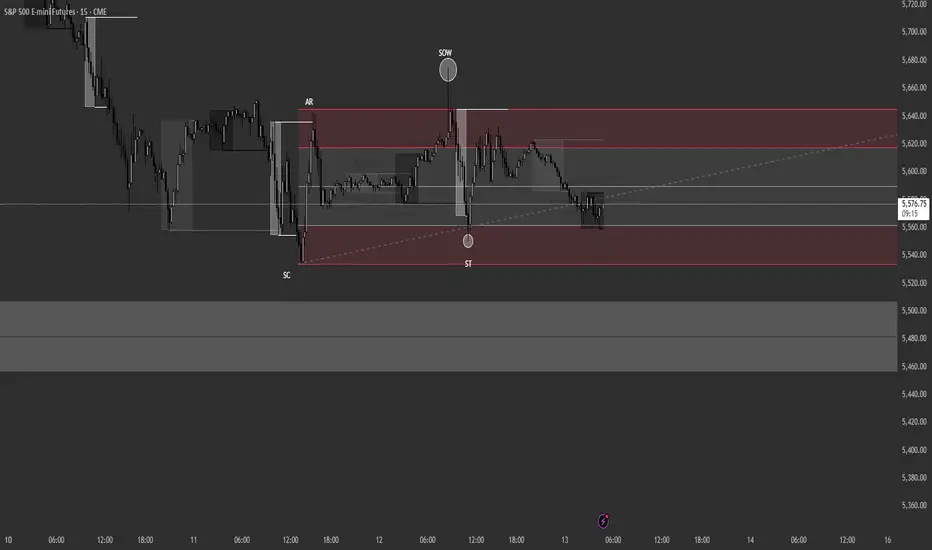
ES1! Wyckoff ReversalPrice these past days has started consolidation right above a unmitigated 4H ORB from september 2024. Selling pressure seems to be weakening and showing some noticable steps to forming wyckoff re-distribution. waiting for price to purge into the ORB, then moving onto to final confirmation.
ES1! Next 12M price action prediction:
1. santa clause run up into year end into HTF resistance
2. sell of in jan we lose 50DMA and support in green line, but then find support on 200DMAQ and support in red + green line.
3. we run up intil end of may and then lose 200DMA to later on drop 20% down to 200WMA and HTF Support.
4. We then run it up again in 2025 2H and 2026

Sideways move to higherThe structure on Wednesday in the S&P 500 daily chart implies a market that got high enough to find sellers. However the overall structure implies the potential for a sideways to higher move.

Es Potential for some more downside before we start moving upEs has been in a downtrend for a while now with buyers eagerly trying to dig in a foothold for the next leg up.
These are a couple indicators I have created the right screen is a gap filter range that price will revisit and use as support/resistance before moving to the next one. As you can see today ES has retested the upper range again and we are right back down below it so I am watching for some fresh downside before I look to start taking longs.
The right screen also shows a channel we have been in and an Indicator I created that shows the average retracement ranges of the day and then draws boxes that price will partially or fully mitigate and the boxes will reflect the color (yellow for partial and red for full mitigation).
As you can see the trend has been to clean up some of the most recent ones to make another step down, I will be watching for a reaction if we get down there to start assuming longs. Or we might blast right out of this with news but with todays reaction Im fully expecting some more directional moves down first.

Maybe it's not as bad as we think....I have seen some very goofy things take place in the market, but in 40 years of trading this is really a very special time of misplaced faith in the old style charting, but I can't help but want to buy here. People were literally throwing away their stocks like last Sunday's paper. My world as perceived through e-mini's say's: caution is warranted on the long side, but selling here is just too gut wrenching. Buying into this mess and expecting it's going to turn around tomorrow might be a bit bold, but trading here with a view towards the long side makes sense. A .382 retracement brings us back to the 5716 area and a .618 back to 5820 plus or minus a few ticks.
We will be rolling from March into June contracts soon, and that is always a jolly time and may even provide some upside momentum.

ES FUTURES LEVELS TO WATCH AND QUICK LOOKLevels to watch on ES futures Quick Look. keep a eye out for more action on these areas

Recap ES Futures Weekly PlanCME_MINI:ES1!
In this TradingView blog, we’ll recap the price action and share our insights from the weekly trade plan posted on March 3rd, 2025.
Our Scenario 3 highlighted mounting risks, with weaker economic data reigniting the stagflation theme. While the price action largely aligned with our expectations, it extended further downward than anticipated. Economic data was mixed: PMIs exceeded expectations, while the NFP report came in lower than forecasted. The unemployment rate ticked up to 4.1%, and average hourly earnings data showed mixed results. The Month-over-Month figures were in line with expectations, but Year-over-Year average hourly earnings came in slightly lower at 4% versus the consensus of 4.1%.
In addition, headline news and tariff uncertainties dampened sentiment across the board.
Our approach primarily involves volume profiling and market auction theory to map out price levels and set expectations based on the prevailing market context at the start of each week. However, as fundamentals, macroeconomic factors, geopolitics, and headline news gain increasing significance and impact the market, we draw on our accumulated experience to incorporate these elements into our analysis.
When market regimes shift, technical analysis alone often proves insufficient. A strong understanding of fundamentals, macroeconomic conditions, and geopolitics is crucial to staying aligned with what’s actually happening in the markets, rather than relying on your personal thoughts and assumptions.
Given the myriad factors influencing the economy and markets, traders should recognize that each approach has its merits. We recommend sticking with the strategy that works best for you.

Still bearish in ES/SPYRejection from Daily SIBI. Intraday trades taken and 90% positions off. I still anticipate price to trade to the target. Leaving runner only small position and no risk on the trade.

S&P 500 E-mini Futures | 15M | SCALPING TIME | BUYHey There My Friend ; 🫡
SIGNAL ALERT
BUY S&P 500 / 5,586,00 - 5,567,25
🟢TP1: 5,605,50
🟢TP2: 5,646,25
🟢TP3: 5,723,75
🔴SL: 5,514,50
RISK REWARD - 3,00
Thanks to everyone who supports my analysis with likes.💙💙💙

ES Morning Update March 12thSince I prioritize Failed Breakdowns, my job is pretty simple—do absolutely nothing until we get one. This is how you keep an incredibly high wind rate, while easily scaling your accounts. Yesterday, the 5569-72 reclaim triggered the long setup, leading to a 70+ point rally to the 5608 target, where we’re still holding.
As of now:
• 5599, 5569-72 must hold through CPI volatility to keep 5645, 5668, and 5703 in play
• A failure below could open up more downside

S&P 500 – Unstable Ground, Smart Money Seeks Stability🚨 S&P 500 – Unstable Ground, Smart Money Seeks Stability 🚨
“Markets don’t like uncertainty. Money flows where confidence is strong, and right now… that’s NOT here.”
🔥 Key Concerns:
✅ U.S. Policies Creating Instability – A crisis-driven environment shakes investor confidence.
✅ S&P Struggling to Hold Strength – Momentum is weak, smart money is hesitant.
✅ Blue Box = First Resistance Zone – A tough level to break, especially in this macro climate.
💡 The Game Plan:
Short Bias from the Blue Box – Until proven otherwise, this level is resistance.
LTF Breakdowns & CDV Confirmation = High-Probability Shorts – We don’t guess, we react.
No Clean Break Above? The Trend Remains Fragile.
“Markets punish uncertainty. Right now, the S&P is walking on thin ice—be cautious, be tactical.” 🔥📉
I keep my charts clean and simple because I believe clarity leads to better decisions.
My approach is built on years of experience and a solid track record. I don’t claim to know it all, but I’m confident in my ability to spot high-probability setups.
If you would like to learn how to use the heatmap, cumulative volume delta and volume footprint techniques that I use below to determine very accurate demand regions, you can send me a private message. I help anyone who wants it completely free of charge.
I have a long list of my proven technique below:
🎯 ZENUSDT.P: Patience & Profitability | %230 Reaction from the Sniper Entry
🐶 DOGEUSDT.P: Next Move
🎨 RENDERUSDT.P: Opportunity of the Month
💎 ETHUSDT.P: Where to Retrace
🟢 BNBUSDT.P: Potential Surge
📊 BTC Dominance: Reaction Zone
🌊 WAVESUSDT.P: Demand Zone Potential
🟣 UNIUSDT.P: Long-Term Trade
🔵 XRPUSDT.P: Entry Zones
🔗 LINKUSDT.P: Follow The River
📈 BTCUSDT.P: Two Key Demand Zones
🟩 POLUSDT: Bullish Momentum
🌟 PENDLEUSDT.P: Where Opportunity Meets Precision
🔥 BTCUSDT.P: Liquidation of Highly Leveraged Longs
🌊 SOLUSDT.P: SOL's Dip - Your Opportunity
🐸 1000PEPEUSDT.P: Prime Bounce Zone Unlocked
🚀 ETHUSDT.P: Set to Explode - Don't Miss This Game Changer
🤖 IQUSDT: Smart Plan
⚡️ PONDUSDT: A Trade Not Taken Is Better Than a Losing One
💼 STMXUSDT: 2 Buying Areas
🐢 TURBOUSDT: Buy Zones and Buyer Presence
🌍 ICPUSDT.P: Massive Upside Potential | Check the Trade Update For Seeing Results
🟠 IDEXUSDT: Spot Buy Area | %26 Profit if You Trade with MSB
📌 USUALUSDT: Buyers Are Active + %70 Profit in Total
🌟 FORTHUSDT: Sniper Entry +%26 Reaction
🐳 QKCUSDT: Sniper Entry +%57 Reaction
📊 BTC.D: Retest of Key Area Highly Likely
I stopped adding to the list because it's kinda tiring to add 5-10 charts in every move but you can check my profile and see that it goes on..

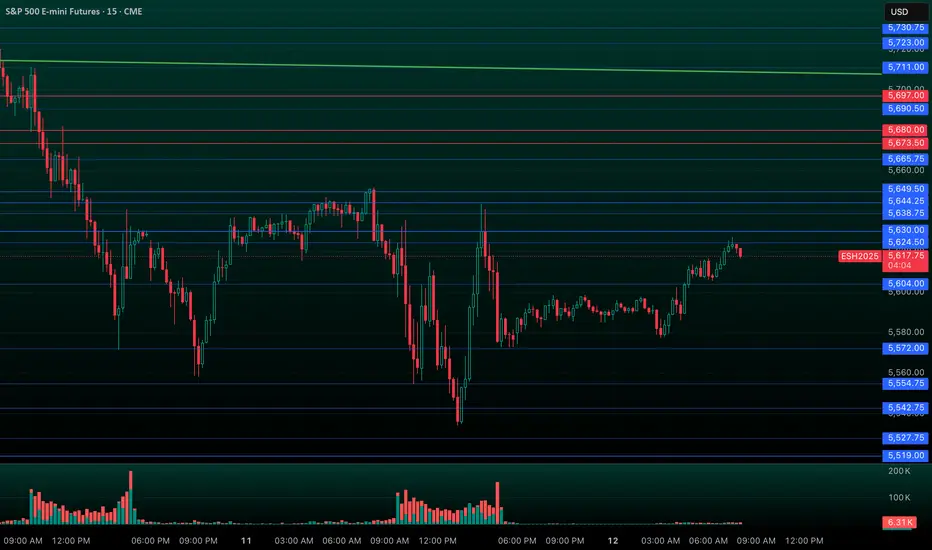
ESH2025Trade Wars waiting for price to drop TO Those Level There is a GAP to the Left The rectangle highlights Area OF Interest and the GAP Also Will Not Trade Until Mitigated

To INFINITY, AND BEYOND!! Double Bottom on the ES 1HThe E-mini S&P 500 (ES) is showing signs of a possible market bottom formation after a significant pullback. We are seeing key support levels around 5600.00 holding strong, and the price action is showing signs of a potential reversal to the upside.

Sellers are slowing downThe price action on the daily chart in the S&P 500 implies sellers are still in the market but they are slowing down. The possibility that we've gotten low enough to find buyers is showing up in the current structure. However, no reason to be a buyer at current levels we need to see upward price movement to give us an indication that buyers are present.

ES (March 2025) - Open Interest @ $2.1MWhen aiming for low hanging fruits, it is imperative to understand the boundaries that price cannot go to within a certain time period if the bias is going to play out.
Ideally, I would want to see Monday to Wednesday's price action to book the highs of the week before declining through the weekly BISI FVG @ 5797.75 - 5752.
Sunday gap opening will determine the likelihood of this bias delivering

S&P futures daily chart reviewThe very basic structure of price action is Spike, Pullback and Channel, final flag, double top and reverse to test the start of the channel. I would expect a minor reversal soon, since the market is so badly oversold, but there will be sellers above and a second leg will take the market to target. The lower probability event is a continued move straight to target. IN either case, the bull case is being badly damaged, and may lead to a 2022 multi-leg selloff.
For the first time since 2022, the trade is bearish, and bears are making money.


ES Morning Update March 11thYesterday marked the largest red day in ES since the August 5 capitulation low. After deep sell-offs, squeezes typically come from my core setup: The Failed Breakdown—which triggered at 9:30 PM, now up +75 points, as outlined in the plan sent out yesterday evening.
As of now:
• Hold the runner
• Next targets: 5668, 5688, 5703
• If 5628 fails, expect a dip to 5609 first

ES1!: Bearish bearish bearish, intra-day levels I feel like I want to be kind this week and share my levels just because so many people are being silly and trying to long a very clear sentiment shift.
Listen, I get it, it was bullish and then it wasn't.
The market makes things reality faster than the human brain and emotions can accept.
You need to be quick to change your tune guys or you're going to continue to sustain losses.
I have been doing this for too long and can come across as harsh to some, but I just don't have time for stupidity.
Market is bearish, until it isn't. Stop trying to get cute.
That said, I am expecting a bounce very soon, we statistically speaking should see a re-test of the ema 200 breakdown within the next few days, if not tomorrow.
The numbers on the levels in the chart represent the probability associated with hitting the levels as a %.
Stick to day trading IMO and play the levels/support and resistance.
Not advice and please please please be safe and use your brain, no your emotions.

LONG ON ESLearning a new strategy, lets see how it does. Been in sell mode for a while now, hoping for a push up. Marked out daily areas and zones.

ES Daily Update - RSI oversold, MFI is not quite there yetHey look, I'm back.
TBH, I got a day job and took a break from day trading, but the Trump tank lured me back into the market the past month, lol. Bit of a rough restart the first week, but made $10k each of the past 3 weeks including today.
I figured something like this was gonna happen today so I carried TSLA puts from Friday. As you can see, futures left an open gap last night, so that caused me to get out of my puts waaaay too early, got into calls too early as well, lost all my profit for the day but made it up in the last hour and bailed, lol. $10k swing 3 times for a lot of heartburn.
Daily RSI hit oversold as did the 3hr, but it looks like MFI needs to hit oversold before we get a pump to fill that open gap. So far, everything is just dumping the Trump pump from November.
Not planning on shorting anything again until the open gap fills, will take another shot at going long if 3 hr RSI and MFI hit oversold again tomorrow or Wed. There's also that Friday afternoon pump that's worth playing if indicators line up.
Sorry, no premarket updates, I'm on east coast time zone and at work at 9:30.
