Bullish Bias, Patient Mindset — Here’s What I’m WatchingAlmost a month ago, we talked about a bullish setup — and that perspective hasn’t changed. I mentioned then that I was “slightly bullish but waiting for confirmation,” and the market has continued to respect that bias.
We're still on that train. 🚆
Take a walk with me as I break down the key areas I'm watching for bullish plays — not just for the next day or two, but looking out into the coming weeks and months. These are the zones I’m monitoring closely for entries, reactions, or potential shifts in structure.
Confirmation is everything. Momentum is building, but patience is how we stay on the right side of the trade.
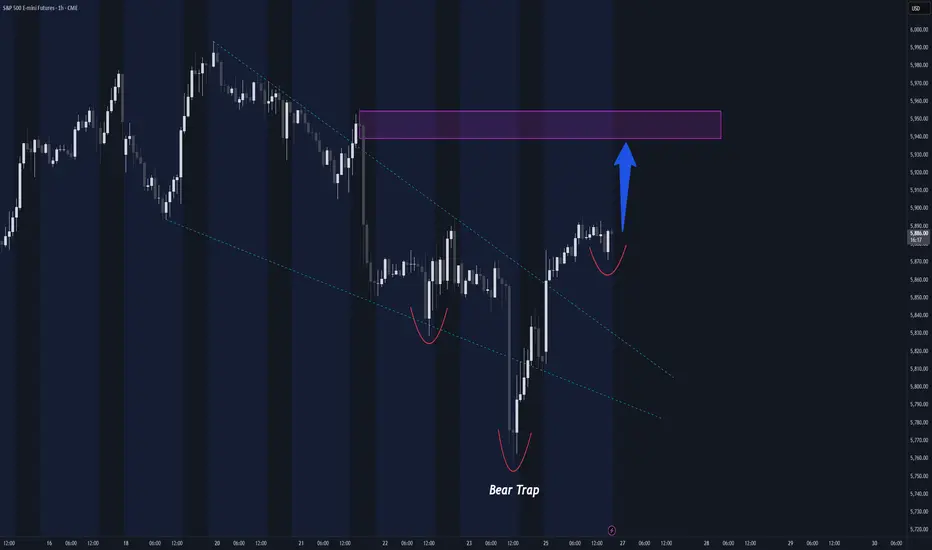
Potential 2:1 SetUP foir a Swing Trade
Buy levels: : 5940
Aggressive entry: 5890 (One opportunity given today)
Passive entry: 5940 (waiting on price)
Take profit : New High : 6166
Stoploss : 5755
MES1! trade ideas


Markets Lower Ahead of Nvidia Earnings Equity Indices traded loEquity Indices traded lower on the session today after seeing strong gains yesterday to start the week with the Russell leading the downside pressure being down near 1%. The FOMC minutes were released this afternoon and showed that the Fed was comfortable with rates remaining unchanged for the time being, and equity markets fell while traders saw Bond Yields trade higher. Gold, Silver and Copper also saw losses on the session with Copper leading the selling pressure being down near 1.5%.
The big news today came after the bell with Nvidia reporting earnings, where they saw a beat on both EPS and Revenue, and the S&P and Nasdaq are seeing some after hours gains. There was news this afternoon as well where President Trump ordered US chip designers to stop selling software to China, which could have longer term effects on the global supply and demand. Looking ahead for the rest of the week, traders will see key economic data looking at jobs and GDP that can add volatility to the equity indices and outside markets like the precious metals or crypto markets.
If you have futures in your trading portfolio, you can check out on CME Group data plans available that suit your trading needs tradingview.com/cme/
*CME Group futures are not suitable for all investors and involve the risk of loss. Copyright © 2023 CME Group Inc.
**All examples in this report are hypothetical interpretations of situations and are used for explanation purposes only. The views in this report reflect solely those of the author and not necessarily those of CME Group or its affiliated institutions. This report and the information herein should not be considered investment advice or the results of actual market experience.

Down to go Up?Looking for demand at lower prices, in order to go up?
Or is this more downside? Thoughts Id like to go lower to tag a demand area, to then go higher into the day, use 3 screen approach

S&P500: Top Within ReachThe S&P has recently continued its upward movement, climbing higher into the magenta-colored Short Target Zone between 5,880 and 6,166 points. Primarily, we expect the top of the current wave (X) in magenta within this price range, after which a downtrend should follow with wave (Y). This final phase of the magenta three-part movement should lead the index into the green Long Target Zone between 4,988 and 4,763 points, completing the overarching green wave there. A rise above the upper boundary of the Target Zone and a breach of resistance at 6,675 points would trigger our alternative scenario.
📈 Over 190 precise analyses, clear entry points, and defined Target Zones - that's what we do.

Buying boost in Asia timesThe S&P 500 daily chart received a buying boost in the Asia time zone after Nvidia reported revenue increasing 12% versus the previous quarter and a 69% increase from a year ago. The next objective is to the upside and a close above 5960

ES with a third left to go in a Triple Three correctionLook for abc, abc, abc to finish (Y) in a move lower.

upside pivs inside 3d/wkly/may boxes sharing the pivs for playing the hunt upside.
this isnt where I buy so these pivs as targets wont serve me... but if you buying the pump, here are the sell boxes and levels within ...
pump fake or not, tick val is the same
interim bear with r1 on 3D @ 6016 and macro bull with s1 @ 5814 -- generous range for everyone .. even more with extension.
appreciate the risk

Continued follow-through to the upside expectedContinued follow-through to the upside is expected on the daily chart for the S&P 500. The next objective to the upside would be 5960.

How to Use Stop Losses in TradingViewThis video covers stop loss orders, explaining what they are, why traders use them, and how to set them up in TradingView.
Disclaimer:
There is a substantial risk of loss in futures trading. Past performance is not indicative of future results. Please trade only with risk capital. We are not responsible for any third-party links, comments, or content shared on TradingView. Any opinions, links, or messages posted by users on TradingView do not represent our views or recommendations. Please exercise your own judgment and due diligence when engaging with any external content or user commentary.
The placement of contingent orders by you or broker, or trading advisor, such as a "stop-loss" or "stop-limit" order, will not necessarily limit your losses to the intended amounts, since market conditions may make it impossible to execute such orders.

Will ES Form Five Waves to Provide Market Clarity?The short-term Elliott Wave analysis for S&P 500 Futures (ES) suggests that the rally from the April 7, 2025 low is progressing as a five-wave impulse pattern, a hallmark of Elliott Wave theory indicating a strong directional trend. Starting from the low, wave 1 advanced to a peak of 5285.5, followed by a corrective wave 2 pullback to 4871.75. Subsequently, the index surged in wave 3, exhibiting a nested sub-structure characteristic of strong bullish momentum. Within wave 3, sub-wave ((i)) reached 5528.75, followed by a shallow sub-wave ((ii)) correction to 5127.25. The index then climbed sharply to 5724.75 in sub-wave ((iii)), with a brief sub-wave ((iv)) pullback to 5596. The final sub-wave ((v)) concluded at 5993.5, completing wave 3 on the 1-hour chart, marking a significant bullish phase.
Wave 4 developed as a zigzag corrective structure, typical for balancing overbought conditions. From the wave 3 high, sub-wave ((a)) declined to 5828.75, followed by a sub-wave ((b)) rebound to 5895. Sub-wave ((c)) then dropped to 5756.5, finalizing wave 4. The index has since turned higher, initiating wave 5. As long as the critical pivot low at 5595.4 remains intact, expect pullbacks to attract buyers in 3, 7, or 11-swing corrective patterns, supporting further upside toward new highs.

Follow through to the upsideWith buyers entering the market on Monday in the S&P 500 daily chart, the expectation is follow-through to the upside with an objective of 5916.

ES Futures Trading Signal - 2025-05-25ES Futures Analysis Summary (2025-05-25)
Comprehensive Summary of Each Model
Grok/xAI Report
Market context: Price $5,875 above 9-, 20-, 21-, 50-day MAs, just under 200-day SMA at $5,804.75; RSI ~59 neutral; price near upper Bollinger Band. Bias: Moderately Bullish, potential breakout above BB. Trade Plan: Long at 5,900; SL 5,840; TP 6,050; 1 contract; confidence 0.65.
Claude/Anthropic Report
Market context: Price above 20/50/200-day SMAs; RSI ~59; MACD histogram slightly negative; healthy pullback within uptrend. Bias: Moderately Bullish. Trade Plan: Long at 5,875; SL 5,825; TP 5,975; 1 contract; confidence 0.68.
Llama/Meta Report
Market context: Price above 20/50-day SMAs, just under 200-day SMA; RSI neutral; BB middle at 5,787.7. Bias: Moderately Bullish. Trade Plan: Long at 5,880; SL 5,810; TP 6,000; 1 contract; confidence 0.65.
Gemini/Google Report
Market context: Price above all key MAs (20/50/200, EMA9/21); RSI neutral; MACD lines above zero but slight bearish cross; recent 24h bounce after 5-day pullback; BB upper at 6,060.7. Bias: Moderately Bullish. Trade Plan: Long at 5,875; SL 5,845; TP 5,935; 1 contract; confidence 0.70.
DeepSeek Report
Market context: Same MAs and indicators, but emphasizes MACD bearish crossover, price rejection at upper BB, recent pullback. Bias: Moderately Bearish near-term. Trade Plan: Short at 5,875; SL 5,925; TP 5,800; 1 contract; confidence 0.65. Areas of Agreement and Disagreement
Agreement:
All models note price trading above short- and medium-term MAs. RSI ~59 (neutral, room to run). BB upper band is resistance; MACD histogram negative. Consensus that recent 5-day pullback is either consolidation (bullish view) or warning sign (bearish view).
Disagreement:
Directional bias: Four models bullish vs. one moderately bearish. Entry levels: range 5,875–5,900. Stop-loss zones: 5,810–5,840. Take-profit zones: 5,935–6,050. Clear Conclusion
Overall Market Direction Consensus: Moderately Bullish Recommended Trade: Long ES futures
Entry Range: 5,870–5,880 (target 5,875) Stop Loss: 5,845 (30-point risk) Take Profit: 5,935 (60-point reward, 2:1 R:R) Position Size: 1 contract (adjust per account risk; ~1% equity) Entry Timing: Market Open Confidence Level: 70%
Key Risks and Considerations:
Short-term bearish MACD crossover may lead to choppy action or minor pullback. Volatility spike at market open can cause slippage. Negative macro or news catalysts can derail technical setup. ES is highly correlated with broader equity futures; cross-asset moves may amplify moves.
TRADE_DETAILS (JSON Format)
{ "instrument": "ES", "direction": "long", "entry_price": 5875.00, "stop_loss": 5845.00, "take_profit": 5935.00, "size": 1, "confidence": 0.70, "entry_timing": "market_open" }
📊 TRADE DETAILS 📊 🎯 Instrument: ES 📈 Direction: LONG 💰 Entry Price: 5875.0 🛑 Stop Loss: 5845.0 🎯 Take Profit: 5935.0 📊 Size: 1 💪 Confidence: 70% ⏰ Entry Timing: market_open
Disclaimer: This newsletter is not trading or investment advice but for general informational purposes only. This newsletter represents my personal opinions based on proprietary research which I am sharing publicly as my personal blog. Futures, stocks, and options trading of any kind involves a lot of risk. No guarantee of any profit whatsoever is made. In fact, you may lose everything you have. So be very careful. I guarantee no profit whatsoever, You assume the entire cost and risk of any trading or investing activities you choose to undertake. You are solely responsible for making your own investment decisions. Owners/authors of this newsletter, its representatives, its principals, its moderators, and its members, are NOT registered as securities broker-dealers or investment advisors either with the U.S. Securities and Exchange Commission, CFTC, or with any other securities/regulatory authority. Consult with a registered investment advisor, broker-dealer, and/or financial advisor. By reading and using this newsletter or any of my publications, you are agreeing to these terms. Any screenshots used here are courtesy of TradingView. I am just an end user with no affiliations with them. Information and quotes shared in this blog can be 100% wrong. Markets are risky and can go to 0 at any time. Furthermore, you will not share or copy any content in this blog as it is the authors' IP. By reading this blog, you accept these terms of conditions and acknowledge I am sharing this blog as my personal trading journal, nothing more.

ES to spike back to its break down level -> 5950Essentially, the 50% EU tariff move was a huge bear trap. Looking for a rapid spike back to 5950 for ES futures.
S&P Futures weekly chart analysis 5-25-25S&P Futures weekly chart analysis 5-25-25
Overall, a bear trend with a strong reversal, and now a L2 sell signal. The sell
signal is right on the EMA, so a lower probability short for Bears, just like the buy on
the bar of April 28th forced bulls to buy right at the EMA and bears got a scalp down.
Likely that the bar of May 19th will trigger. If bears get a strong follow-through bar, then
expect 2 legs sideways to down. It's more likely to trigger and bounce, leaving the bar on the
Monthly chart a small bear or bull doji.
On this chart, the trap bar below should act as support. Also, typically the end of the month
has a bullish bias to it, while the very first of the month often has a bearish bias.
A better setup for the bears will be a reversal up from here. Bears will sell from higher prices.
Best guess for this week - end up down with a tail, allowing the monthly chart to complete as
expected. After this week, I expect a test up but unlikley to get strong continuation up.
Much more likely that we will test down in the coming weeks. Strong bullish trend continuation
in the coming weeks is not expected. This is a strong bear breakout and now a 3 push retracement
to test the BO levels. Bears will want another leg down from here.
Bottom line - expect last week's sell signal to get trigger and some more down from there, but
buyers below at the trap BO above a bear doji. Lower Pb is directly up from here only to set
up a better sell structure for the bears later in the week.

ES1! "E-Mini S&P500" Index Market Bullish Robbery Plan🌟Hi! Hola! Ola! Bonjour! Hallo! Marhaba!🌟
Dear Money Makers & Robbers, 🤑 💰💸✈️
Based on 🔥Thief Trading style technical and fundamental analysis🔥, here is our master plan to heist the ES1! "E-Mini S&P500" Index Market. Please adhere to the strategy I've outlined in the chart, which emphasizes long entry. Our aim is to escape near the high-risk Red Zone Level. Risky level, overbought market, consolidation, trend reversal, trap at the level where traders and bearish robbers are stronger. 🏆💸"Take profit and treat yourself, traders. You deserve it!💪🏆🎉
Entry 📈 : "The heist is on! Wait for the MA line breakout (5830.00) then make your move - Bullish profits await!"
however I advise to Place Buy stop orders above the Moving average (or) Place buy limit orders within a 15 or 30 minute timeframe most recent or swing, low or high level for Pullback entries.
📌I strongly advise you to set an "alert (Alarm)" on your chart so you can see when the breakout entry occurs.
Stop Loss 🛑: "🔊 Yo, listen up! 🗣️ If you're lookin' to get in on a buy stop order, don't even think about settin' that stop loss till after the breakout 🚀. You feel me? Now, if you're smart, you'll place that stop loss where I told you to 📍, but if you're a rebel, you can put it wherever you like 🤪 - just don't say I didn't warn you ⚠️. You're playin' with fire 🔥, and it's your risk, not mine 👊."
📍 Thief SL placed at the recent/swing low level Using the 4H timeframe (5600.00) Day/Swing trade basis.
📍 SL is based on your risk of the trade, lot size and how many multiple orders you have to take.
🏴☠️Target 🎯: 6100.00 (or) Escape Before the Target.
🧲Scalpers, take note 👀 : only scalp on the Long side. If you have a lot of money, you can go straight away; if not, you can join swing traders and carry out the robbery plan. Use trailing SL to safeguard your money 💰.
💰💵💸ES1! "E-Mini S&P500" Index Market Heist (Swing Trade Plan) is currently experiencing a neutral trend there is high chance for bullishness,., driven by several key factors. .☝☝☝
⚠️Trading Alert : News Releases and Position Management 📰 🗞️ 🚫🚏
As a reminder, news releases can have a significant impact on market prices and volatility. To minimize potential losses and protect your running positions,
we recommend the following:
Avoid taking new trades during news releases
Use trailing stop-loss orders to protect your running positions and lock in profits
💖Supporting our robbery plan 💥Hit the Boost Button💥 will enable us to effortlessly make and steal money 💰💵. Boost the strength of our robbery team. Every day in this market make money with ease by using the Thief Trading Style.🏆💪🤝❤️🎉🚀
I'll see you soon with another heist plan, so stay tuned 🤑🐱👤🤗🤩

ES1 (S&P500) Potential Long playPotential Long Play
Weekly Demand Zone Level over level with Daily Demand zone Located, low in location.
Fundamentals: Seasonality Shows up, Retailers are extremely short, Valuation is kind of high, but not extremely overvalued yet.
Keep this play in Mind.

Stock Markets, Gold, Silver: Run With The Bulls!In this Weekly Market Forecast, we will analyze the S&P 500, NASDAQ, DOW JONES, Gold and Silver futures, for the week of May 25 - 31st.
The Stock Markets are bullish, so run with valid buy setups when they form.
Gold and Silver are relatively strong. With tensions in Gaza and Iran, this is expected. Valid buys should be taken.
Crude Oil is a tad bearish due to US inventories, so valid sells are warranted in the short term.
Enjoy!
May profits be upon you.
Leave any questions or comments in the comment section.
I appreciate any feedback from my viewers!
Like and/or subscribe if you want more accurate analysis.
Thank you so much!
Disclaimer:
I do not provide personal investment advice and I am not a qualified licensed investment advisor.
All information found here, including any ideas, opinions, views, predictions, forecasts, commentaries, suggestions, expressed or implied herein, are for informational, entertainment or educational purposes only and should not be construed as personal investment advice. While the information provided is believed to be accurate, it may include errors or inaccuracies.
I will not and cannot be held liable for any actions you take as a result of anything you read here.
Conduct your own due diligence, or consult a licensed financial advisor or broker before making any and all investment decisions. Any investments, trades, speculations, or decisions made on the basis of any information found on this channel, expressed or implied herein, are committed at your own risk, financial or otherwise.

Inside dayThe expectation for the short session on Monday is to trade inside the Fridays range on the daily chart in the S&P 500.

classic level to levelso we broke down from the big rising wedge into a flat bearflag
now we are making another bearflag and we break down from a neckline retest.
we are heading for a monthly value area low rotation
its an easy market theory analysis. nothing much but simple math

CME Gap Aligns with 4h 200 EMAThe CME Gap around 5710-5730 is beginning to align with the 4h 200 EMA.
4h RSI has been diverging bearish 3 times with each leg up within the channel above.
Also, a breakdown of that channel has measured moves down that align with both the 4h 50 and 200 EMA:
- 50 EMA an 0.5x measured move down
- 200 EMA a 2.5x measured move down
Pre-req on targeting the gap is a breakdown of the parallel channel shown above, and then loss of the 4h 50 EMA.
Good luck!

YBR ... Wealth Strategy 5-22-25low risk wealth strategy using bull put spreads approx 30 days to expiration ... trying to receive a annual rio of 15% or higher .... using alert on the mes incase of an armageddon move of market to the downside

New All Time High This Summer?Market is showing real strength here. After the uncertainty and those tariff windfalls, price is recovering well and looks like it’s setting up for continuation.
As long as we stay above that Monthly FVG, I think the path to a new all time high this summer is pretty realistic. That could possibly be supported by Nvidia earnings in late May and interest rate cut in June.
What are your thoughts?
