NQ Range (07-02-25)NAZ will have to get some help with a Tweet or two in order to get above KL 22,881. This Post will have Monday close as end point. Look for the long weekend to use the Pop Trick into Monday and if not, we have a decent short developing. BTD/FOMO Forever, you don't even need much volume or fundamental/technical reasons.
MNQM2021 trade ideas

AMP Futures - How to enable the floating data window.In this idea we will demonstrate how to access the new floating data window using TradingView.

July 7 - 11: Buy Stock Indices DIPs! Watch For Gold, Oil FVGs!In this Weekly Market Forecast, we will analyze the S&P 500, NASDAQ, DOW JONES, Gold and Silver futures, for the week of July 7 - 11th.
Stock Indices are strong, so dip opportunities should present themselves next week.
Gold is bullish-neutral. Could see strength enter this market as July 9th approaches.
Silver is bullish. No reason to short it.
Oil is in a Monthly +FVG. If the FVG fails, it will confirm bearishness. Couple that with the fundamentals, I am watching for that confirmations to sell US Oil.
Enjoy!
May profits be upon you.
Leave any questions or comments in the comment section.
I appreciate any feedback from my viewers!
Like and/or subscribe if you want more accurate analysis.
Thank you so much!
Disclaimer:
I do not provide personal investment advice and I am not a qualified licensed investment advisor.
All information found here, including any ideas, opinions, views, predictions, forecasts, commentaries, suggestions, expressed or implied herein, are for informational, entertainment or educational purposes only and should not be construed as personal investment advice. While the information provided is believed to be accurate, it may include errors or inaccuracies.
I will not and cannot be held liable for any actions you take as a result of anything you read here.
Conduct your own due diligence, or consult a licensed financial advisor or broker before making any and all investment decisions. Any investments, trades, speculations, or decisions made on the basis of any information found on this channel, expressed or implied herein, are committed at your own risk, financial or otherwise.

10a4h PO3 $MNQ 10a4h PO3:
Weekly Bias = Bullish. Liquidity Targets hit. Projection Targets still in play.
Daily Bias = Bullish. Liquidity target hit.
4h Candle Closure Bias = Bullish
Structural Bias = Bullish
Waiting for 15m Liquidity Sweep or Tap into 15m BISI
Entry = 3m +CISD
Partial = 2R
Runner = 4h -2 STDV (21,562 to 22,130.75)

Trade idea - Powell concept
Bearish Bias coming into the day, had a low close Previous day. PXL & PXH indicates price will go lower.
IF we take out the EQH and tap the rejection block, i would not be mad to take a short there. Targeting NDOG, not mad if it gonna be a lose either :)

NASDAQ Futures: My Plan for current Week (7-11 July, 2025)Week: July 7–11, 2025
Instrument: NASDAQ Futures (NQ)
Trend: Overall, the market remains bullish, but for this week I anticipate a retracement targeting the $22,582 level.
Bias for the week: Bearish
Overview:
This week, I’m watching NQ for a potential move toward the $22,582 level. This expectation is based on how Thursday (July 3, 2025) played out—specifically the buy-side liquidity that was taken, and the clean sell-side liquidity pool left near $22,582.
I also find it notable how the NWOG (New Week Opening Gap) was opened and how price moved below it, which reinforces the short bias.
I would consider opening a short position once I see a confirmed 4H candle close below $22,760, otherwise no trades will be taken.
* Trade execution details will be published separately if my bias confirms.
* for more information -> review my notes on the chart

From daveteaches 001Waited 9am - 10am
Give a 9am 1 hr candle zone with Fibonacci level.
Slight pullback from 0.3 and all the way down.

If we are still bullish futures look to expect these levels. If we are still trending bullish a return back to the old gap low found in the fib & the fvg within the 1hr time fractal .. with a continuation of higher futures - we can see the level delineating in gray lines are my upside targets to see want to reprice to in a order to continue higher.

NQ Short (07-01-25)YTD Open level is Blue line below. NAZ up 8% YTD and 40% from YTD low. We may see 8-10% range be the drop zone and retest the YTD Open Level. 22,800 -21,800 has been an extremely low volume 1,000 1 way ride up (not seeing any selling). We should see the sell side show up as NAZ should drop back in the 1,000 soft zone.
4HR YTD Chart below:

NASDAQ: Minor Pullback, Still on TrackOn Friday, the Nasdaq experienced a slight pullback, which was quickly absorbed at the start of the week. Currently, the index is still developing the turquoise wave B, which should top out just below resistance at 23,780 points, signaling the start of the bearish wave C. This move should lead to the low of the magenta wave (4) within our turquoise Target Zone between 17,074 and 15,867 points. Alternatively, there is a 42% probability that wave alt.(4) is already complete. In this scenario, the magenta wave alt.(5) could carry the index immediately above the mentioned resistance.
📈 Over 190 precise analyses, clear entry points, and defined Target Zones - that's what we do.

Expection for NQ London and NY SessionHi everyone, I expect London to Manipulate up, or down. The NY Move will then be a reversal of this move.
IF we stay in the Asian Range I expect the NY Session to take out either high, or low and then reverse to the opposite

NASDAQ / $NQ!! Projecting the Next CycleIf history rhymes, we should see:
A 6–7 000‑point gentle climb (blue “2”) off the 17 000 springboard into ~23–24 000.
Followed by a sharper 8 000‑point blow‑off (blue “3”) into the low‑30 000s.
Of course, any big exogenous shock (geopolitics, Fed surprise) can alter the timing—but structurally the chart wants to repeat its 1→2→3 cycle into 2026.

Nasdaq (NQ) Continues Bullish Cycle, Reaching New All-Time HighThe Nasdaq (NQ) has surged to a new all-time high, reaffirming the strength of its ongoing bullish trend. The index established a significant low on April 7, 2025, at 16,460, following a sell-off triggered by tariff war concerns. This low marked a critical turning point, from which the Nasdaq embarked on a robust upward trajectory, unfolding in a five-wave impulse structure as per Elliott Wave analysis.
From the April 7 low, wave 1 peaked at 18,357.25. A corrective wave 2 then followed which bottomed at 16,735. The index then rallied in wave 3, reaching 22,222, before a shallow wave 4 pullback concluded at 21,565.17, as illustrated on the one-hour chart. Currently, wave 5 is in progress, exhibiting an internal impulse structure in a lesser degree. Within this wave 5, wave (i) topped at 21,944.25, with wave (ii) finding support at 21,738.25. Wave (iii) extended to 22,915, followed by a wave (iv) correction that ended at 22,781. The final wave (v) is expected to conclude soon, completing wave ((i)) of the higher-degree wave 5.
Looking ahead, a wave ((ii)) pullback is anticipated to correct the cycle from the June 23, 2025 low, likely unfolding in a 3, 7, or 11-swing pattern before the index resumes its ascent. In the near term, as long as the pivot low at 21,565.17 holds, any dips should find support in a 3, 7, or 11-swing structure, paving the way for further upside. This technical outlook underscores the Nasdaq’s resilience and potential for continued gains, provided key support levels remain intact.

2025-06-30 - priceactiontds - daily update - nasdaqGood Evening and I hope you are well.
comment: Closing this high at the end of the month is as bullish as it gets. We are close to 23000 that I expect it to get hit. You never know where the top will be, so don’t try to pick it. Market is bullish and bullish only. Even if we print -2% tomorrow, there was no setup and no pattern for you to trade it on. It would be a huge bear surprise and you should never worry about them. Look for the path of least resistance and that is still long. At least for scalps. Bull channel is also still valid until clearly broken, which means a strong print below 22700 would do.
current market cycle: bull trend
key levels: 22600 - 23000
bull case: Bulls want 23000. Market is overbought but that does not matter if we can’t get more selling pressure. Long the pullbacks until it stops working. I can see this going to 23500 but it’s a rough guess and you should not trade based on those.
Invalidation is below 22200.
bear case: Bears got nothing. Don’t look for shorts. Daily close below 22600, then we can start thinking about lower prices again. I still expect this breakout to fail but as of now, we are only going up.
Invalidation is above 23500.
short term: Neutral but I will only scalp long until we see much much bigger selling pressure. 23000 is the obvious target and bears need something below 23700.
medium-long term - Update from 2024-06-29: No change in plans. I expect 20000 to get hit over the next 3 months and maybe 19000 again.
trade of the day: Any long around the high of last week (22823) has been profitable. It was a tight trading range but with a heavy bullish bias going in to today, long scalps were the obvious choice.

What next for the NQ Futures I updated a chart I published a month ago, when I believed we were in a correction and would not make new highs yet. We have and believe that we will see a correction from here into the end of September 2025, before we can again post gains going into the 4th quarter.

Weekly Analysis For NQ/NAS100Price action has been bullish with COT data supporting upside potential.

Weekly Market Outlook: E-mini Nasdaq 100 Futures NQCME_MINI:NQ1!
It’s a quiet week for US economic news. However, the RBA and RBNZ are scheduled to announce interest rate decisions.
As has been the theme this year, markets remain highly sensitive to headline news and associated risks.
US President Trump signed the One Big Beautiful Bill Act into law at the White House.
Treasury Secretary Bessent is currently giving an interview on CNBC as we write this outlook. Explanation of the near-term impact of Trump’s BBB Act, tariffs, and trade deals will be key to monitor, as this may be fuel for further movement. The US is set to announce more trade deals in the next 48 hours, while trading partners who did not reach a deal will revert to April 2nd tariff levels, with the tariffs to take effect on August 1st.
As many as 100 smaller countries will get a set tariff rate.
How does this all translate into price action and expectations for the market?
NQ and ES are currently trading near all-time highs. RTY has potential upside as it plays catch-up. With the BBB Act signed into law, many of the investment banks anticipate a near-term positive impact on GDP.
In NQ, we are looking at the following scenarios:
Key LIS zone: 22860.50 – 22825.50
Support Zone: 22600 – 22582.25
Key Support Zone: 22000 – 22050
Scenario 1: Hold above key LIS
In this scenario, we expect new ATHs and continuing price discovery higher.
Scenario 2: Hold below key LIS
In this scenario, we expect the price to re-test the support zone at 22600 – 22582.25 and consolidate to build value higher. A break below support may lead to further short opportunities to retest the 22000 level.

NQ Range (07-08-25)White arrow is stall/drop zone and yellow is strong short. The O/N continues to reset any drops that happen in most Reg Sessions. It appears to me that a weak/fake Euphoric Stage is being played out. The idea of chasing the NAZ (after the O/N redirect) is the game, no chase and the game will end. The O/N has been redirecting for about 2 years (can continue). Again, the recent 25% drop was erased with a Tweet & news release (10 min 2,000 point) move and a few O/N's. Just feels like a fake chase play since the pop of the bottom.

NASDAQ – Will It Hold or Collapse Further?📉🔥 NASDAQ Approaching Max Pain – Will It Hold or Collapse Further? 🚀⚠️
The NASDAQ 100 is hanging by a thread, as price approaches the key 19,106 support level. A breakdown from here could accelerate losses toward the 18,283 zone, and if things get worse, the dreaded 16,732 "Max Pain" level may be tested.
📊 Key Technical Levels:
📌 19,106 – First major support (bounce or breakdown zone).
📌 18,283 – Next key level if sellers take control.
📌 16,732 – The "Max Pain" zone, where long-term buyers may step in.
📌 15,347 – Ultimate demand zone if things spiral out of control.
🚨 Why Is Nasdaq Falling?
Tech stocks are getting destroyed, with Tesla leading the plunge.
Market panic over higher interest rates & economic uncertainty.
Bitcoin also struggling, highlighting broader risk-off sentiment.
💡 Will we see a relief rally from these levels, or is the bloodbath just getting started?
Drop your thoughts below!
One Love,
The FXPROFESSOR 💙
#Nasdaq #StockMarketCrash #TechStocks #Trading #MarketAnalysis

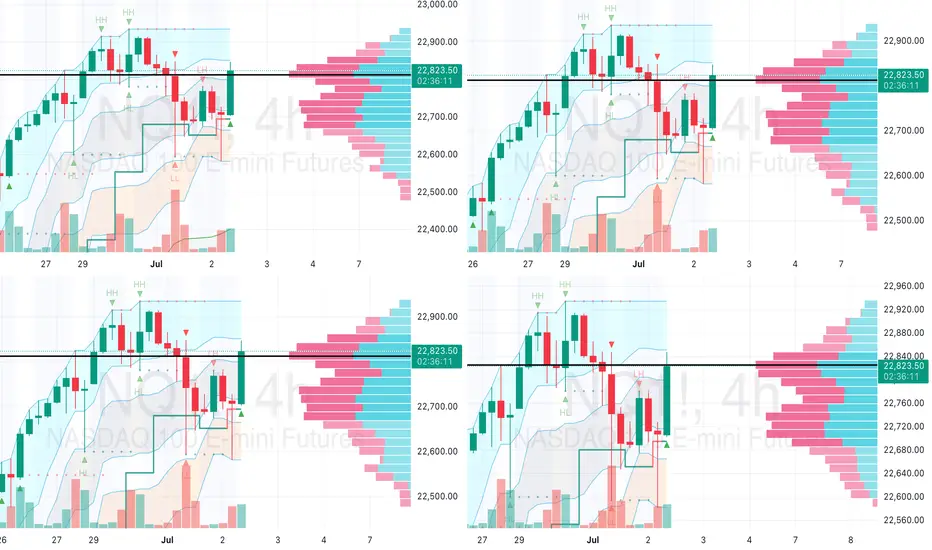
NQ (NASDAQ 100 E-Mini Futures) Market AnalysisKey Observations
The NQ is currently trading at 22,706.50, with a high of 22,847.50 and a low of 22,702.75, based on the 4-hour chart provided, timestamped at 11:22:26 UTC (7:22:26 AM EDT).
The price has pulled back from a recent high of 22,829.00 (recorded at 02:37:34) and is testing support near 22,700–22,720.
The market shows a short-term consolidation after a strong upward move, with potential for further direction depending on upcoming economic data.
Technical Analysis
Price Action: The chart displays a series of higher highs and higher lows since late June, indicating an overall uptrend. However, the recent red candles and rejection at 22,829.00 suggest a possible short-term reversal or pause. The current level of 22,706.50 is near a support zone marked by previous consolidation.
Volume Profile: The right-hand volume profile highlights high volume nodes (HVNs) between 22,700 and 22,829, with the point of control (POC) around 22,829.00. The pink bars (selling volume) dominate above 22,829, indicating strong resistance, while teal bars (buying volume) are concentrated around 22,700–22,720, suggesting a support area.
Support and Resistance:
Support: 22,700–22,720 (current level and volume-based support), with deeper support at 22,600–22,650 if the price breaks lower.
Resistance: 22,829.00 (recent high and POC), with a psychological barrier at 23,000 if bullish momentum resumes.
Indicators: The Market Profile (e.g., HH, HL, LH, LL) shows a value area narrowing near 22,700–22,829, indicating indecision. The presence of multiple timeframes (4-hour) suggests this is a key level for swing traders.
Market Context
The pullback aligns with recent economic data, including the June 2025 ADP employment report (released July 02), which reported a loss of 33,000 jobs, below the expected 100,000. This could signal economic slowdown, impacting tech-heavy indices like the NASDAQ 100.
Negative sentiment around Tesla, a significant NQ component, due to an Elon Musk-Donald Trump incident, may be contributing to the pressure.
The Nonfarm Payrolls report on July 03, 2025, is a critical upcoming event. A weaker result (forecasted at 110,000 jobs) could exacerbate selling, while a strong report might support a recovery.
Scenarios
Bullish Case: If the price holds above 22,700 and breaks 22,829 with increased buying volume, it could target 23,000. Look for a strong bullish candle to confirm.
Bearish Case: A break below 22,700 could see the price drop to 22,600–22,650, with further downside possible if selling intensifies.
Volatility: Expect increased volatility ahead of the Nonfarm Payrolls data, given its potential to sway market direction.
NQ Power Range Report with FIB Ext - 7/8/2025 SessionCME_MINI:NQU2025
- PR High: 22853.50
- PR Low: 22808.50
- NZ Spread: 100.5
No key scheduled economic events
Session Open Stats (As of 12:25 AM 7/8)
- Session Open ATR: 318.85
- Volume: 24K
- Open Int: 269K
- Trend Grade: Neutral
- From BA ATH: -0.8% (Rounded)
Key Levels (Rounded - Think of these as ranges)
- Long: 23239
- Mid: 21525
- Short: 20383
Keep in mind this is not speculation or a prediction. Only a report of the Power Range with Fib extensions for target hunting. Do your DD! You determine your risk tolerance. You are fully capable of making your own decisions.
BA: Back Adjusted
BuZ/BeZ: Bull Zone / Bear Zone
NZ: Neutral Zone

Preventing Holiday Schedule Glitches in Automated Futures Trade
Yesterday the market closed at 1:00 PM, and I still had two open positions. Normally my algorithm sends an “exit all” signal at 3:59 PM EST to close every futures contract, but it didn’t account for the holiday schedule. That glitch cost me $5,000 in just a few hours. Lesson learned.

NQ Power Range Report with FIB Ext - 7/7/2025 SessionCME_MINI:NQU2025
- PR High: 23028.50
- PR Low: 22943.00
- NZ Spread: 191.25
No key scheduled economic events
First full trading day following long holiday weekend
Session Open Stats (As of 12:45 AM 7/7)
- Session Open ATR: 323.71
- Volume: 33K
- Open Int: 271K
- Trend Grade: Neutral
- From BA ATH: -0.6% (Rounded)
Key Levels (Rounded - Think of these as ranges)
- Long: 23239
- Mid: 21525
- Short: 20383
Keep in mind this is not speculation or a prediction. Only a report of the Power Range with Fib extensions for target hunting. Do your DD! You determine your risk tolerance. You are fully capable of making your own decisions.
BA: Back Adjusted
BuZ/BeZ: Bull Zone / Bear Zone
NZ: Neutral Zone
