MNQ at Critical Breakout Zone – Watch for 385-Day Trend Formatio
📌 Trade Idea: MNQ at Critical Breakout Zone – Watch for 385-Day Trend Formation
Before discussing near-term action, we must emphasize the importance of NQ and MNQ — these futures contracts are considered the most accurate forward indicators of the US stock market’s direction, especially for the technology sector. While ES (S&P500 futures) reflects the broader market, MNQ/NQ provides sharper insight into tech momentum.
🕒 Weekly Pattern View
On the weekly timeframe, MNQ is showing a clear bullish trend, with price structure resembling a potential bullish abandoned baby pattern — typically signaling a strong reversal from bearish to bullish.
📅 Daily Structure & Breakout Watch Zone
On the daily chart, the 21,549 – 22,135 zone is the critical breakout range.
If MNQ successfully breaks above this zone, it may trigger the start of a new 385-day bullish trend cycle.
This breakout phase may stretch up to 31 days before confirmation is fully established.
⚠️ Trading Strategy Guidance
At this stage, patience is key —
❌ Avoid rushing into short positions near the breakout zone.
✅ Favor the bullish bias, as structure and volume are still tilted toward upward continuation.
⚠️ Be cautious of false breakouts or sharp pullbacks (cat bounce) within this zone — it’s a high-risk area for both sides.
💡 Conclusion:
MNQ is currently sitting at a pivotal level. If a breakout holds, it could lead to the formation of a powerful upward trend for the next quarter. This is not the time to short blindly — instead, wait for breakout confirmation, monitor pullbacks, and apply trailing stop risk management for position entries.
Disclaimer:
This trade idea is for educational purposes only and does not constitute financial advice. Trading involves risk. Always conduct your own analysis or consult a financial advisor before making trading decisions.
MNQ1! trade ideas

Nasdaq Signals Economic Instability – Are You Watching CloselyDear traders,
You may be witnessing a “first” — a pivotal moment right before things begin to spiral.
We’re not fortune tellers. We don’t claim to predict the future.
But what you’re about to read is based entirely on publicly available data, interpreted not through speculation, but through a deep, rational analysis of interconnected facts — the kind of connections that most overlook, and few dare to question.
We may not know how the future is being orchestrated behind the scenes...
But one thing seems certain: crisis always comes first... and then we are given a narrative to justify it — be it war, a pandemic, or a "global emergency."
This is the correct sequence... and it’s the one they never teach you.
Yet for those of us who navigate the financial markets, one question matters more than all others:
How do we profit from this?
We recently shared an important setup on the Nasdaq index, the benchmark that reflects — to a large extent — the true state of the U.S. economy.
As a proxy for the 100 largest American corporations, the Nasdaq plays a critical role in signaling macro trends.
And while some are just now waking up to the storm ahead, our outlook has been clear since October 2022:
A major economic crisis was not only probable… it was inevitable.
Some analysts chalk this up to uncontrolled money printing post-2019 as governments tried to patch the damage from the COVID-19 crisis. That’s one explanation.
But at Glich, our vision is different.
More complex.
And for now… not something we can fully release.
For years, strong correlations between risk markets — especially U.S. equities and crypto — held firmly in place.
But something changed on May 30th, 2025. Completely and unmistakably.
The link was severed.
Now ask yourself:
Why was Bitcoin created in the first place?
It wasn’t just digital money.
It was a bold, revolutionary idea. A system designed for a future economy no longer shackled by inflation, central banking failures, or hidden agendas.
A fluid, transparent, and secure network for a world in desperate need of change.
The current financial model is obsolete. It’s no longer evolving — just surviving.
And it can no longer answer the challenges of what's to come.
2008 was not the collapse; it was the setup. A convenient pretext to slowly roll out something new.
And "Satoshi Nakamoto"? Well, let’s just say...
That name means more than you think.
"HIDDEN INFORMATION" 👁️
What does NEO mean when he says:
"This has all happened before… yet it’s happening for the first time"?
And what does that have to do with us?
This analysis is not just about charts or setups.
It’s a hidden message — a spotlight on a once-in-a-generation opportunity lying in plain sight.
But not everyone is trained to read between the lines.
Let us ask:
Why was Donald Trump specifically pushed into position?
Why is crypto — after being suppressed, banned and attacked worldwide — now being quietly promoted and fast-tracked in legislation during 2024 and 2025?
Something’s moving beneath the surface.
🔍 In summary:
Expect a tidal wave of global crypto legislation to pass in the coming days/weeks/months.
Crypto — particularly BTC and ETH — will become silent stores of value during the economic storm.
Expect record-breaking levels:
400
K
f
o
r
B
i
t
c
o
i
n
∗
∗
,
∗
∗
400KforBitcoin∗∗,∗∗40K for Ethereum.
Yes, this may sound like science fiction…
But keep your eyes and ears wide open. 👁️
And brace yourself for a historic collapse in U.S. equities. Possibly… something we’ve never seen before.
The show is starting.
And we won’t spoil the ending — because watching it unfold is part of the experience.
But here’s what we can say, thanks to our proprietary algorithmic system:
The U.S. economy will bleed.
And crypto will blow past expectations — fulfilling the very purpose it was built for.
🛒 Load your bags in the coming days...
Because when this train leaves the station —
It won't be stopping for anyone.

#202522 - priceactiontds - weekly update - nasdaqGood Day and I hope you are well.
comment: Not much difference to the dax or sp500, so you can skip the text and just watch the chart. Should look similar to you and you should trade it the same. If you have not read my dax update, please go read it.
current market cycle: trading range
key levels for next week: 20700 - 22000
bull case: Bulls are trapping bears into decent looking shorts just to reverse them strongly. Bulls are still hopeful af and until we have a daily close below 20700, the bull wedge is alive and can lead to higher prices. Bulls are heavily favored to continue until then. Target is obviously 22000.
Invalidation is below 20600.
bear case: Bears need a daily close below 22700 and close the giant gap down to 20200. Until then they have been making money shorting new highs but only for scalps. If we get another good move down next week, you should take big profits before they vanish again. Daily 20ema held for 6 weeks now, expect the next touch to get bought as well.
Invalidation is above 22100.
short term: Bullish that we stay above 20700 and hit 22000 next week. The buying on Friday was so strong, that we can expect higher prices. I will need strong signals though since we had bad news after hours Friday and Friday was also end of month, which can always distort the market bias somewhat.
medium-long term - Update from 2024-06-01: Market is refusing to go down but I can not see this going much more up. Maybe we hit 22000 maybe we don’t. My assumption is still that latest around end of June we begin to decline over the summer. If EU tariffs go through next week or there is no really good news before end of day Friday, expect a blood bath if they come into effect. It’s a trade embargo. No one will ship anything with 50% on top of it and markets are trading like everything is literally perfect.

NASDAQ Meltdown Incoming? The Calm Before the Crash…🚨 Get ready! The NASDAQ is about to take us on a wild plunge straight to the depths of market hell... 💥🔥
Yes, yes, I know—they’ll say it’s all "because of this" or "due to that," the usual play-acting we’ve seen a hundred times before. Just another scene in the never-ending economic theater. 🎭
But here’s the forecast for tomorrow’s news:
📉 United States Initial Jobless Claims – possibly lower than expected?
📈 United States GDP Growth Rate QoQ – higher than expected?
And then... yada yada yada. You know the rest.
What does that mean? A chain reaction in risk-on assets — stocks, indexes, crypto — all heading for a steep drop. 💣📉
If you’re still a believer, here’s your solid proof — laid out 24 hours before it happens. Don’t say we didn’t warn you.
The choice is yours:
💊 Red pill or blue pill?

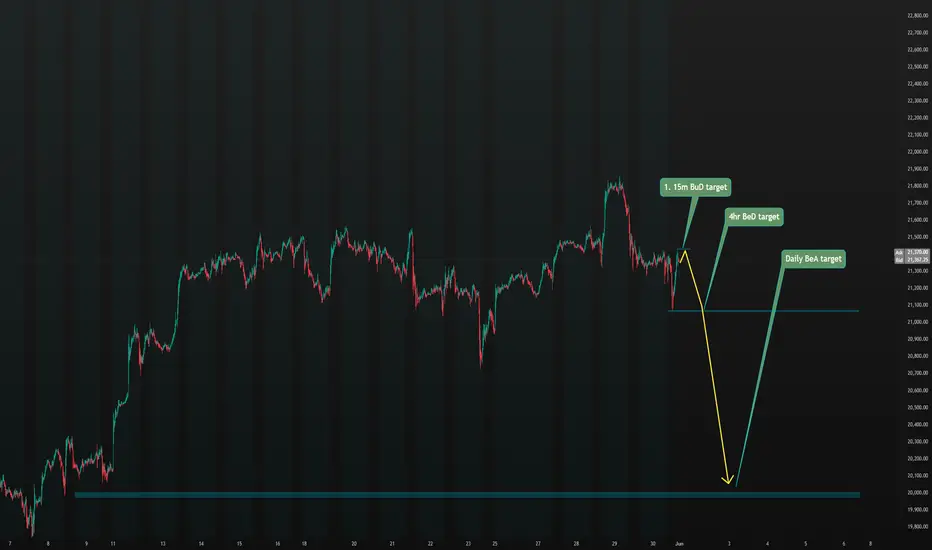
E-Mini Nasdaq 100 analysis based on Heiken-Ashi15m, 4hr, daily forecast based on Heiken-Ashi chart pattern, as I couldn't find any patterns on 1 hour chart, ones that found were already validated by this time. We'll come back to this to validate it.
nasdaq trade ideaslooking to short the open on sunday with limit orders on potential lows needs to gap atleast 100 points for me to wanna short.. targeting levels lower, like a 50%-61.8% retracement from mays lows to current highs... if we do not have a good opening gap to the downside i see a potential reversal pattern forming... price has hit the 4h bollinger band lows.. giving a potential oversold signal. want to see price put a low in ontop of the 4h bollinger band mid point confirming the trend has reversed before going long..

NQ_F should be interesting this month CME_MINI:NQ1! is at a pivot-point - prepare yourself. NASDAQ:QQQ

nas lookingg bearishrecently broke down out of the hr uptrend also we can see that price has broke the support that was created around 21350
I believe we will see a massive drop taking out the lows of
April 25th
trading is risky plz use proper risk management if you decide to trade the Financial markets!

How To Read Trading ChartsIn this video, I discuss how to read and interpret the bars/candles on a chart so you can begin to learn price action.

Sell then Buy NQSelling from market vol movement. Buy for sustained trend similar to Gold. Slipping for too many reasons

Nasdaq Next Week and June Month ForecastNotice Monthly Candle distribution phase prior to the closure. Today might remain still and whips recent swings highs and lows as a reaction from the D +orderblock
Next week is likely to decline and open the monthly range with an accumulation inside the W BISI and THEN continue higher throughout the rest of the month and reach 22,672.00

NQ Power Range Report with FIB Ext - 5/30/2025 SessionCME_MINI:NQM2025
- PR High: 21395.25
- PR Low: 21335.25
- NZ Spread: 134.0
Key scheduled economic events:
08:30 | Core PCE Price Index (YoY|MoM)
09:45 | Chicago PMI
Rotation off 21850
- Previous session print advertising decline back to week low
Session Open Stats (As of 1:25 AM 5/30)
- Session Open ATR: 446.48
- Volume: 33K
- Open Int: 267K
- Trend Grade: Neutral
- From BA ATH: -5.6% (Rounded)
Key Levels (Rounded - Think of these as ranges)
- Long: 22096
- Mid: 20383
- Short: 19246
Keep in mind this is not speculation or a prediction. Only a report of the Power Range with Fib extensions for target hunting. Do your DD! You determine your risk tolerance. You are fully capable of making your own decisions.
BA: Back Adjusted
BuZ/BeZ: Bull Zone / Bear Zone
NZ: Neutral Zone

NQ Daily Orderflow, MMXM swing points Market Efficiency ParadigmDaily orderflow on NQ. How it formed why it formed. Using Internal Liquidity and sub Internal Liquidity

25.05.30 nasdaq analysis📊
📌 Previous Trade Summary
Most traders anticipated an upward move due to the previous day's rally.
However, a bearish trendline breakdown led to a sell-off.
A short entry became valid, marked with a red circle on the chart.
Result: ~139 points gained per contract, approx. $2,800 profit.
🕓
Currently, the 4-hour chart shows support at the 60EMA,
but the overall structure remains bearish due to a trendline breakdown.
If the 60EMA fails to hold, a stronger downtrend could unfold.
The morning low at 21,268.50 could act as a potential rebound zone.
➡️ No clear short signal at the moment – waiting for more structure.
📈
The key to a long entry lies in breaking the short-term resistance trendline.
A full bullish trend reversal is expected only above 21,557.75.
Until then, take-profits at stepwise levels remain the strategy.
🟢 Long Entry Condition
Entry: Above 21,417.5
TP1: 21,447
TP2: 21,485
TP3: 21,522
TP4: 21,557 (trend reversal confirmation)
🔴 Stop Loss
If the 15-minute candle closes below the 20EMA after entry → cut losses.
📌 Summary
Short setup: Requires more confirmation, no entry for now.
Long setup: Valid above 21,417.5 with targets up to 21,557.
Trend reversal key level: 21,557 breakout.
Avoid anticipation—enter only when conditions are met.

NQ Breakdown Plan: 3 Targets, 1 Setup, No Chasing🧠 NQ Short Plan – NY Open Game Plan
Price has pulled back into a key structure zone, and I’m watching closely for a sell setup during the first two hours of the New York session tomorrow.
📌 My trade plan is simple:
I want a solid pullback first — not chasing here.
If I get a clean sell trigger (candle confirmation or momentum flush), I’m in.
Break-even gets locked in once we break the 21,349 area.
From there, I’ll take profits in three stages and trail the stop behind price if we get momentum.
🔐 Break-Even Lock: 21,349
✅ TP #1 – 21,200
✅ TP #2 – 21,050
✅ TP #3 – 20,800 (final leg if sellers step in hard)
The rising trendline break could be the domino. If it cracks, we roll.
But if bulls defend again, no trade — discipline first.
📅 Session Focus: Only trading this setup if it unfolds in the first 2 hours of NY open. After that, I’m out.
No chasing. No revenge. Just execution.
💬 Let me know if you’re watching this level too — or if you see something different. Always open to alternate perspectives.

2025-05-29 - priceactiontds - daily update - nasdaqGood Evening and I hope you are well.
comment: I don’t know what’s more likely to happen tomorrow and every time I feel that way, market is in a trading range and most likely neutral. Big up, big down, big confusion. Read some Al Brooks. Volume was big today but given that bears only managed to close 60 points below Wednesday, what did they achieve? RTH session closed the gap but not more. Futures obviously had a nasty reversal but we can still draw a decent bull wedge with lows either 21300 or 21100 and that would mean bulls would be favored to trade back up.
current market cycle: trading range
key levels: 21000 - 22000
bull case: Bulls who want to buy 21400 would likely need a stop 20700 and scale in. Is this a good trade? I don’t think so. You either wait for better confirmation that today’s low is credible and will hold or you wait for lower prices closer to 21000 before going long. I doubt this bull wedge will just end like this and that we top out with 21858. I expect at least some form of double top with a print up to 21700 or higher. The middle of the current range is 21300 and market bottomed out there today. Maybe this fact makes it a bit more favorable for the bulls.
Invalidation is below 21300.
bear case: Below 21300 bears could try to go for 21000 or even last weeks low at 20727. How likely is that? Today’s selling was very strong and it was at the moment everything was max bullish and perfect aligned. You do not see these type of reversals in a strong bull trend. We are very likely in the last days of it before we go down lower. That being said, I just don’t think we will go down further from here without another try of 21800+. I have two potential bull wedges on my chart and bears would need a strong move below 21300 and stay around 21000 for me to abandon that structure.
Invalidation is above 22100.
short term: Neutral and need a very good signal to either side for me to take it. Bears want 21000 and bulls at least 21800. My line in the sand is 21300.
medium-long term - Update from 2024-05-24: Will update this section more after the coming week but in general the thesis is as for dax. Down over the summer and sideways to up into year end. I don’t think the lows for this year are in.
trade of the day: Buying Globex open was the obvious trade but shorting the highs certainly was not and I think everyone was surprised by this bear strength today.

NQ: 199th trading session - recapWhat a day man, it really just comes down to patience: IT FINALLY HAPPENED!!! THE BEARS WERE HERE!!!
This is the price action I was talking about - obviously we did not get any major trades in besides the scalp but I'm still happy: It happened, I profited, gained knowledge & my confidence back.
No "in hindsight" stuff: With better momentum I could've made proft like a 5:1 RR trade.


Poor executions on MNQ A little post for transparency, down -$225 for the day. Made some error trading mistakes. I should've just closed the charts and been content with my $60 profit. But I still learned a lot through staying on the charts and watching price.
10am candle not breaching its highs and failing to take it was a great indication that the candle wanted to target sell-side -- let my feelings get me a little excited today and that ended up resulting in losses. I will take the losses for today and check back in around 2pm and if not later today at 2pm, I'll be trading tomorrow morning NY session.
Talk to you guys soon! Give a 🚀 if you found this insightful.

Volume Power System Signal to Buy Nasdaq We have a good signal from ouer System VPS to buy the NASDAQ and hold the position until a new reversal signal appears.

MNQ Buy Idea 5.29.25 (Part 2)Continuation of the first video entry of this trade.
We were aiming for $200 in profits today but failed to get that, ending with $61 in profits. I don't think we will be entering another trade due to the time and also that I want to focus on reading my book "The Trading Game" by Ryan Jones.
If you guys found this insightful give it a 🚀, it helps me see that you guys learned something from watching this and motivates me to post more.
Drop your comments down below, do you think MNQ is bullish or bearish? What prices do you see MNQ reaching?

MNQ Buy Idea 5.29.25 (Part 1)Targeting buy-side with this 10AM candle.
Wanted price to take the highs of the 10am open, but we seemed to have failed to as of 11am, SL was hit unfortunately for a final profit of $61 for today.
This will be all for me as I am taking it easy and not pushing/forcing any trades. I will be uploading part 2 to this video once this one is rendered for those interested.

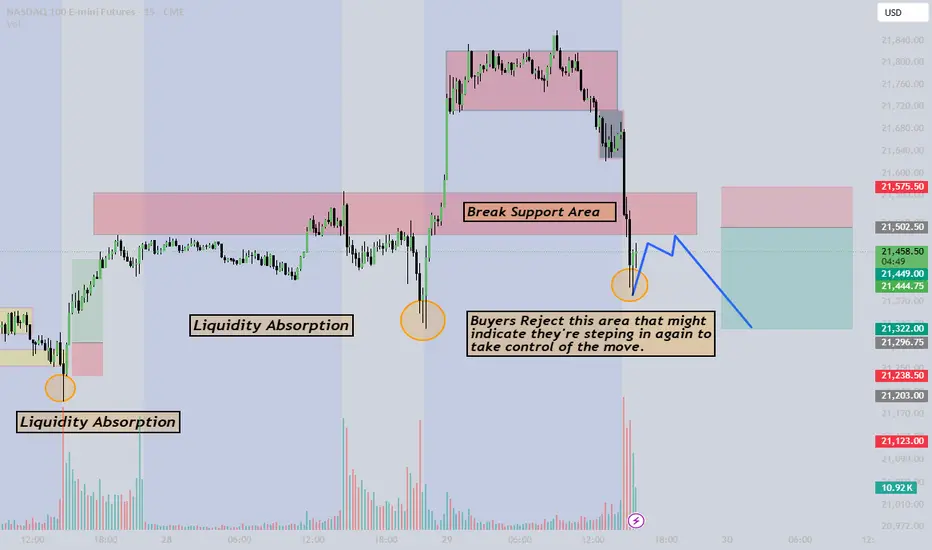
NQ1 Change of caracter after a strong Support breakoutNASDAQ 100 E-mini Futures Sell Signal Confirmation
The latest price action in the NASDAQ 100 E-mini Futures chart presents a compelling case for a strong sell position. Key indicators point to a significant bearish shift:
Break of Structure (BOS): The price has broken below a critical support level, marking the transition from bullish momentum to bearish dominance. This break signals the weakening of buying pressure and the emergence of stronger selling interest.
Change of Character (CHOCH): The market structure has shifted, now forming lower highs and lower lows—a classic sign of bearish control. The CHOCH further solidifies the downtrend, reinforcing traders’ confidence in short positions.
Break of the SMA 209: One of the strongest confirmations of the sell signal is the breach of the 209-period Simple Moving Average (SMA). This moving average often serves as a dynamic support level, and its breakdown suggests a continuation of the bearish trend with increased momentum.
Together, the BOS, CHOCH, and the break of SMA 209 create a strong technical foundation for entering short positions. Traders should remain vigilant for further confirmation through volume analysis and potential resistance retests before executing trades.
Follow @GoldenZoneFX for more content and valuable Insights.