NQ BullishPrice Action: The chart shows the price movement of NQ over a period of time (likely intraday, given the time labels on the x-axis).
Key Levels: There are horizontal lines and rectangular zones drawn on the chart. These likely represent:
Support (S): A price level where buying pressure is expected to be strong enough to prevent further decline.
Resistance (R) or Buyside Liquidity (BuS): Price levels where selling pressure is expected to be strong enough to prevent further price increases. The label "BuS" suggests an area where traders have buy stop orders placed, creating potential liquidity to be taken out.
Sellside Liquidity (SeS or $$$
):∗∗Areasbelowsupportwheretraderslikelyhavesellstopordersplaced.Thesecanactasmagnetsforprice.∗∗∗OrderBlock(OB−POI):∗∗Aspecificpricerangewhereasignificantamountofbuyingorsellingoccurred,oftenseenasapotentialareaoffuturesupportorresistance."POI"likelystandsforPointofInterest.∗∗∗PotentialTradeIdea:∗∗There
′
saprojectedpricepath(theredandgreenlines)suggestingapotentialshorttrade.∗∗∗Entry:∗∗Theshortentryseemstobeplannednearthe21,400level,possiblyafteramoveuptotakeoutsomeofthebuysideliquidity(BuS).∗∗∗Target(TP):∗∗Thegreenareaindicatesthepotentialprofittarget,locatedbelowthesellsideliquidity(
$
)andneartheOrderBlock(OB−POI).∗∗∗StopLoss(SL):∗∗Theredareaabovetheentrypointrepresentsthestop−losslevel,designedtolimitlossesifthetradegoesagainsttheanticipateddirection.∗∗∗"Ata":∗∗Thislabelispositionedneartheprojectedpricepath.It
′
spossiblethisreferstoaspecifictradingconceptorthenameofthetrader
′
sstrategy.Withoutfurthercontext,it
′
shardtosaydefinitively.∗∗Insummary,thechartillustratesapotentialshorttradingsetupbasedon:∗∗1.∗∗Anticipatingamovetotakeoutbuysideliquidity(BuS).∗∗2.∗∗Enteringshortafterthispotentialmove.∗∗3.∗∗Targetingsellsideliquidity(
$$$) and an Order Block (OB - POI) as areas of support.
Having a defined stop-loss level to manage risk.
It's important to remember that this is just a visual representation of a potential trade idea. The actual outcome will depend on market conditions and whether the price action unfolds as anticipated. Traders using such setups would typically look for additional confirmation signals before entering a trade.
MNQ1! trade ideas

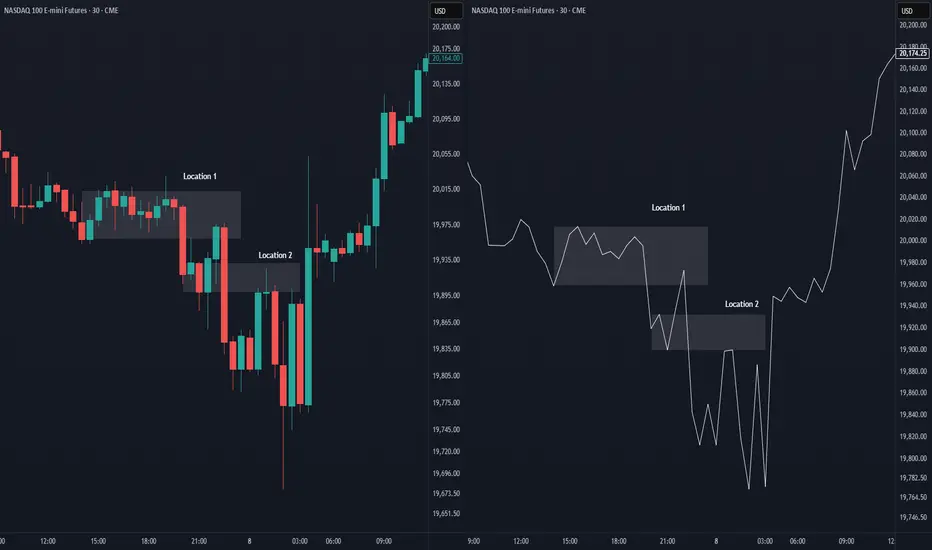
Location 30m NY Session 7 May 2025There are 2 setups based on a 30 minute structure on 7th May 2025.
Location 1 :
- Trend sell
- Structure breakout sell
Location 2 :
- Trend sell
- Structure breakout sell
Location 30m London Session 6 May 2025There is only 1 setup based on a 30 minute structure on 6th May 2025.
Location 1 :
- Trend buy
- Structure breakout buy

#202520 - priceactiontds - weekly update - nasdaq e-mini futures
Good Day and I hope you are well.
comment: The bulls gapped up on Monday’s Globex open and we never looked back. My line in the sand was 20536 and we are now about 1000 points higher. The rally is climactic in a very tight bull channel and those are always unsustainable. We are close to the ath to expect a new one or a retest but I doubt we can get there without at least a couple of days sideways to down movement. If we continue higher from 21500, it will go without me because I don’t think this is a good trade. Bulls should not let the market fall below 20800ish or the trend line breaks and that would decrease the odds of a new ath somewhat. Even if I expect a pullback, I doubt bears will get something big going next week. The rally is too strong to not expect the next pullback to get bought. The only chance bears have to reverse would be a news event and trading on hope is never a good strategy.
current market cycle: trading range
key levels for next week: 20000 - 22000
bull case: 22000 is the next obvious target for the bulls but I doubt we can get there without some sideways to down movement first. If we print 22000 next week, there is no reason we can’t go for 22500 as well. Bulls have all the arguments on their side right now and the bull channel is clear, so trade it until it is clearly broken.
Invalidation is below 19100.
bear case: Very small chance my wave count is correct and we have seen the high of this move. The two-legged correction with a higher high is the best guess I have for now but I would not initiate trades based on that right now. It helps with expectations but not more. Base assumption is a pullback, more upside and then a stronger reversal over the summer and Q2. As of now, bears have absolutely nothing going for them and you can only think about shorts if you are comfortable with holding through 23300ish because that’s how high I can potentially see it going. I fully expect 19000 to get hit again this year but for now this market is as bullish as it gets.
Invalidation is above 21600.
short term: Neutral. Expecting a pullback and that will likely be another good long opportunity if nothing changes dramatically. 22000 is the obvious next target. If we get real bad news, we could see a bigger pullback but even then I would expect at least a retest of 21500.
medium-long term - Update from 2024-05-11: My most bearish target for 2025 was 17500ish. Now I assume we will be in a trading range 16000 - 23000 for much longer. Same update as for dax, I guess we could go down and sideways over the next weeks/months and then have another squeeze into year end. Stairs up, elevator down.

my projection for the next few monthsi see the nasdaq consolidating in a range for the next few months and breaking out around november

E mini Nasdaq 100. Weekly walkthroughWeekly walkthrough on NQ. Huge gap up and continuation weekly profile towards the Major Buyside Internal Liquidity

How to Set Custom Alerts for Futures Trading in TradingViewThis tutorial video demonstrates how to access and add custom alerts for futures and other types of trading as well as manage those alerts.
Learn more about trading futures with Optimus Futures using the TradingView platform here: optimusfutures.com
Disclaimer:
There is a substantial risk of loss in futures trading. Past performance is not indicative of future results. Please trade only with risk capital. We are not responsible for any third-party links, comments, or content shared on TradingView. Any opinions, links, or messages posted by users on TradingView do not represent our views or recommendations. Please exercise your own judgment and due diligence when engaging with any external content or user commentary.

NQ Range (05-14-25)The Range of Games below will run until Tuesday 5/27. Looking for a drop between now and mid next week that will set up the Long to ATH or near 23,000. Look for the Memorial Day holiday low volume week (prior to holiday or after) to set up the lift higher in O/N or during the Dead Zone's of Reg Sessions. Should the NAZ lift prior to mid mid/late next week, look Short for a pull back. Blue lines are 2025 & 2024 Open Price levels, NAZ is flat YTD. Stall lift above should retest Mid Level of the 2 blue lines.
NOTE: Since 1/22 the NAZ is up 26% (today) and ATH 32%. Current to ATH is range of tricks, the upcoming low volume holiday trading days may be the Pop set up for the breakout. Long moves in the Overnight and extended weekends have been consistent.

Plan for 5-16-2025Still thinking bullish , looking to test below and run back up , if we failed to hold y.high might test below

NQ: 191st trading session - recapYe my dumb*ss forgot to post AGAIN, well smhhh. Took a trade and got stopped out - wasn't the best one, definitely deserved the loss so it's OK

NQ Power Range Report with FIB Ext - 5/16/2025 SessionCME_MINI:NQM2025
- PR High: 21379.50
- PR Low: 21403.25
- NZ Spread: 53.25
No key scheduled economic events
Holding Wednesday range, holding short bias participants hostage
- Still advertising rotation below 21200
Session Open Stats (As of 12:55 AM 5/16)
- Session Open ATR: 503.83
- Volume: 26K
- Open Int: 286K
- Trend Grade: Neutral
- From BA ATH: -5.6% (Rounded)
Key Levels (Rounded - Think of these as ranges)
- Long: 22096
- Mid: 20383
- Short: 19246
Keep in mind this is not speculation or a prediction. Only a report of the Power Range with Fib extensions for target hunting. Do your DD! You determine your risk tolerance. You are fully capable of making your own decisions.
BA: Back Adjusted
BuZ/BeZ: Bull Zone / Bear Zone
NZ: Neutral Zone

Location 30m NY Session 5 May 2025There are 2 setups based on 30 minute structure on 5th May 2025.
Location 1 :
- Origin of structure breakout buy
Location 2 :
- Origin of structure breakout sell

Location 15 NY Session 2 May 2025There are 2 setups based on a 15 minute structure on 2nd May 2025.
Location 1 :
- Trend buy
- Structure breakout buy
Location 2 :
- Origin of structure breakout sell

2025.05.16 nasdaq analysis
This is the briefing result for Nasdaq as of yesterday.
The briefing began during the yellow box phase.
At that time, I clearly mentioned that the market had entered a short-term correction phase and emphasized the importance of the 21187 support level marked by the red box.
As seen in the chart, the 21187 level was not broken to the downside and instead held as support, followed by a rebound.
This reaffirms the significance of the 21187 level.
Afterward, the trend continued upward.
Looking at the 15-minute chart, there have been consistent lower wicks breaking below support,
which decreases the reliability of a short opportunity simply from a trendline break.
At this point, the trust in a sell-off purely based on trendline breakdown is weakening.
This chart outlines a short-term sell strategy.
As previously mentioned, while the short-term uptrend line has become less reliable,
if we see a break of the trendline and a drop below 21376,
we could expect a pullback toward the blue box area around 21320~21300.
Thus, a short-term short strategy may be valid in this scenario.
From a daily chart perspective, Nasdaq closed with a green candle again,
but the shape of the candle resembles a doji with similar upper and lower wicks.
What we need to focus on here is that Nasdaq has re-entered a high-volume price area (supply zone),
but since no clear direction has formed, many positions seem to be closed off whenever the price pushes higher.
On the downside, since the 21187 support level has held,
this remains the most critical level.
If 21187 is broken downward, it could mark the beginning of a daily-level correction phase.
Conclusion:
No clear direction yet.
While the direction was upward until yesterday, the doji close suggests caution.
For further bullish movement, a confirmed close above the current supply zone is essential.
If the market corrects downward, watch for a break below 21187.
The current price action is forming a channel pattern with higher lows and higher highs.
If traded correctly within this range, good opportunities may arise.

forecastFIRST FORECAST
I AM EXPECTING THAT THE NQ! WILL BE BEARISH TOMORROW
AS WE ARE IN BEARISH MOVE THIS WEEK, AND THE PRICE GOT REJECTED FROM A DAILY SIBI, the daily candle closes under PREVIOUS DAILY HIGH, so we are in a bearish move

2025-05-15 - priceactiontds - daily update - nasdaqGood Evening and I hope you are well.
comment: Market is in peak euphoria again but you would be buying at the very top on an Opex Friday. Like… Just dont. Enjoy your weekend. I expect a rather choppy session maybe even a deep pullback rather than closing the week on another green bar.
current market cycle: trading range
key levels: 20600 - 22000
bull case: Bulls want a new ath and we are high enough, that they could easily get it next week. My count was likely wrong and W1 was not the spike from 16735 to 19388 but rather the leg from 17863 to 20277. That means we are in W3 and W4 is around the corner. I have many calculated targets around 23000 and as of now, there is no reason we can not get there. It’s a very tight bull channel upwards. Bears are not doing anything so the path of least resistance is up.
Invalidation is below 20100.
bear case: Bears need a miracle. That’s it. Best they can maybe get is a pullback to the bull trend line around 20700ish but I highly doubt that. If we print 21000 tomorrow, most bears would be wet and take their profits before letting them see burning away again. My assumption for tomorrow is a choppy session somewhere between 21000 - 21600.
Invalidation is above 21600.
short term: Neutral. Opex Friday, I made my money this week. Absolutely no need to throw it away tomorrow. Less interest in buying up here but bears are barely making money, so I’d rather sit on hands.
medium-long term - Update from 2024-04-20: My most bearish target for 2025 was 17500ish, given in my year-end special. We are +18% from the lows and I do think, once this turns again, it will easily be the short trade of the year.
trade of the day: Longing the lower low below 21300 is the obvious choice. Market went sideways to up with higher lows for 4h. There were at least 4 big tails on the 15m chart which told the story.

Took Too Loss On NQ Because of Bad Entry. End Of Trade of Today Lesson Make Sure You Pre-plan Your trade before Execution. A sniper entry is always the best. ( Not a Financial Advise)

MNQ light trade ideaStopped out at BE on this trade, price did not retrace further down to the bullish FVG as I expected, got near its lows and quickly reversed higher.
I will be watching to see how price reacts from here and studying its PA.

US100, Potential GLOBEX Trap Long PlayEssentially the idea of this trade is to trap GLOBEX low break-out traders, by longing the demand zone under the GLOBEX low. If GLOBEX low shifts to under the demand zone or at the demand zone before 15.30, the trade should not be taken.

Location 30m NY Session 1 May 2025There are 2 setups based on a 30 minute structure on 1st May 2025.
Location 1 :
- Origin of structure breakout buy
Location 2 :
- Origin of structure breakout sell

KISS Trading SystemOverview :
Trading process should be as simple as possible. One of the simple method to trade is primarily identify direction, find a good location to entry, wait for confirmation in the location, and finally execute the trade when the risk reward ratio is good.
1. Direction
To identify direction, follow the market structure. Higher high and higher low indicates price is in a bullish trend (uptrend), while lower high and lower low indicates the price is in a bearish trend (downtrend). If there is no clear structure higher high and higher low or lower and high lower low, price is in sideways mode. Best is to avoid trade under this condition until clear trend is formed.
2. Location
Every time price create a new breakout structure, mark the the structure as our potential location for entry. There are some occasion where price does not pullback to the location and continuing the trend by creating a new breakout structure. Do not FOMO, just wait for the next location and confirmation within the location to entry and minimize your risk.
3. Confirmation
Patience is the key. Wait for price to pullback at higher time frame location, and focus for confirmation in lower time frame to entry and reduce risk. Time is fractal, the structure pattern is same on all timeframes. Choosing the right timeframe pair is crucial. Refer to table in the notes below for timeframe pairing.
4. Risk Reward
This is the main essence in trading, controlling risk and preserving capital. Entry without doubt when the risk reward are good. Execute, and trust your setup.

Trading plan for 5-15-2025Night prep for tomorrow (5-15-2025), leaning bullish but it all depend on the news.
Will adjust the plan before RTH open.

NQ Power Range Report with FIB Ext - 5/15/2025 SessionCME_MINI:NQM2025
- PR High: 21386.50
- PR Low: 21361.50
- NZ Spread: 56.0
Key scheduled economic events:
08:30 | Initial Jobless Claims
- Retail Sales (Core|MoM)
- PPI
- Philadelphia Fed Manufacturing Index
08:40 | Fed Chair Powell Speaks
Temp 25% AMP margins increase for Powell expected pre-RTH volatility spike
- Extending week highs, holding previous session high
- Advertising potential rotation with weekend gap motivation
Session Open Stats (As of 12:15 AM 5/15)
- Session Open ATR: 515.63
- Volume: 25K
- Open Int: 290K
- Trend Grade: Bear
- From BA ATH: -5.6% (Rounded)
Key Levels (Rounded - Think of these as ranges)
- Long: 22096
- Mid: 20383
- Short: 19246
Keep in mind this is not speculation or a prediction. Only a report of the Power Range with Fib extensions for target hunting. Do your DD! You determine your risk tolerance. You are fully capable of making your own decisions.
BA: Back Adjusted
BuZ/BeZ: Bull Zone / Bear Zone
NZ: Neutral Zone
