NQ: 179th trading session - recapGood session today, I stopped trading tho after the explained situation which is definitely not ideal, RELOCK BACK IN DUMBASS
MNQ1! trade ideas

NQ Range (04-24-25)NAZ is mid range of the insignificant churn zone. Rejected yesterday at ML (rejection zone) 19,150. This chart will through Monday close and will we see some off session magic tricks (or not) with the Friday-Monday Long only move. That magic trick will set up the Short at KL 20,250. This is assuming the pass near 19,200-300. No pass (2nd rejection) would set up the drop to 18,000 or so. This will either create a U Turn (with a tweet) or drop deeper out of range and into the Danger Zone. Reg Session sold off yesterday, O/N is lower now and above the gap open of 4/23. Gap fill drop or pop in the Reg. I will leave this open through Monday Close.

NQ Shorts 4/28/25 Trailing Stops to protect position. Immediate Rebalance failed and 50% of wick closed above - lets me know lower prices are out for now.

My Trade on NADAQ futuresHii this my analysis on my trade at NASDAQ futures which went in my favour. ENtered with 2 lots and made some bucks. Thanks for watching!!!

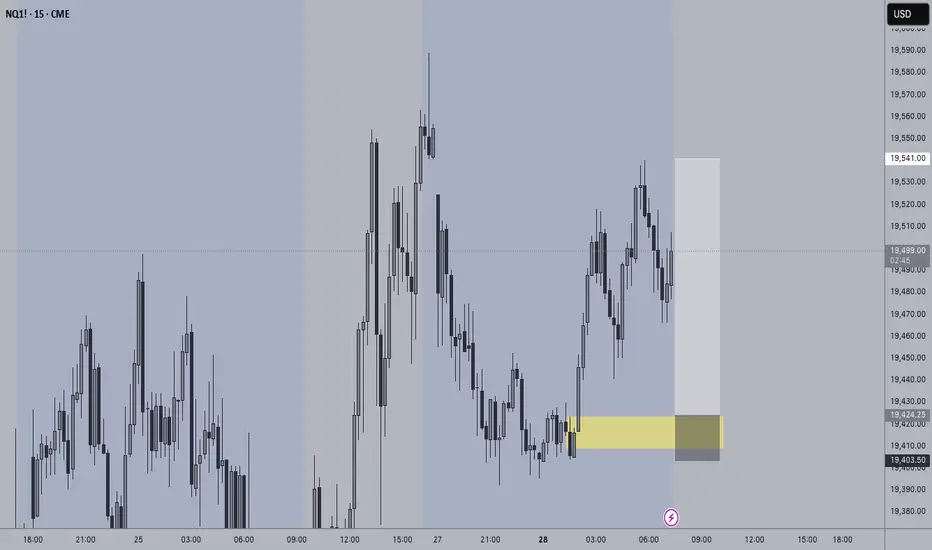
+5.6 R Trade Idea For NQ/NAS100: Intra-day Trade Looking for a breaker block trade off the 5 minute chart to reclaim internal liquidity.
Showing the 15 min chart here due to TradingView resolution requirements.
Trade this idea with appropriate risk management.
Good luck,
The Meditrader
MNQFIrst time waking up at the open 15 min after market open waited and broke action line entered made 2k and hoped out.

NASDAQ Analysis 05/100In the analysis video i continue my ideas from last naalysis and break down the price action just before US amrket opens.

Upcoming 5 Minute Trade Idea For NQ/NAS100: Get fundedUse your own risk management with this trade idea and if we get a bullish move to the upside out of this key level, then let it play out to reach the internal liquidity above.
Hope it helps!
The Meditrader


NQ KEY ICT LEVELS - 28th APRIL 2025Levels marked on the chart using my free indicator which marks out all of the ICT key levels which can be used for potential POIs where price might react

NQ KEY LEVELS - 28th APRIL 2025Key levels marked by using low volume nodes for potential key levels where we may see price react.

NQ bottom along with tech and crypto.New ATH coming after the recovery, I think this is the bottom of this down move, I don't think we rocket straight back up to ATH but its a great bet to add Long here. You really only get a move like this once every 5 years.
I think we see Crypto continue to move up, lots of good projects are oversold in the ALT world and lots of good projects are still carrying to torch. Showing strength amongst the weakness.
I think HYPE goes on to lead the way of finance onchain. They are only getting started.
I think S / Sonic goes on to be leader of the next defi summer 2.0.
(will make a post about them soon)
So I'm betting on the fastest horses and calling a decent spot to place bets on the overall condition of the market and i think CRYPTOCAP:BTC leads that race.

$MNQ 15-Minute Short EntryI'm currently waiting for this kind of unicorn short entry at the 15 minute.
Things I am considering:
1. The right time for volatility to push price lower.
2. A good bearish confirmation in a lower time frame like the 1 minute.

$MNQ Daily Timeframe AnalysisMy lower timeframe bias would be dependent on the 24-25 Apr 25 NDOG, if we get a bullish pullback from this, I will primarily look for longs. However, if we get an inverse of the NDOG, I will look for shorts until the 1 day bullish FVG.

$MNQ Weekly Timeframe AnalysisThere is a clear bullish candle on 07 Apr 25 that emerged from the Aug - Oct 23 bullish order block. Followed by the 21 Apr 25 bullish candle, I have yet to see if we will respect the bearish order block at 17 Mar 25 or will it make a bearish breaker.
For smaller timeframe entries, I expect my TP for a long below the bearish OB to be at least the lower edge of the 17 Mar 25 bearish OB or somewhere on the boundary.

$NQ Monthly Timeframe AnalysisThis month experienced about a -17.88% maximum drawdown. There are two bullish order blocks from Aug - Oct 23 and Sep 24 that is currently acting as support.
My bias is currently bullish with consideration of a day consolidating because we are inside the Sep 24 bullish order block.

NQ 4/28/2025 - 5/2/2025 weekly profile and target this week like i mention should be risk low and will have a lot of volatility because of news on this week so Monday and Tuesday could good for trade and Wednesday and Thursday and Friday maybe be hard to control but our bais is bullish for this week like same previous week
and only trade we will take will be buy because of our bais
why our bais is bullish?
because of higher time frame weekly and daily and 4 hour order flow is bullish
and also if we look 20 days back we will see that highest of 20 days back is so close so
i that will be our target for this week and that is my idea


We still on a UPTREND ON MNQI'm following the momentum of the past week, this week once we break either way I'll be making my trades.

April 28th - MNQ - BEARISH IDEAIn this scenario, we could see a bearish continuation in the Nasdaq over the next 20 sessions, with several pullbacks serving as points for the price to propel lower.

April 28th, MNQ - Bullish IdeaIn this scenario, we could see a bullish breakout in the Nasdaq over the next 20 sessions, with several pullbacks serving as support points for the price to propel higher.

sweep of london high , looking for a retest.NQ had a rejection from Newyork/London highs 19590. Possible retest of the 19500 area to see a push to the upside, if sellers remain in control look for a retest of the New York Open 19428.50 area. No bad news is good.
d news.

Short DUe to the OTE levels and also a Order block i think price is likely to experience bearish downturn on open
