NQ KEY ICT LEVELS - 17th APRIL 2025Levels marked on the chart using my free indicator which marks out all of the ICT key levels which can be used for potential POIs where price might react
MNQ1! trade ideas

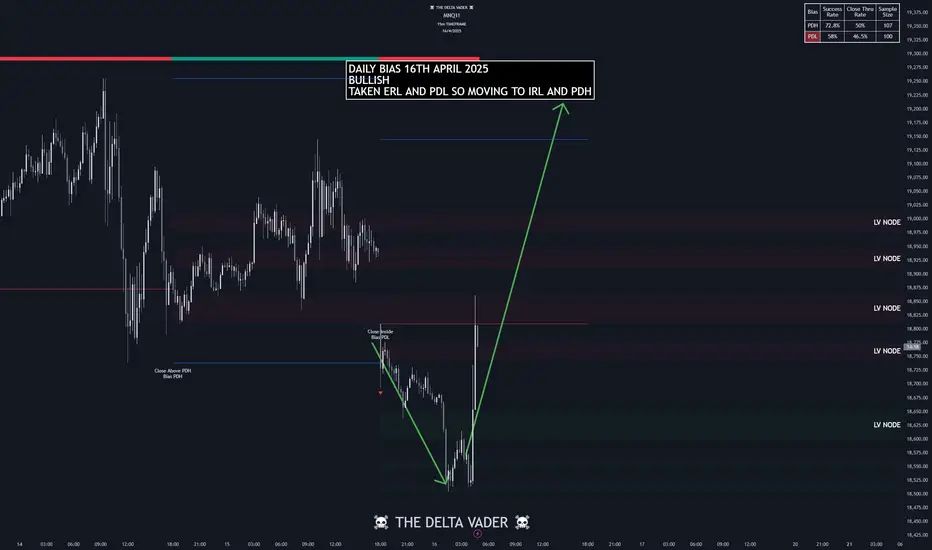
NQ KEY LEVELS - 17th APRIL 2025Key levels marked by using low volume nodes for potential key levels where we may see price react.

NQ: 172nd trading session - recapYea, it's a bit unfortunate that that happened but it is what it is, don't really care. But what is good is that price action actually starts looking "good" again as explained on the chart. Maybe the highly volatile days are now over, man they were brutal.
I'm just sitting on my hands right now waiting for that one bullish day, which will hopefully be reflected directly in the opening, I could catch a massive move to the upside.
Until then, I expect price to just chop around for a bit, could be tilted to the upside or downside, don't really know & don't really care. If price action is good and "foreseeable" I can make good decisions.

NQ! Short Idea (MMXM, Quarterly Theory) LONDON REVERSALHello everyone, today you will see my current Short Idea on the Nasdaq. I want to see the reaction of the 15M OB that we are sitting in, if we show Disrespect of that Area, I will be looking for Shorts.
Praise be to God
-T-

NQ UpdateLooks like the EOD pump might be a setup for the ECB meeting tomorrow morning. Did not play it because my indicators did not hit oversold. Taking the patient approach and just waiting for a good play.
I did get into sold gold though this morning. They way they're pumping gold, the dollar index won't matter as much, lol.

NQ Short (04-16-25)Staying with the Short, NAZ with a Gap up and a Gap down move in the off session (very little in the Reg). When the moves in the markets seem manufactured and happen in the O/N or off session, look Short. Looks like 18,400-300 is the Danger Zone here and below could be the express way lower. Should we get there, look Long 1st as the will U Turn it away (Gap, off session, Holiday, Dead Zone or any low volume period).

Nasdaq - $1,000 In 12 Mins Utilising The Opening Range High probability strategy after 9:30 opening bell where you can make a decent sum of money trading the 1-min timeframe in under 1-hour!

NQ KEY ICT LEVELS - 16th APRIL 2025Levels marked on the chart using my free indicator which marks out all of the ICT key levels which can be used for potential POIs where price might react

NQ KEY LEVELS - 16th APRIL 2025Key levels marked by using low volume nodes for potential key levels where we may see price react.

MNQ!/NQ1! Day Trade Plan for 04/15/2025MNQ!/NQ1! Day Trade Plan for 04/15/2025
📈19130 19280
📉18670 18520
Thanks to all my followers! Truly appreciate the support!
Please like and share for more NQ levels Tues & Thurs 🤓📈📉🎯💰
*These levels are derived from comprehensive backtesting and research and a quantitative system demonstrating high accuracy. This statistical foundation suggests that price movements are likely to exceed initial estimates.*

Price Fall under VWAPi knew for sure price was catching up momentum at my orange zone now waiting for the "what goes up must come down" sarnario

Scalping the close #NAS100 #SP500Great scalp into the close, perfect setup in our Liquidity Sentiment Indicators
Scalping the close #NAS100 #SP500

2025-04-15 - priceactiontds - daily update - nasdaqGood Evening and I hope you are well.
comment: I always refuse to interpret more into trading ranges than necessary. We have nested triangles. Just wait for the breakout. I have a bad feeling for bears, since today’s bad news could not push markets down, always a bad sign for bears.
current market cycle: bear trend valid until bear trend line broken but trading range a bit more likely right now. At least on lower time frames.
key levels: 16000 - 20000
bull case: Bulls need higher highs above 19000 to test 19250 and then the huge buy climax at 19384. If they get it, that means the bear trend line is broken and the bear trend is over and we will likely see a short squeeze for the ages. Huge day tomorrow.
Invalidation is below 18740.
bear case: Bears have to defend the bear trend line or they can just give up until we see 20000 or higher. Lower lows below 18600 would be a decent start tomorrow and next target then is 18750. Below is the elevator down to 18000 or lower. I would like a weekly close below 18000 very. much.
short term: Neutral 18900 - 19000. Invalidation prices for both sides are clear. Be patient and wait for the big breakout.
medium-long term - Update from 2024-03-16: My most bearish target for 2025 was 17500ish, given in my year-end special. W3 overshot it by 1000 points. Now my bearish bias is gone and I will wait how this unfolds. Big uncertainty for this year but I think this selling is overdone and big bois are buying with both hands below 17000.
trade of the day: Shorting 19000 was good multiple times.

NQ Short (04-15-25)NAZ rejected at the Diablo, again. No Pass go Short and a passing of KL is a Long. 19,400 is the zone to watch, should the Overnight Magic Traders get the NAZ that high. If O/N can't do it I highly doubt the Reg Session will as it usually sells off. NAZ on the edge of the channel and has not done much since the 20 minute 2,000 point pop from Uncle Bunker.
NDX Update below

NQ: 171st trading session - recapWas definitely more into the market today than usual, which is really good.
I feel like I can get the bag with this. In theory it is really the simplest way to make money:
I got my strategy, follow it and execute your plan. I don't really know why I doubt myself and the plan I wrote down, it's perfect. Take your trades, get the funded account, and execute your plan on picture perfect setups. It is pretty simple, yeah. Lock in.

Daily Price Action: Futures Nasdaq NQ1! Tuesday 4/15/2025In this video, we are looking into the potential daily price action of NQ1!.


NQ KEY ICT LEVELS - 15th APRIL 2025Levels marked on the chart using my free indicator which marks out all of the ICT key levels which can be used for potential POIs where price might react

NQ KEY LEVELS - 15th APRIL 2025Key levels marked by using low volume nodes for potential key levels where we may see price react.

$NQ 2H April PlaybookWe've got some serious overhead resistance and unless something truly blows us away in earnings, the path is lower but with less volatility than recently. No new lows in April and certainly no highs.

NQ break below Trend line Was watching for 4H to change trend. Putting in a LH and breaking below a triple touch trend line as we pivoted off a previous area of resistance.

NQ Range (04-14-25)Will stay with Range and the Friday for Monday. The chart below is the NDX, red line is Diablo with yellow arrow, white arrow is Danger Zone. The move away from the DZ was a 20 minute 2,000 point move. One of the best U Turns in recent 5-10 years and well manufactured, to boot. Look at all Mega Cap Tech stocks, you can see they (major indexes also) are under a similar Trend Line. When the NAZ gets pinned between a Diablo TL & DZ, or U Turn needed support level, the games/tricks come out (like we are seeing now). Passing the TL (Diablo) up usually will take off like a rocket or snail lift for weeks (but will not drop). No pass and rejection will retest the DZ and look for anything to hold it (like a Friday- Monday sideways to Long). Under the DZ and we just keep dropping. Highly doubt the significant drop takes place as we are approaching "Buy in May and Go Away". Unless the old "Sell in May and Go Away" decides to return.
NDX
