Trading Setup by Lord MEDZInstrument: MNQ (Micro E-mini Nasdaq-100 Futures)
Timeframe: 30s
Date: July 18, 2025
Setup Type: PO3 + Liquidity Sweep + CE Rejection
Status: Active – Stop Loss Moved to Break-Even (Risk-Free Trade)
🧠 Narrative:
Today’s price action offered a textbook setup aligned with smart money principles.
London High Swept:
New York session initiated with a liquidity grab above London’s high, triggering breakout traders and stops from early shorts.
Break of Structure (BOS):
Shortly after the sweep, price reversed with impulsive bearish structure, confirming the initiation of the expansion leg in a PO3 model.
NY Dealing Range Formed:
Range was established from the 9:30 to 10:30 AM EST window. High = Sweep of London; Low = Structural pivot post-BOS.
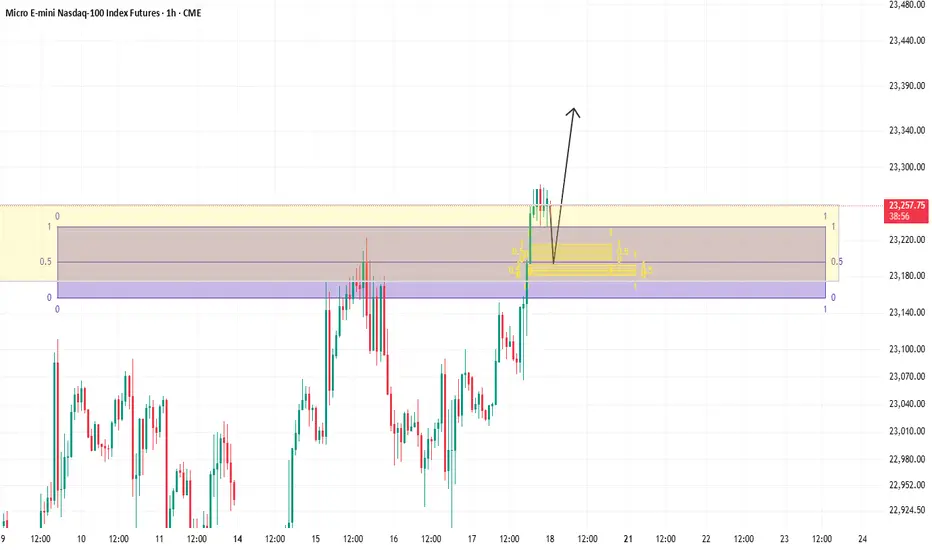
Retracement to 50% CE Level:
Price retraced into the 50% Consequent Encroachment of the NY Dealing Range — a known smart money rejection zone.
High Confluence Zone:
The entry area aligned with:
The Goldbach High
PO3 81% Extension
Historical inefficiencies and order block resistance
📌 Trade Details:
Entry: 23,237.75 (Sell Stop below CE Rejection)
Stop Loss: Initially above Goldbach High – now moved to break-even (BE)
Target 1: 23,180 (First liquidity pool)
Target 2 (Stretch): 23,166.00 (Premium-to-discount reversion / FVG)
🔒 Risk Management:
✅ Trade is now risk-free.
Stop has been moved to break-even after initial rejection confirmed the setup. No emotional exposure—only upside potential.
🧘🏽 Mindset:
This is where discipline pays. Setup aligned, confluences stacked, and execution clean. Let the market do the rest.
"No need to force the outcome. If it’s meant to pay, it will. I’ve already done my job. Now, I watch."
— Lord MEDZ
MNQ1! trade ideas

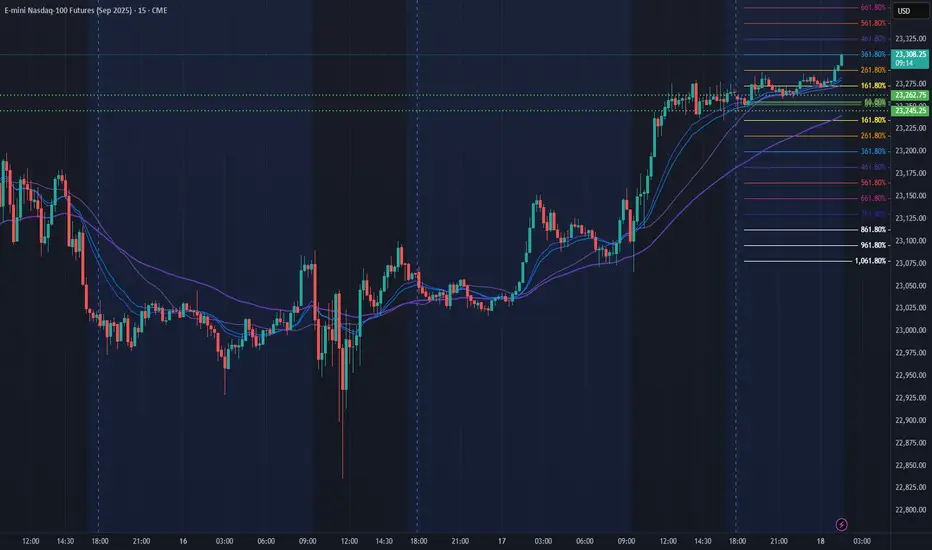
NQ Power Range Report with FIB Ext - 7/18/2025 SessionCME_MINI:NQU2025
- PR High: 23262.75
- PR Low: 23245.25
- NZ Spread: 39.0
No key scheduled economic events
Pushing ATH through overnight hours
Session Open Stats (As of 1:15 AM 7/18)
- Session Open ATR: 272.56
- Volume: 18K
- Open Int: 286K
- Trend Grade: Neutral
- From BA ATH: -0.0% (Rounded)
Key Levels (Rounded - Think of these as ranges)
- Long: 23811
- Mid: 22096
- Short: 20383
Keep in mind this is not speculation or a prediction. Only a report of the Power Range with Fib extensions for target hunting. Do your DD! You determine your risk tolerance. You are fully capable of making your own decisions.
BA: Back Adjusted
BuZ/BeZ: Bull Zone / Bear Zone
NZ: Neutral Zone
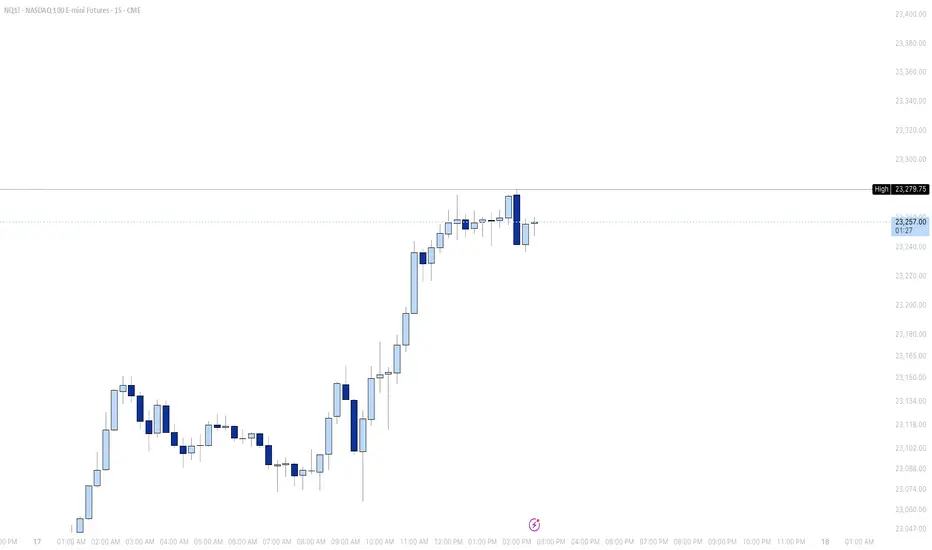
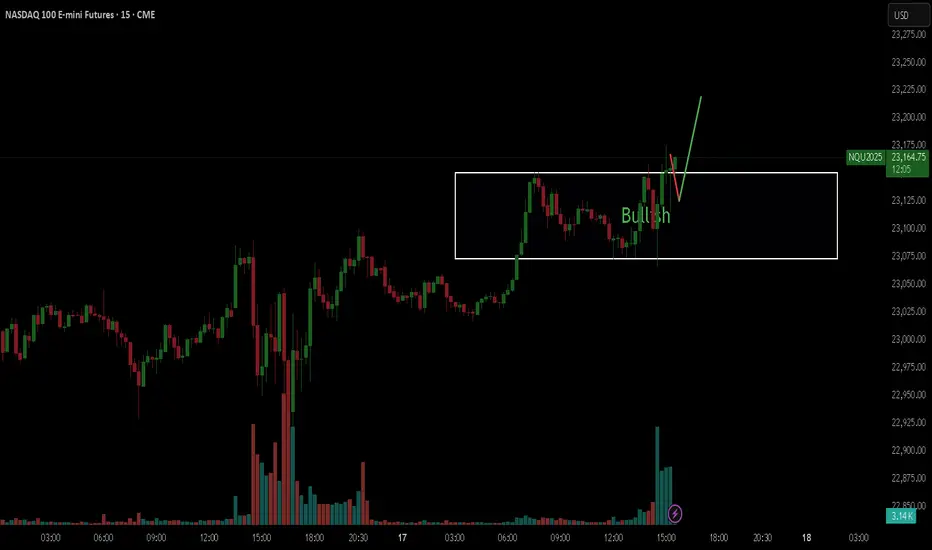
3Up-3Dn NQ Hits New High May PullbackLast night NQ trended up then sideways for the rest of the day. Markets wants to hit new high but may pullback a little bit before going higher. We are still in a Bull Market so small pullback is still healthy.

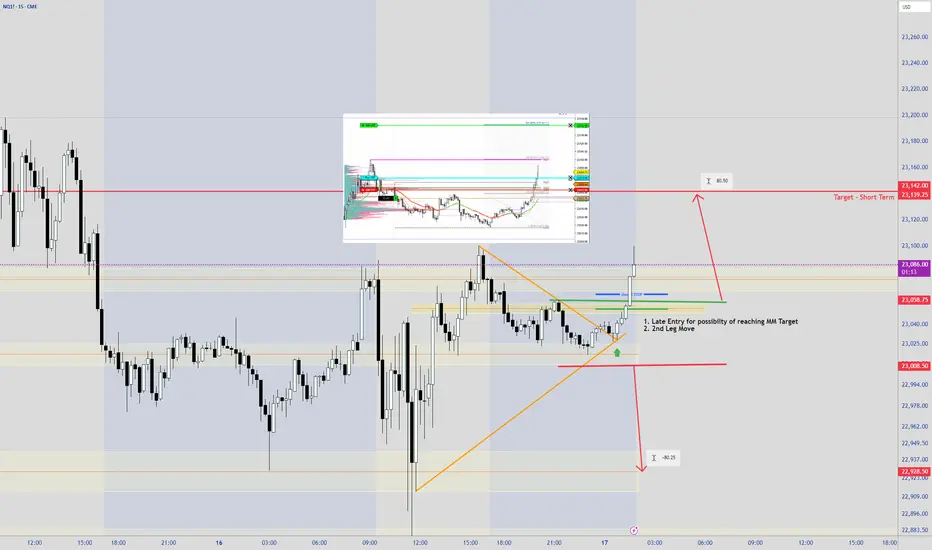
Longing NQWell, This looks like a very good long trade. But since we are over extended to the upside, i will be very careful.
use medium size to take this long.
You need to monitor the price when it enters this purple zone, and check for confirmation that the price is truly reversing from this area.
Anyways, before i enter the trade i will be updating, so make sure you check back again.
This is my main template for Futures and ForexThis is my main template for Futures and Forex! It is optimized specially for the strategy "Momentum Mastery".
It includes all the necessary tools and indicators needed for the strat.
All setings are READY!!!
$NQ Supply and Demand Zones - All Time High! 7/17/25This chart is for SEED_ALEXDRAYM_SHORTINTEREST2:NQ only.
We recently hit ATH this AM session and now price is accumulating and we are waiting to see what it wants to do next. Continue to hold support at ATH before we breakout higher, or break below and close below ATH support for a retest lower?

$NQ Supply and Demand Zones 7/16/25This is for SEED_ALEXDRAYM_SHORTINTEREST2:NQ chart specifically.
Posting for the YouTube fam and to hold myself accountable.
We broke through many demand zones after failing to break newer highs and the 2 news releases.
MNQ Analysis with three successful tradesAs NQ keeps hitting ATH and the bulls are in total control, I do my analysis and share my thoughts.

NASDAQ Trade setupWill wait for NQ to sweep the swing low and then look for longs from there, We might also see SMT with ES around these zones.
NQ - Long Scalp/SwingYo everyone. Here is what I'm seeing for NWQ today. I'm very bullish because of market structure.
Confirmations:
Bullish 1HR Break of Structure
Intermediate Lows holding
Multiple Bullish FVGs
We may not get an entry lower but we ARE going up.
Happy trading!

Daily Market Outlook. 16.07.2025, CPI dayGold Short and NQ order flow explained. Along with the Dollar Index

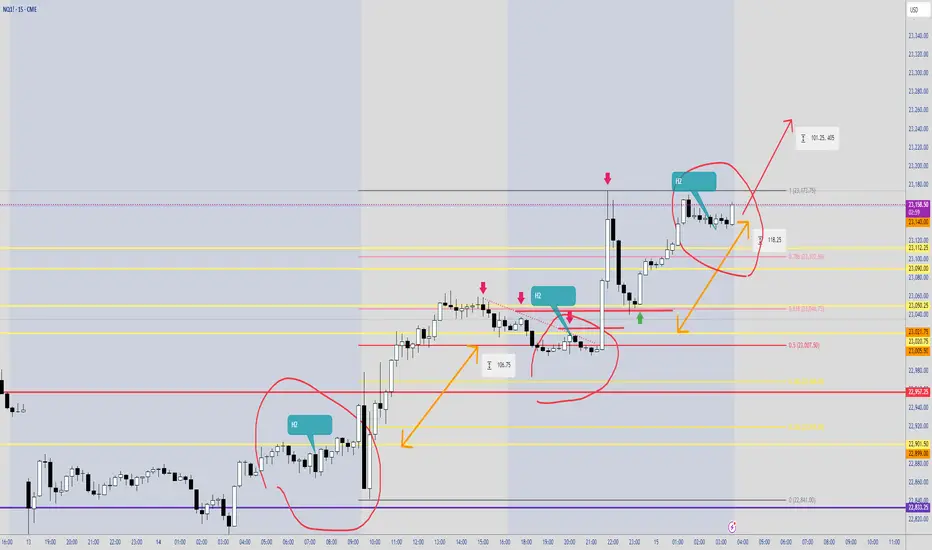
H2 or High 2H2 or High 2 from Al Brooks teachings is an Entry Point. With the news coming , will this continue to trend upwards until the news ??
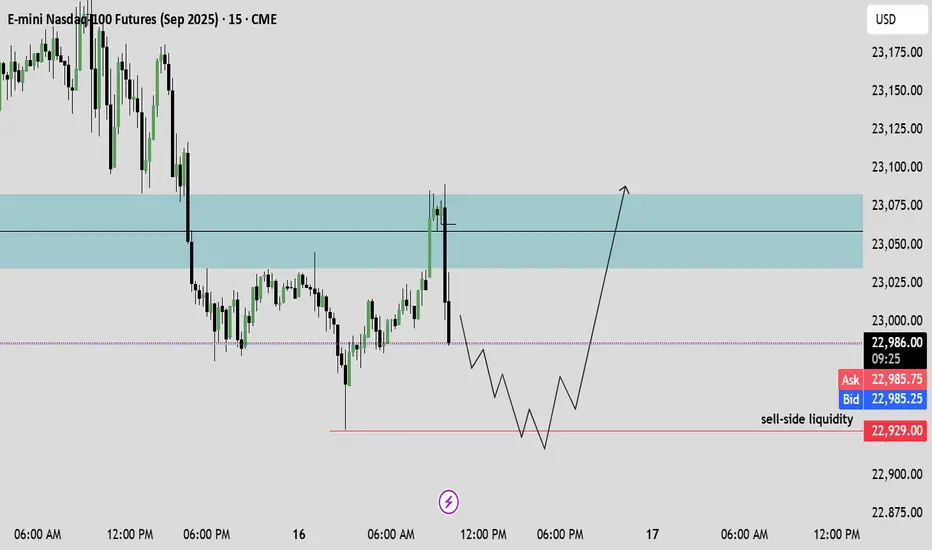
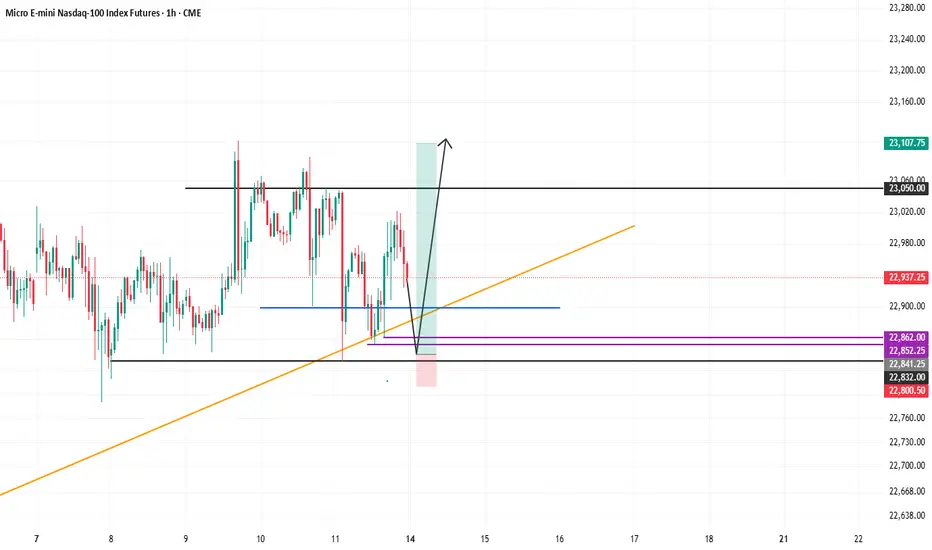
MNQ LONGHere we go again with confusing charts.
So to begin with, iam bullish until the orange trendline is broken, if its not broken and the price is still reacting positively to it as its doing so far, then iam very much bullish.
Also you should be aware that there is divergence started to show up on the daily and it looks massive on the 4h tf, also price swept last high and moved lower, even though the trend is still intact, it still shows some weakness.
my confidence in this setup is 7 out of 10
Since the price action is bearish for now, then if you want you can take some short until 22840, then go long from here.
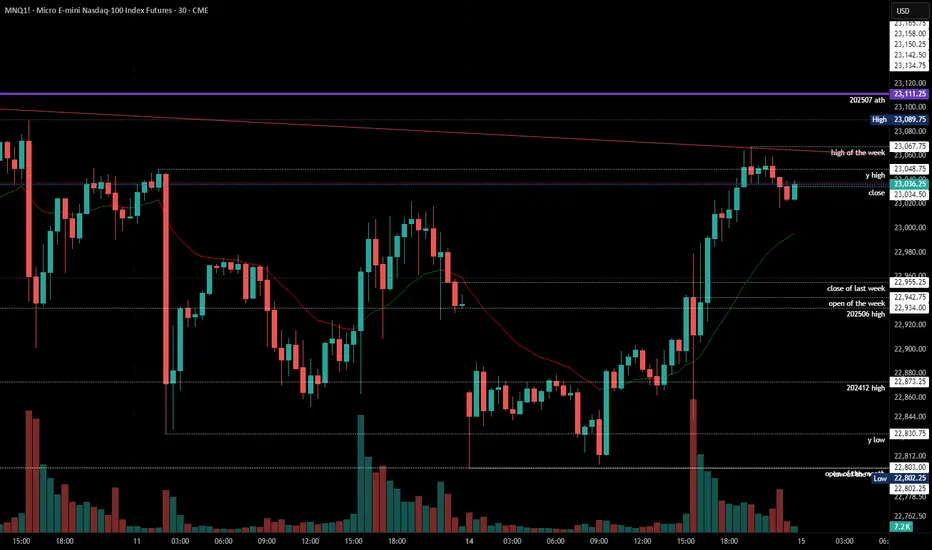
2025-07-14 - priceactiontds - daily update - nasdaqGood Evening and I hope you are well.
nasdaq e-mini futures
comment:
The biggest surprise for next week would be a huge gap down Sunday futures open and having that gap stay open. If bears could actually do something like that and trap all bulls who bought above 22600, that would be amazing.
Spoiler: Bears could not. Another gap down and bear trap. It’s sad but the reality. Don’t expect strong bears all of the sudden.
current market cycle: bull trend
key levels: 22000 - 23100
bull case: Bulls defended 22800 which is still as bullish as it gets. Don’t make it more complicated than it is. We are going sideways under the ath, can print a new one any given day. Since I don’t have any targets above 23100ish, I won’t make stuff up here. I only wait for the profit taking to begin to look for shorts.
Invalidation is below 22700.
bear case: Bears are sad. Need a daily close below 22700. If they prevent bulls from printing a new ath above 23111, I would be surprised. No need to write more here until we see much much bigger selling pressure.
Invalidation is above 23500.
short term: Neutral. Bears not doing enough and bulls going sideways under ath. No interest in buying, so I am neutral until big bears come around.
medium-long term - Update from 2024-06-29: No change in plans. I expect 20000 to get hit over the next 3 months and maybe 19000 again.
trade of the day: Long the double bottom above 22800 or the retest on US open around 22830. Bears failed to print consecutive good looking 30m/1h bear bars, so a reversal was the most likely outcome after the double bottom.
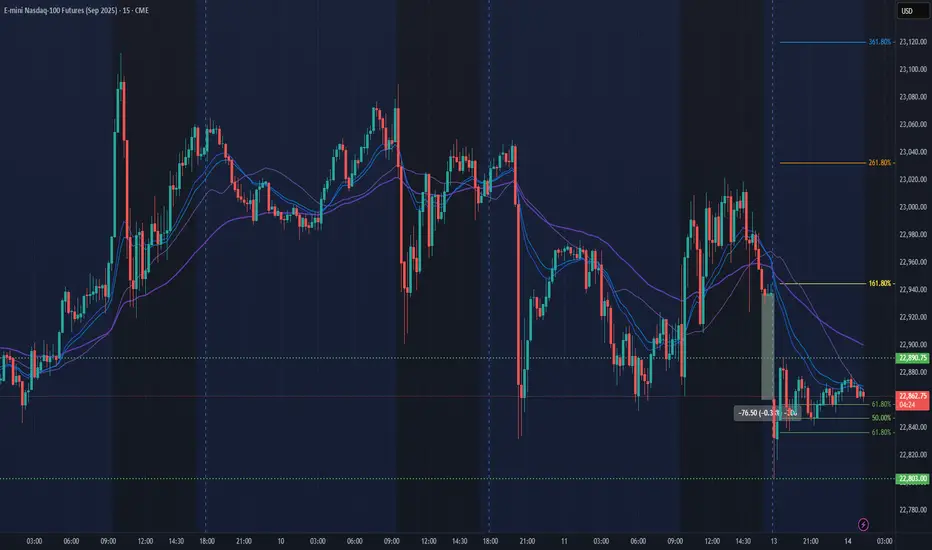
07/14 Nasdaq TradeThis time I had to wait for the red candle to create the wick for me to enter. I just needed that because we already had enough volume. Nasdaq is dangerous with this type of time frames. So review
Yellow Part: Variation
Blue Part: The wick that the red candle was creating for me to enter mroe confidently and using the wick as a stop loss.
Red Part: Execute the volume is on your side

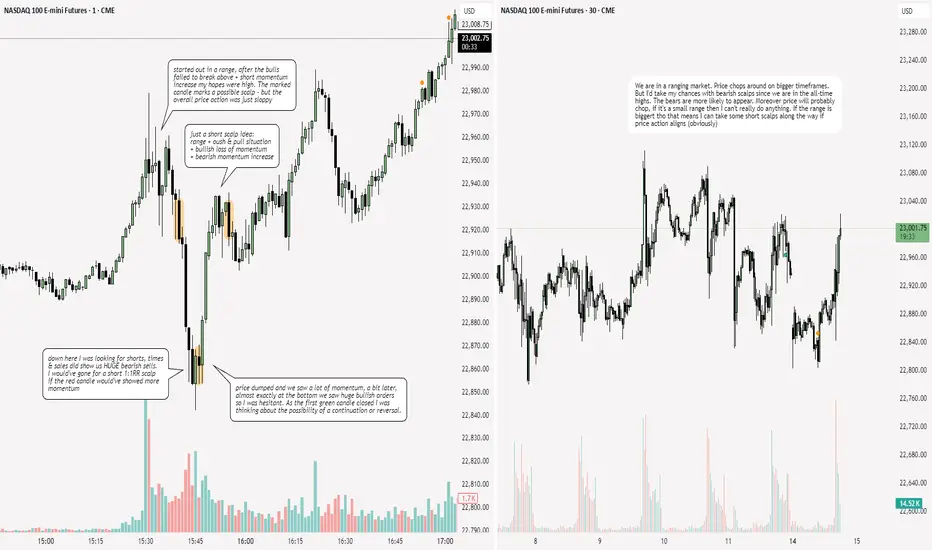
NQ: 217th trading session - recapI'm back after a week and it feels great. I do think I really needed a break. I'm back with a new mindset, with optimism and a redifined plan. Here are some questions I will need to answer for myself:
- bullish times & sales increase - Watch out for it?
- breakeven for short scalps?
NQ Power Range Report with FIB Ext - 7/14/2025 SessionCME_MINI:NQU2025
- PR High: 22890.50
- PR Low: 22803.00
- NZ Spread: 195.0
No key scheduled economic events
0.33% weekend gap to previous week low, unfilled
Session Open Stats (As of 1:15 AM 7/14)
- Session Open ATR: 289.88
- Volume: 36K
- Open Int: 270K
- Trend Grade: Neutral
- From BA ATH: -1.0% (Rounded)
Key Levels (Rounded - Think of these as ranges)
- Long: 23239
- Mid: 21525
- Short: 20383
Keep in mind this is not speculation or a prediction. Only a report of the Power Range with Fib extensions for target hunting. Do your DD! You determine your risk tolerance. You are fully capable of making your own decisions.
BA: Back Adjusted
BuZ/BeZ: Bull Zone / Bear Zone
NZ: Neutral Zone
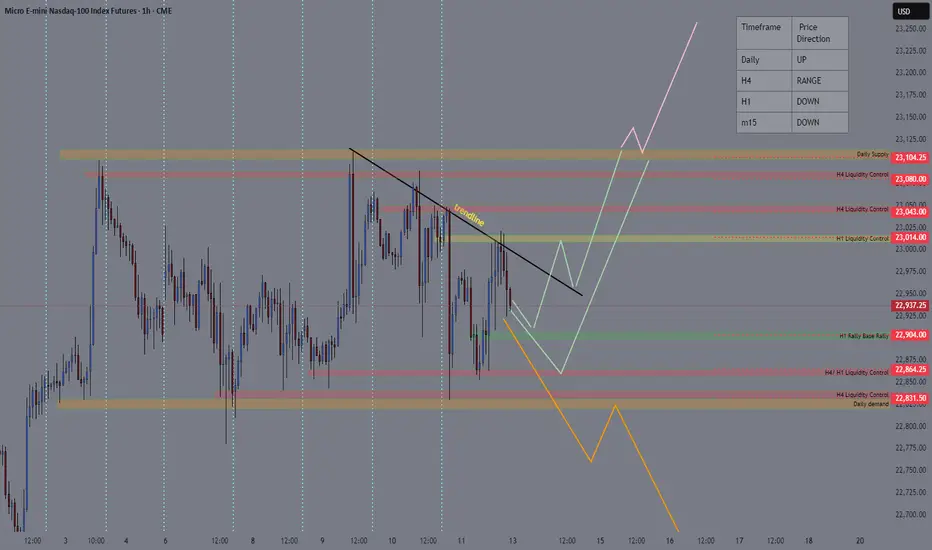
NASDAQ TRADING IDEA FOR 14-18 JULY 2025The price of NASDAQ is ranging between daily supply zone (23100) and daily demand (22830) and respecting trendline to find next liquidity control at h1 base at 22904 or H4/H1 liquidity control at 22864. I am looking for long opportunities at that area depend on how the price action for and wait confirmation before taking long position.
The price will continue to rise if daily supply breakout and form a new higher high at daily timeframe.
The market will shift direction if the daily demand breakout and I’m focusing to find opportunity taking short position at important key level/zone.
7/11 Trade with NasdaqEven though I don't trade NASDAQ the set up was too good to ignore.
1. Variation: The bears were losing strength and there was a lot of variety (red and blue candles).
2. Wick: The Bullish candle with the long wick rejecting the support area was all I needed to know to get excited.
3. Volume: I need a big candle to confirm the trend is ready to reverse so I went in.!!

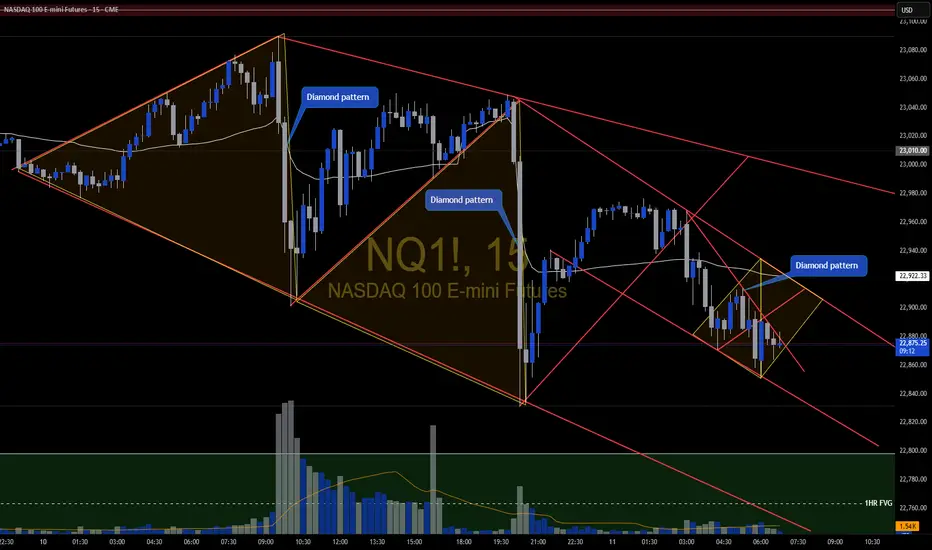
NQ Diamond Repeating patterns You can see the formation of the diamond patterns keep repeating. Big moves come from these. Enter after confirmation & retest.