MNQ1! trade ideas

NQ Power Range Report with FIB Ext - 3/28/2025 SessionCME_MINI:NQM2025
- PR High: 20011.75
- PR Low: 19983.25
- NZ Spread: 63.5
Key scheduled economic events:
08:30 | Core PCE Price Index (MoM|YoY)
Holding value in the weekend gap range at previous session close
- Daily rotation short out of the Keltner average cloud, 20400-600 range
Session Open Stats (As of 12:55 AM 3/28)
- Session Open ATR: 421.56
- Volume: 22K
- Open Int: 233K
- Trend Grade: Neutral
- From BA ATH: -11.7% (Rounded)
Key Levels (Rounded - Think of these as ranges)
- Long: 20954
- Mid: 19814
- Short: 18675
Keep in mind this is not speculation or a prediction. Only a report of the Power Range with Fib extensions for target hunting. Do your DD! You determine your risk tolerance. You are fully capable of making your own decisions.
BA: Back Adjusted
BuZ/BeZ: Bull Zone / Bear Zone
NZ: Neutral Zone

powellstanding way back, the nasdaq is looking horrible... i thinks augs low will hold for a bounce back up... i think current ath will be in for awhile....... we have our 61.8% fib retracement down at 15k for a possible swing to new aths! macro cup and handle aswell and macro abcs riding beautifully along our band... ofc this is just skepticism on a 1 day chart... it will take MAJOR news for a push near 15k

2025-03-27 - priceactiontds - daily update - nasdaqGood Evening and I hope you are well.
comment: Many potential trend lines that market could respect tomorrow. We are in an expanding triangle, a broad bull channel and the big bear trend on the daily chart. No idea what we get tomorrow so I lean neutral around 20000.
current market cycle: strong bear trend but currently in W2 (above 20700 that thesis drops to a 50/50 chance)
key levels: 19600 - 20700
bull case: Bulls surprised me with the huge buying around 20000. Yesterdays selling was good enough to expect lower prices, so stopping at 20000 wasn’t what I hoped for. Bulls turned the market neutral and if they continue with higher highs above 20200, they could get a breakout to 20400 or 20500. My w2 target still remains 20700. Past 50 trading ranges range is 19600 - 20500 and 50% of it is 20060 and we are at 20004. Good enough. Market is in balance.
Invalidation is below 19600.
bear case: Bears printed consecutive bear bars on the 4h chart but they barely make new lows on them. We could see a strong move below 20000 but for now I would need a strong signal and follow-through before I join the bears below 20000. I also think most bears will give up above 20200 and wait for market to get closer to 300 or 400 again. Daily chart shows it the best. We just closed the gap from Monday and market is now free to do whatever.
short term: Neutral 20000. Bears are slightly favored to continue the bigger bear trend but as of now, selling around or below 20000 does not make sense.
medium-long term - Update from 2024-03-16: My most bearish target for 2025 was 17500ish, given in my year-end special. We don’t know if we have printed the W1 of the new bear trend or repeat the pattern from 2024, where we sold of very strong to reverse even more strongly and make new all time highs. Market needs a bounce and around 20000/20500 we will see the real battle for the next weeks.
trade of the day: Tough day if you are not comfortable with trading ranges and it was absolutely not clear that we get a range-bound day. Bull reversal from the US open was likely the best trade since it was very strong without much uncertainty.

Trend Reversal in Play?After a strong bearish channel that lasted several weeks, the market has finally broken out of the resistance level — a key technical signal. This breakout was followed by higher lows and higher highs, suggesting a possible shift in momentum. 📈
Volume has also increased noticeably around the breakout zone, which can signal stronger conviction from buyers. The question now is: Are we entering a new uptrend?
As long as the price holds above the broken resistance (now acting as support), bulls could take control. Traders should keep an eye on key support zones and potential continuation patterns to confirm the trend reversal.
👉 What do you think — new rally or a bull trap?

NQ: 161st trading session - recapA more indepth post about my session, my journaling has been pretty bad recently that's why I gotta pick it up again.
Also I found out how I can enjoy my sessions 10x more: coffee, I'm usually just tired cause of sports and school, this not only makes it more enjoyable but I'm also way more locked in. Coffee might actually be the secret revolutionary trading strategy everyones been looking for.

Strong bullish outlook for the E-mini Nasdaq-100 (NQM2025)Nasdaq-100 E-mini Futures (NQM2025) – Technical & Fundamental Analysis
Technical Overview:
My Daily chart analysis on TradingView highlights a strong bullish outlook for the E-mini Nasdaq-100 (NQM2025). Here are the key takeaways:
Liquidity Sweep & Support Retest:
The recent decline led to a liquidity sweep (LQ SWEEP) at a critical ascending trendline. This suggests a classic stop-hunt scenario where weaker long positions were liquidated before stronger buyers stepped in.
Historical price action indicates that buyers previously entered at similar levels (noted as "Buyers coming in hot here"), reinforcing this demand zone.
Bullish Trendline Respect:
The long-term ascending trendline has been respected, acting as a dynamic support level.
The recent bounce suggests that this level remains intact, further validating the bullish structure.
Order Block (OB) & Market Structure Shift (MSS):
A previous bearish market structure shift (MSS) led to a short-term decline, but price has since found support and rebounded.
The chart suggests a reversion to the upside, targeting prior imbalance zones and liquidity pockets.
Projected Path & Targets:
The green projection indicates an expectation of higher highs, likely targeting the 21,500 - 22,500 range in the coming weeks.
The sell-side liquidity has been cleared, increasing the probability of a bullish move towards the order block resistance near 21,000.
Fundamental Confirmation (#EdgeFinder & #COT Data):
From a fundamental perspective, the bullish bias is further confirmed by EdgeFinder data and recent Commitment of Traders (COT) reports:
Institutional Positioning:
The latest COT data shows that institutional traders have increased their net long positions in Nasdaq futures, signaling bullish sentiment.
Macroeconomic Factors:
Recent economic reports and Fed statements have favored a risk-on environment, benefiting tech-heavy indices like Nasdaq.
Earnings season is approaching, with expectations of strong tech sector performance potentially fueling further upside.
Conclusion & Market Sentiment:
The confluence of technical support, institutional buying, and positive macroeconomic factors strengthens the case for a bullish continuation in Nasdaq-100 futures.
The key level to watch is 20,000—if held, the probability of a move towards 21,500 - 22,500 increases significantly.
Risk factors include unexpected macroeconomic shifts or stronger-than-expected hawkish Fed rhetoric, which could slow momentum.
This is not financial advice, only data analysis. Please consult a qualified financial professional for personalized guidance.

Long Position NQLong Position NQ
SL: Swing low
TP: FE 0.618
Size based on your risk management strategy


High Probability Long Position NQHigh Probability Long Position NQ
TP: FE 1.27
SL: Swing Low
Size based on your risk management strategy

High Probability Long Position NQHigh Probability Long Position NQ
SL: Swing Low
TP: FE 1.618
Size based on your risk management strategy

High Probability Short Position NQTP: FE 4.618
SL: Swing high
Size based on your risk management strategy

NQ 27/03-2025Areas to watch for today
Do close the opening gap ?
Not financial advice. For educational use only.

Today analysis for Nasdaq, Oil, and GoldNasdaq
The Nasdaq closed lower, facing resistance at the 240-day moving average on the daily chart. With a significant gap between the price and the 5-day moving average, a pullback toward the 5-day MA was anticipated. The index did find support at the 5-day MA, closing with a lower wick. The key question now is whether the current correction wave will fill the gap created on Monday, as it faced resistance at the 240-day line. If you’re looking to buy on dips, it’s best to focus on the gap area as a potential support zone. The MACD remains in a golden cross, and with a noticeable spread from the signal line, the market is likely to stay range-bound unless a bearish crossover occurs.
On the 240-minute chart, a bearish crossover (death cross) has formed, suggesting the potential for further downside. However, the price is approaching a strong support zone where buying interest previously emerged. Thus, buying on dips in lower zones may be favorable. In the short term, both the MACD and the signal line remain above the zero line, indicating a possible short-term rebound. Be cautious with chasing short positions and monitor lower time frames.
Also, don’t forget: Today’s GDP release may influence market direction.
Crude Oil
Oil closed higher, reaching $70 on the daily chart. Since the $70–71 range is a major resistance zone, it’s likely the trend may consolidate in this area. The daily MACD is rising sharply, and buying pressure appears strong and one-sided. Despite the resistance at $70–71, if oil gaps up over the weekend, there’s a chance this resistance could be broken by a gap-up move on Monday. Keep an open mind to this possibility, but also be cautious over the weekend (over-the-weekend risk).
On the 240-minute chart, the MACD is bouncing off the signal line, with strong renewed buying pressure. However, if oil fails to break higher, a MACD divergence could develop, so avoid chasing longs at elevated levels. Overall, it’s safer to treat the $71 level as the upper boundary of a range, favoring short-term selling strategies. Watch the lower timeframes for signs of trend reversal.
Gold
Gold ended the day flat within a narrow range, forming a small consolidation box ahead of today’s GDP release and tomorrow’s PCE data. The daily MACD is converging with the signal line, suggesting we are approaching a turning point — either a new leg up or a bearish crossover. Both bullish and bearish scenarios remain open, so it’s important to monitor how the market reacts to upcoming data. If gold fails to push higher, a bearish divergence may form, opening the door to a pullback toward the 5-week MA on the weekly chart.
On the 240-minute chart, both MACD and the signal line are hovering near the zero line, indicating sideways movement. Since the signal line remains above zero, the buy side still holds a slight edge, but confirmation via a strong bullish or bearish candle is needed to establish a trend. Any MACD signal triggered at the zero line could lead to a larger directional move, so keep that in mind. Until data is released, continue range-bound trading, and avoid premature long or short positions, as today’s trend may remain undecided.
March is coming to an end. Make sure to keep a close eye on today and tomorrow's data releases and aim to close the month with solid results.
Wishing you a successful trading day!
If you like my analysis, please follow me and give it a boost!
For additional strategies for today, check out my profile. Thank you!

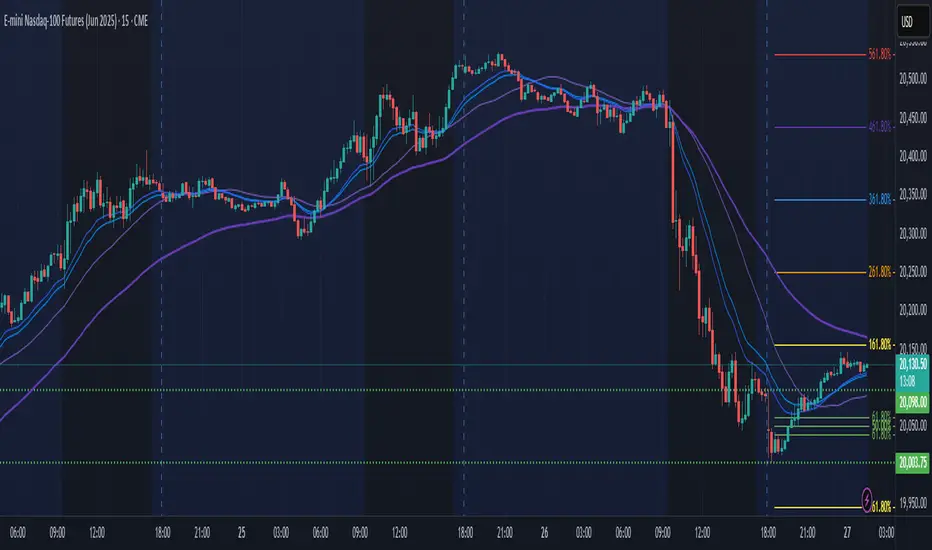
NQ Power Range Report with FIB Ext - 3/27/2025 SessionCME_MINI:NQM2025
- PR High: 20098.00
- PR Low: 20003.25
- NZ Spread: 212.0
Key scheduled economic events:
08:30 | Initial Jobless Claims
- GDP
Partial weekend gap fill
- Retracing above previous session close, in previous week range highs
- Re-enters daily Keltner average cloud near 20200
Session Open Stats (As of 12:35 AM 3/27)
- Session Open ATR: 439.39
- Volume: 42K
- Open Int: 228K
- Trend Grade: Neutral
- From BA ATH: -11.1% (Rounded)
Key Levels (Rounded - Think of these as ranges)
- Long: 20954
- Mid: 19814
- Short: 18675
Keep in mind this is not speculation or a prediction. Only a report of the Power Range with Fib extensions for target hunting. Do your DD! You determine your risk tolerance. You are fully capable of making your own decisions.
BA: Back Adjusted
BuZ/BeZ: Bull Zone / Bear Zone
NZ: Neutral Zone
Trump's Auto Tariffs Shake Things Up on Wall StreetTrump's tariffs are clearly not going away. In fact, he's upped the ante with a 25% tariff on all non-US cars, vowed to target pharmaceuticals and promised more are to come on April 2nd. Given the dire weakness in consumer sentiment data, I suspect Wall Street indices may have seen a swing high.
Matt Simpson, Market Analyst at City Index and Forex.com

MNQ/NQ Short Trade Idea Trading to a Gap Fill To The Downside Will Update Trade Idea As the Week or Day Goes By

NQ/MNQ Trade Idea #2Depending on what happens near the entry price i will wait for a comfirmation before i enter the trade but the overall outline is Showned

NQ: 160th trading session - recapYeee so I'm late again. I've been struggling with some things mentally but I took a break today (not even willingly but it did me well lmao) and I'm ready for tomorrow. Mind is clear, my strategy is more defined and I just need to become patient and confident again.

US Cash Market Goes 'Flippant'. Understanding Revenge in TradingFirst of all, revenge trading is a destructive pattern of behavior in trading where individuals make impulsive and emotionally-driven decisions in an attempt to recoup previous losses. This practice is not limited to novice traders; even experienced traders can fall prey to it. The primary emotions driving revenge trading include anger, frustration, greed, fear, and shame, which cloud judgment and lead to irrational decision-making.
Causes of Revenge Trading
Emotional Response: Traders often react emotionally to significant losses, feeling compelled to immediately recover their losses without adequate analysis or strategy.
Lack of Discipline: Deviating from established trading plans and risk management principles is common in revenge trading.
Psychological Triggers: Feelings of injustice, anger, or a desire for vengeance against the market can trigger revenge trading.
Consequences of Revenge Trading
Financial Losses: Revenge trading often results in larger losses due to riskier trades and poor timing.
Emotional Burnout: The stress and frustration from repeated losses can lead to emotional exhaustion and decreased trading performance.
Career Impact: Persistent revenge trading can erode confidence and lead to a trader questioning their abilities.
Real-Life Examples of Revenge Trading
Increasing Position Size: A trader experiences a significant loss and decides to double or triple their position size in the next trade, hoping to quickly recover their losses. This action disregards risk management principles and often leads to even greater losses.
Ignoring Stop-Loss Orders: After a loss, a trader might hold onto a losing position longer than planned, hoping it will turn around. This behavior ignores established stop-loss orders and can result in further financial damage.
Chasing Trades: A trader feels compelled to enter trades without proper analysis, driven by the urge to recoup losses quickly. This impulsive behavior can lead to a series of poor trading decisions.
Market Reversal Scenario: A trader suffers a loss due to a sudden market reversal. In an attempt to recover, they enter a trade in the opposite direction without thorough analysis, which can exacerbate their losses.
Wish more examples? Watch recent one below 👇👇
How to Avoid Revenge Trading
To avoid revenge trading, traders should focus on maintaining discipline and adhering to their trading strategies. This includes:
Taking Breaks: After a loss, taking time to reassess the market and calm emotions can help prevent impulsive decisions.
Sticking to Plans: Adhering to established trading plans and risk management principles is crucial.
Emotional Awareness: Recognizing emotional triggers and taking steps to manage them can help prevent revenge trading.
In conclusion, revenge trading is a HARMFUL AND DANGEROUS practice that can lead to significant financial and emotional consequences. Understanding its causes and recognizing its signs are essential steps in avoiding this behavior and maintaining a successful trading career.
--
Best wishes,
@PandorraResearch Team 😎

MNQ Long March 25, 2025MNQ is bullish, and I believe this trade will execute before it makes any downward movement. Just make sure your trades are protected with a stop loss, and let me know what you think.

NQ Power Range Report with FIB Ext - 3/25/2025 SessionCME_MINI:NQM2025
- PR High: 20531.50
- PR Low: 20504.00
- NZ Spread: 61.5
Key scheduled economic events:
08:30 | Durable Goods Orders
09:30 | Crude Oil Inventories
Cleared previous week high, raising value towards 20600
- Auctioning inside daily Keltner average cloud below previous session close
- Weekend gap remains unfilled
Session Open Stats (As of 1:55 AM 3/25)
- Session Open ATR: 432.71
- Volume: 24K
- Open Int: 224K
- Trend Grade: Neutral
- From BA ATH: -9.6% (Rounded)
Key Levels (Rounded - Think of these as ranges)
- Long: 20954
- Mid: 19814
- Short: 18675
Keep in mind this is not speculation or a prediction. Only a report of the Power Range with Fib extensions for target hunting. Do your DD! You determine your risk tolerance. You are fully capable of making your own decisions.
BA: Back Adjusted
BuZ/BeZ: Bull Zone / Bear Zone
NZ: Neutral Zone

