NQ: 163rd trading session - recapBit frustrated cause so many news mannnnnn. Couldn't really trade for that long cause I stop after major news but also a PMI folder just 15min into the opening is just evil.
Good session tho. Won't trade tomorrow, but I will thursday and friday.
MNQ1! trade ideas

Double Bullish Divergence Flashing on $SPY and $QQQWe’re spotting a double bullish divergence across two major indices: the S&P 500 ( AMEX:SPY ) and the NASDAQ 100 ( NASDAQ:QQQ ).
On both daily charts:
Price is making lower lows, signaling continued downward pressure.
Meanwhile, the RSI is forming higher lows, revealing a potential loss of bearish momentum.
This kind of setup often precedes a trend reversal or strong relief bounce, especially when observed across multiple indices at once. The fact that both AMEX:SPY and NASDAQ:QQQ are flashing the same signal gives added confluence and strength to this potential move.
Divergence = a potential bullish signal
Watch for confirmation: break of previous highs or strong bullish candles.
Caution: divergences don’t always play out — wait for confirmation before going long.
Are we looking at the bottom forming? 👀
Stay alert. A shift in sentiment could be underway.

NQ SellQuite an easy sell here on NQ today.
We had 15m FVG, 5m IFVG, and SMT divergence from MNQ.
Easy target to Asia Lows.

Nasdaq updated forecast with sell-side & buy-side targetsNQ futures aiming at 18900 level off these last highs. Now seeing developing weakness... expecting sellers to take it down for one more low as we approach the implementation of Trump's tariffs on 4/2.
Look for renewed buyer strength after the next set of lows as we approach the next FOMC rate decision into first half of May 2025.
This is a great swing trade setup for TQQQ, if desired, or long dated in-the-money QQQ call options.

NQ C&H PatternThe formation of the C&H Pattern looks good. I would look for a retest of the entry level. Remember, we are in a downtrend.

KEEP TRADING SIMPLE - NDXGood Morning,
Today I am using NDX future to chart. As you can see NDX is forming a new trend, this will most likely be short lived.
This morning my portfolio was 75% SQQQ (I have sold these shares now), I held zero Crypto which I will start looking at accumulating again. I will look for stocks that mimic the NDX Index.
Thank you and have a great day!

NQ Power Range Report with FIB Ext - 4/1/2025 SessionCME_MINI:NQM2025
- PR High: 19413.75
- PR Low: 19326.75
- NZ Spread: 194.25
Key scheduled economic events:
09:45 | S&P Global Manufacturing PMI
10:00 | ISM Manufacturing PMI
- ISM Manufacturing Prices
- JOLTs Job Openings
Holding below previous week's low
- Advertising rotation above previous session high, into breakout range
Session Open Stats (As of 12:35 AM 4/1)
- Session Open ATR: 442.17
- Volume: 38K
- Open Int: 247K
- Trend Grade: Neutral
- From BA ATH: -14.5% (Rounded)
Key Levels (Rounded - Think of these as ranges)
- Long: 20954
- Mid: 19814
- Short: 18675
Keep in mind this is not speculation or a prediction. Only a report of the Power Range with Fib extensions for target hunting. Do your DD! You determine your risk tolerance. You are fully capable of making your own decisions.
BA: Back Adjusted
BuZ/BeZ: Bull Zone / Bear Zone
NZ: Neutral Zone

Today analysis for Nasdaq, Oil, and GoldNasdaq
The Nasdaq closed lower with a gap-down amid growing recession fears. Although it did not reach the 20-month moving average (MA) on the monthly chart, last month’s long bearish candlestick has resulted in a sell signal on the monthly futures chart—the first time in three years since February 2022. From a monthly perspective, the 16,900–17,500 range appears to be a good buying zone, but it is important to monitor whether the index reaches this level within this month’s candle. The 20-month MA is likely to be briefly breached, even if a lower wick forms.
On the weekly chart, the Nasdaq is currently finding short-term support around 19,000, but given the large gap between the 3-week and 5-week MAs, a rebound remains a possibility. On the daily chart, a sell signal has not yet been confirmed. If further declines confirm a bearish crossover, the Nasdaq could enter a third wave of selling, with a target of 17,300. The key question is whether the market experiences another sharp drop.
However, given the significant distance from the 5-day MA, the more likely scenario is sideways movement for a few days, allowing the moving averages to catch up before a potential further decline. In this case, it is advisable to trade within the range but always use stop-losses. The 240-minute chart also shows strong downward movement. While the market is in oversold territory, making short-selling more favorable, there is also the possibility of a range-bound pattern forming on the daily chart. If taking buy positions at the lows, strict stop-loss management is essential.
Crude Oil
Oil closed higher following news of tariffs imposed on Russian oil. The price successfully broke above the key resistance at $70, also surpassing the 240-day MA. On the monthly chart, oil has now entered a range where further upside potential exists, and there is a possibility that the MACD could attempt a bullish crossover with the signal line.
On the daily chart, the MACD has moved above the zero line, pulling the signal line upward. If the price stays above the 240-day MA, it may form a strong trend reversal pattern with accelerated gains. On the 240-minute chart, the MACD remains above the zero line and is crossing above the signal line, indicating continued buying momentum.
Overall, it is best to focus on buying dips, as April’s first trading session could see the price gapping above the 240-day MA. Holding overnight short positions carries risk, so caution is advised.
Gold
Gold closed higher, driven by strong demand for safe-haven assets. On the monthly chart, gold formed a long bullish candlestick. However, given the large gap between the price and the 3-month & 5-month MAs, a pullback remains a possibility. The key question is whether gold will continue rising before a correction or correct first before resuming its uptrend. It is best to monitor the price action closely.
On the daily chart, the MACD is forming a third wave of buying pressure, opening the possibility for a price target around 3,216. Thus, it is advisable to focus on buying dips, while being cautious about chasing highs due to potential volatility. The 240-minute chart indicates that strong buying momentum continues, as gold remains in overbought territory.
Since this is the beginning of a new month, key economic reports—including the ISM Manufacturing PMI and the U.S. Jobs Report—could significantly impact gold’s volatility. For both buy and sell positions, it is essential to set stop-loss levels, as increased volatility is expected.
With Trump’s tariff policies increasing the risk of a global recession, liquidity in global equity markets is drying up, reducing the attractiveness of stocks. The clear contrast between Nasdaq and gold’s performance is likely to persist for some time.
As we enter April’s first trading session, trade cautiously and adapt to market conditions.
Wishing you a successful trading day!
If you like my analysis, please follow me and give it a boost!
For additional strategies for today, check out my profile. Thank you!

Trading with the CoffeeKiller Suite: A Friend-to-Friend GuideHey there! So you've got the CoffeeKiller indicator suite loaded up on your charts, and you're wondering how to use them together as a cohesive trading system. Let me walk you through how I'd approach this setup with the Rev&Line with TrendMarker on your main price chart and the RSI+MFI Momentum Mapper and MACD Boundary as your oscillators below.
The Big Picture: How These Work Together
Think of this setup as a three-layer confirmation system:
1. Rev&Line with TrendMarker gives you the big picture trend and potential reversal points on price
2. RSI+MFI Momentum Mapper shows you the underlying momentum strength
3. MACD Boundary confirms cycle timing and helps with entry precision
What makes this system powerful is how they complement each other. When all three align, you've got a high-probability trade setup.
Reading Your Main Chart: Rev&Line with TrendMarker
This is your primary trend identifier. The key features to watch are:
- Background color: Green means bullish (both SuperTrend and PSAR agree), red means bearish. This is your first clue about trend direction.
- ZigZag lines: These connect significant pivot points, helping you visualize the trend structure.
- Marker lines: These track the price range of the current swing. The high (magenta) and low (cyan) marker lines create a channel that price tends to respect.
- Triangle signals: When you see a down triangle at a pivot high or an up triangle at a pivot low, pay attention! These often mark potential reversal points.
The beauty of the Rev&Line indicator is that it combines multiple technical concepts (ZigZag, SuperTrend, PSAR, and Donchian Channels) into one visual guide.
Checking Momentum: RSI+MFI Momentum Mapper
This oscillator is your momentum gauge, combining RSI and MFI for a more reliable signal:
- Zero line: Above zero means bullish momentum, below means bearish.
- Colored columns: Watch how these behave - the color changes tell you about momentum shifts.
- Marker lines: Just like on the main chart, these track the range of the current momentum swing.
- Peak markers: The yellow triangles mark significant momentum peaks and troughs.
When the marker lines are making higher highs in bullish territory or lower lows in bearish territory, the momentum is strong. When they start to flatten out, momentum is weakening.
Timing Entries: MACD Boundary
The MACD Boundary adds precision to your entries and confirms the other indicators:
- Histogram columns: The dynamic coloring tells you about strength and direction.
- Marker lines: These track the historical range of the current MACD cycle.
- Peak markers: Just like the RSI+MFI indicator, these show you momentum turning points.
One huge advantage of this MACD implementation is the timeframe flexibility - you can view a shorter timeframe chart but calculate the MACD on a higher timeframe for better trend alignment.
Putting It All Together: Trade Setups
Bullish Setup:
1. Main chart: Background turns green, ZigZag starts moving up, and we get an up triangle
2. RSI+MFI: Crosses above zero, columns turn green, and the high marker line starts making higher highs
3. MACD: Histogram turns green and crosses above zero
Bearish Setup:
1. Main chart: Background turns red, ZigZag starts moving down, and we get a down triangle
2. RSI+MFI: Crosses below zero, columns turn red, and the low marker line starts making lower lows
3. MACD: Histogram turns red and crosses below zero
Fine-Tuning Entries
For entry timing, I'd pay special attention to:
- When price tests the lower (cyan) marker line in an uptrend
- When the RSI+MFI indicator shows a yellow up triangle at a trough
- When the MACD histogram starts to turn back toward zero after making a notable low
Managing Risk
Use the marker lines on the main chart for stop placement - they create natural areas of support and resistance. In an uptrend, I'd place my stop just below the lower marker line. In a downtrend, I'd place it just above the upper marker line.
Pro Tips from Personal Experience
1. Watch for divergences: If the main chart is making higher highs but the oscillators are making lower highs, be cautious of a potential reversal.
2. Pay attention to confluences: When marker lines from different timeframes align at a similar price level, that's often a powerful support/resistance zone.
3. Don't fight the background color: One of the easiest mistakes is trying to short when the background is green or go long when it's red. Be patient and wait for full alignment.
4. Focus on peak markers: Those little yellow triangles on the oscillators often precede major moves, especially when they show up after a deep momentum thrust.
5. Use the percentage values: On the main chart, the percentage indicators show where price is within the current range - great for gauging how much "room" is left in the current swing.
Remember, no system is perfect, but this suite gives you a comprehensive view of market structure, momentum, and timing. When all three indicators align, that's when the highest probability setups occur.
Disclaimer
This trading system explanation is provided for educational and informational purposes only. Trading financial markets involves substantial risk of loss and is not suitable for all investors. The analysis, indicators, and strategies discussed do not constitute financial advice, investment recommendations, or signals to trade. Past performance of any trading system or methodology is not necessarily indicative of future results. Before implementing any trading strategy, consult with a licensed financial advisor who can provide personalized advice based on your specific financial situation, risk tolerance, and investment goals. Remember that no trading system can guarantee profits, and you should never invest money that you cannot afford to lose.

NQ: 162nd trading session - recapGood session today, low momentum after the opening but I was realtively focused, good one.
PLUS: TIMES ARE NORMAL AGAIN THANK GODDDDD

Nasdaq, NQM2025, Live executionHere are some ways to make the text more attractive:
1. **"Master Nasdaq Trading: Capture 100 Pips with Ease Using ICT Execution Concepts and Targeting Buy-Side Liquidity!"**
2. **"Unlock the Power of Nasdaq: Grab 100 Pips effortlessly by Leveraging ICT Execution Concepts and Targeting Buy-Side Liquidity!"**
3. **"Boost Your Nasdaq Trades: Seize 100 Pips with Precision Using ICT Execution Strategies and Focusing on Buy-Side Liquidity!"**
4. **"Crack the Code of Nasdaq Trading: Quickly Snag 100 Pips with ICT Execution Concepts, Aiming for Buy-Side Liquidity!"**
5. **"Trade Nasdaq Like a Pro: Catch 100 Pips with ICT Execution Techniques, All While Targeting Buy-Side Liquidity!"**
Let me know if any of these resonate with the style you're going for!

NASDAQ 100: Bear Market in Sight?The NASDAQ 100 has officially entered correction territory, now trading more than -10% below its most recent high. Even more concerning: it's just 5% away from a full-blown bear market, which is defined as a drop of -20% or more.
As seen in the chart, we’ve broken below the -15% threshold and are rapidly approaching the critical 18,113 level, which would mark the -20% mark. If price action fails to hold the current level and momentum continues downward, we could be on the verge of a major shift in market sentiment.
If the bear market threshold is crossed, it may trigger panic selling or forced liquidation.
We should prepare for increased volatility and monitor this level closely. A bounce here could be a buying opportunity — but a breakdown could open the door to a deeper downturn.
Will buyers step in... or are we heading deeper into bearish territory?

Buy Nasdaq FuturesFor the final couple hours of this 4 hour candle, it looks beneficial to buy to Asia's high.
4 Hour low made, manipulation to form bottom wick, inverted FVG close, now buy time!

NASDAQ 100 – Buy OpportunityIn this technical analysis of the NASDAQ 100 (NDX), an ideal entry zone has been identified after the price rebounded from a strong support level.
Entry Zone: Around 19,164.75
Target Price: 22,152.50
Stop Loss: 18,913.75
Risk/Reward Ratio: 1:14.41
This analysis is based on price action and key technical levels, with expectations of continued bullish momentum. Do you agree with this scenario? Share your thoughts!

Today analysis for Nasdaq, Oil, and GoldNasdaq
The Nasdaq closed sharply lower, forming a long bearish candlestick, as recession fears intensified. The index fell toward the lower Bollinger Band on the daily chart, while the MACD moved closer to the signal line, indicating a correction.
On the weekly chart, the Nasdaq faced resistance slightly above the 5-week MA, forming an upper wick and closing lower. The MACD is falling steeply, and the signal line is also in a downtrend, suggesting the potential for an overshooting move downward before forming a bottom. From a daily perspective, key support zones to watch are around 19,000 (first level) and 18,500 (second level). The MACD has not yet crossed below the signal line, but if a bearish crossover (death cross) occurs, a strong third wave of selling pressure could emerge. Therefore, caution is advised for long positions. However, since the MACD has not yet confirmed a bearish crossover, there is also the possibility of a rebound off the signal line. It is crucial to wait for a confirmed trend reversal before taking long positions.
On the 240-minute chart, strong sell signals have emerged, leading to a steep decline. The current price action resembles the movement seen on February 21, but since the bottom is not yet clear, it is best to adopt a conservative approach. For short positions, the 3-day moving average can be used as a reference level. For long positions, the lower Bollinger Band may provide a short-term buying opportunity. As today marks the last trading day of the month, watch closely to see if the Nasdaq reaches the 20-month MA or ends the month with a lower wick.
Crude Oil
Oil closed lower, facing resistance at $70. It has fallen back below the 5-day MA, trapping the price within a range-bound structure. On the weekly chart, oil was rejected at the 10-week MA, and since the MACD has not yet formed a bullish crossover, there is a chance that oil could retest its previous double-bottom level. A consolidation phase between the 5-week and 10-week MAs appears likely.
On the daily chart, as the price corrected, the MACD began converging with the signal line. If oil retraces to around $68, a short-term buying opportunity may arise. For oil to resume its uptrend, it needs to pull back toward $68, rebound, and break above $70 with strong momentum. However, this move would likely require a global catalyst. On the 240-minute chart, both the MACD and signal line remain above the zero line, suggesting a higher probability of a rebound and a golden cross formation. Overall, the best approach is to focus on dip-buying opportunities during this phase.
Gold
Gold closed higher, breaking to a new all-time high on the daily chart. Last week, there was a possibility of a pullback toward the 5-week MA, but the MACD has turned upward, surpassing its previous high, reducing the likelihood of a bearish divergence and increasing the probability of further upside. However, since gold has not yet tested the 5-week MA, a short-term correction remains a possibility. On the daily chart, buying opportunities were available at the 3-day MA following a strong bullish candle. A pullback to the 5-day MA within the next few days remains possible, and if this happens, it could present another dip-buying opportunity. Based on wave analysis, gold could target around 3,216. To confirm this upside scenario, the daily chart must show stronger bullish momentum, eliminating the risk of MACD divergence.
On the 240-minute chart, gold has been experiencing strong upward momentum, making it a buy-on-dips market. However, for a more comfortable long position, the MACD needs to exceed its previous peak. Overall, a long-only strategy remains preferable. For short positions, it is difficult to pinpoint the exact peak, so strict stop-loss management is essential. This week, key economic events include the ISM Manufacturing & Services PMIs and Friday's U.S. jobs report, which could increase gold's volatility. Stay cautious.
Today marks the final trading session of March. Tariff-related news and gold’s record highs indicate rising market volatility. Stay adaptive to the market’s movements and trade safely as we close the monthly candle.
Wishing you a successful trading day!
If you like my analysis, please follow me and give it a boost!
For additional strategies for today, check out my profile. Thank you!

NQ Power Range Report with FIB Ext - 3/31/2025 SessionCME_MINI:NQM2025
- PR High: 19365.00
- PR Low: 19275.00
- NZ Spread: 201.25
Key scheduled economic events:
09:45 | Chicago PMI
Continuing value decline below Friday's low
- Broke previous weeks low
- Short-term rotating off 19180s inventory floor
Session Open Stats (As of 12:45 AM 3/31)
- Session Open ATR: 444.15
- Volume: 70K
- Open Int: 241K
- Trend Grade: Neutral
- From BA ATH: -15.1% (Rounded)
Key Levels (Rounded - Think of these as ranges)
- Long: 20954
- Mid: 19814
- Short: 18675
Keep in mind this is not speculation or a prediction. Only a report of the Power Range with Fib extensions for target hunting. Do your DD! You determine your risk tolerance. You are fully capable of making your own decisions.
BA: Back Adjusted
BuZ/BeZ: Bull Zone / Bear Zone
NZ: Neutral Zone

Yearly Candle on NQ 2025I believe what we're seeing right now is simply the market printing the “open low” of the yearly candle. The recent dip seems driven by short-term fear surrounding the new tariffs, but in my view, this is just noise. Long-term, this sets up a bullish scenario.
Businesses won’t adjust overnight—it takes time to shift operations away from high-tariff regions. But as that transition unfolds, we’ll likely see improved margins and stronger fundamentals emerge.
From a technical standpoint, I’m watching for a key reversal after price revisits the order block. If we get that reaction, it could mark the beginning of a broader move higher. This looks like manipulation, not distribution.
OLHC
- Gavin
NFA, DYOR

NQ Range (03-31-25)NAZ on the edge of the Danger Zone, in the Overnight. Keep in mind that the new limit down is -7% and the NAZ is -1% now. Yellow circles are lower targets and white arrow is old range, I would expect a DZ hold to pop back up in range. O/N rig team should show up and lift it or maybe they have changed their tune (after 2-3 years) and will take it over the Edge. Out again next week, will post updates when I can.

#202513 - priceactiontds - weekly update - nasdaq e-mini futuresGood Evening and I hope you are well.
comment: Last week I wrote that we need a proper channel down and the past week was the worst case scenario for the bulls. We could not even get to the 50% retracement and turned down violently again. There is a small chance for the bulls to make this a double bottom and go sideways but as of now that is very very low probability. More likely is that we have formed the top of the channel and will get a big second leg down to 18000 or lower. If we go down below 19000, my thesis is that we go down for 2 more weeks and then earnings will decide on the next impulse. For now the technicals are clear, market could not even retrace 50%, we turned around the daily 20ema and volume on the down move is picking up again. Everything points to a bear trend.
current market cycle: strong bear trend
key levels: 19000 - 20500
bull case: Bulls running for the exits. They have some previous support at the 2024-09 low 19073 but that is most likely not stopping this freight train down. Next big support is at 18000/18100 which is my W3 target. Only question now is if we find buyers tomorrow who want to keep the market above 19000. It’s not impossible that we could see 1-2 more days of stalling around 19000 but given the current structure the selling is just too strong to look for any longs.
Invalidation is below 19000.
bear case: Bears have now erased about a year of gains and we are heading lower. Friday was another strong sell signal and bears now want to close the monthly bar at the very low to also produce a huge sell signal on the weekly and monthly charts. The selling is strong enough for at least a decent sized second leg and the measured move leads to 16200 which is between my year-end-special target of 17500 and the bull trend line from the covid lows. Plan for the next 2 weeks is the W3 and W4 where I expect W3 to hit 18000 and W4 could retest 19000.
Invalidation is above 20600.
short term: Clear bear trend now once we drop below 19000. W3 should get us to around 18000 while W4 could be good for a retest of 19000. No longs for me what so ever. Big bear trend line from 22450 has to hold.
medium-long term - Update from 2024-03-16: My most bearish target for 2025 was 17500ish, given in my year-end special. Clear W1 of this bear trend. Market now has to close below 19000 to confirm W3. Depending on how deep W3 goes, W5 will either reach only around 17500 or the bull trend line around 16000.
current swing trade: None
chart update: Added most likely upper bear trend line and adjusted the 5-wave series.

NQ weekly walkthrough and outlook for the next weekExpecting onesided displacement on NQ towards the sellside. Also we have NFP week.

NQ Swing Long Trade idea based on supply and demand, intermarket analysis, COT positioning and cross market valuation. Following a structured approach with clear entry, risk management, and confluence factors.

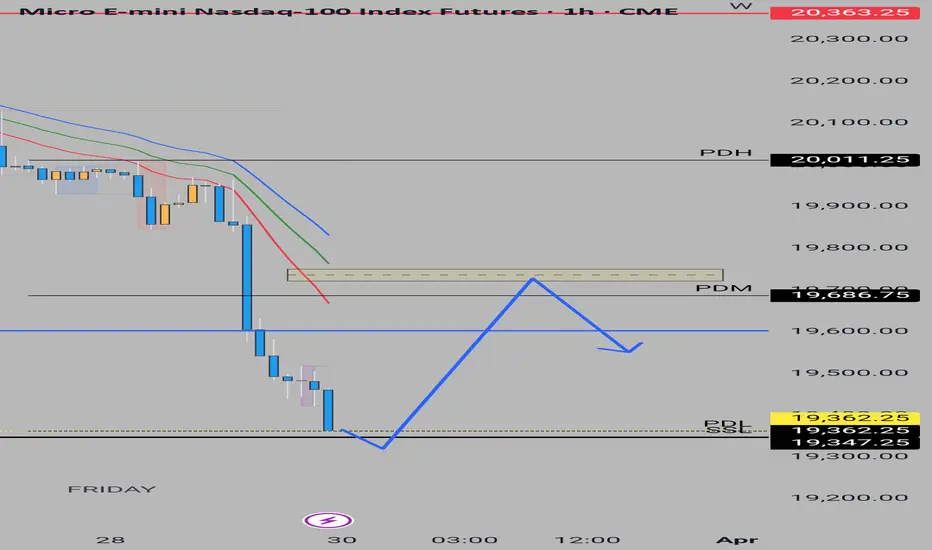
MNQ Monday AnalysisI see MNQ taking the very near low of MARCH 10th. After, I see it bullish most of the day on Monday back up to or near 19,735. Then a pullback to close Monday near 19,500.
NQ Swing Long Trade idea based on supply and demand, intermarket analysis, COT positioning and cross market valuation. Following a structured approach with clear entry, risk management, and confluence factors.
