NASDAQ analysis NASDAQ has been making ATH regularly. We analyise to see where to take entry based on price action.
MNQ1! trade ideas

2025-07-09 - priceactiontds - daily update - nasdaqGood Evening and I hope you are well.
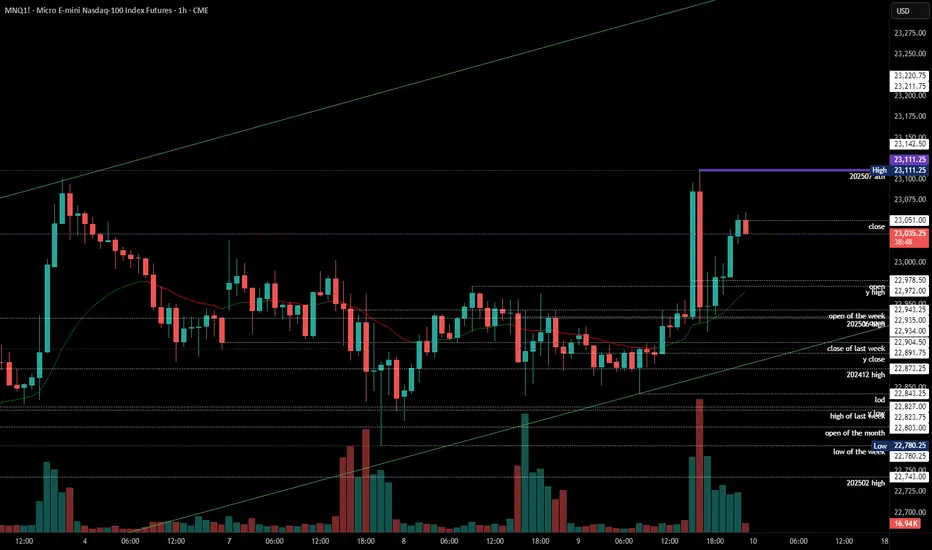
comment: Bears just need to do more. As long as we are not leaving behind bear gaps, bulls keep buying the dips. Wait for long pullbacks if we keep making higher lows. The bull channel is also still valid.
current market cycle: bull trend
key levels: 22700 - 23300
bull case: As long as Bulls stay comfortably above 22500, they are fine and sideways is a very bullish correction for them. Bears are certainly not doing much, so bulls buy every dip. Nothing changed. Might go up to 23300 or higher. No one knows where it will end but it’s likely orange face will end it and he will make sure he announces it in his private Epstein-and-Friends signal group in advance. Some put options 3-6m are fine to buy I think.
Invalidation is below 22700.
bear case: Bears are just not doing enough. Need something below 22700 and most likely an event to be the catalyst for it. I will leave it at that.
Invalidation is above 23500.
short term: Neutral until US-EU tariff shit show get’s a nice tweet or so. We will go down hard again. Be patient.
medium-long term - Update from 2024-06-29: No change in plans. I expect 20000 to get hit over the next 3 months and maybe 19000 again.
trade of the day: Long US open was a bit obvious but buying the huge drop was not.

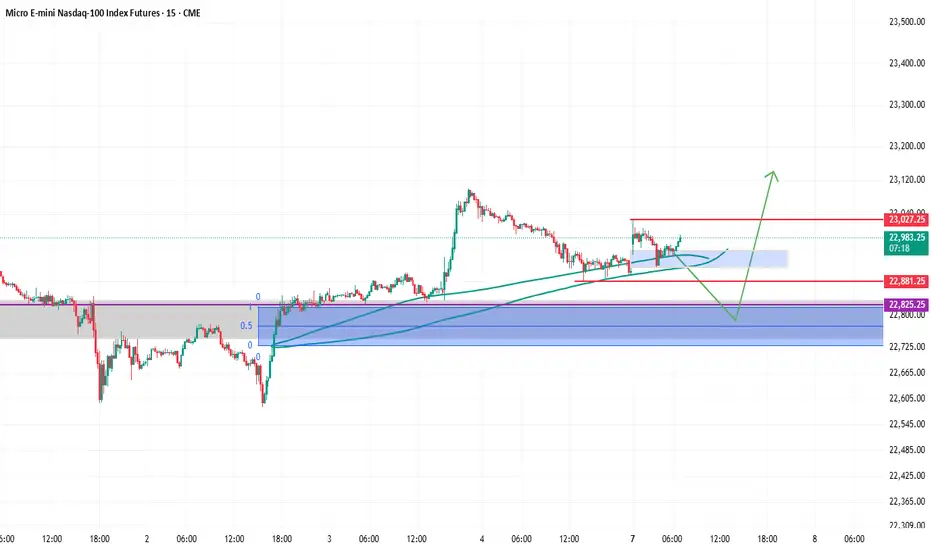
MNQ setups Ok, So since i just woke up so i wont describe much on this chart.
What i would like to see is the following, price retraces to the blue box (where there is too much liq before that blue box), then continue upwards.
also if the price just closes above 23000, then its also good to wait until the price reaches back to 22860 and then go long from there.
You can also take some counter trend trades in between if the price doesn't show momentum to continue upwards. That would happen if the price closes below 22900.
NQ Futures Weekly Plan – Major Liquidity Zones Mapped”📍 Weekly Outlook – NQ (NQU2025)
Week of July 8 | 30-Min Chart | HTF Trend: Bullish
🔼 Key Resistance Zones
ATH – 23,102.50
‣ Major liquidity draw and psychological level
22,935 zone
‣ Prior Thursday and Monday highs
‣ HTF rejection or continuation zone
Watch for LTF sweeps or CHoCH before fading strength
🔽 Key Support Zones
22,785 area
‣ WED LO, SUN HI, and FVG confluence
‣ Ideal HTF bullish continuation zone
22,582 (Monday Low)
‣ First downside liquidity target
22,455 (Sunday Low)
‣ Deep sweep zone if trend weakens
📌 Strategy Notes
✅ Align with HTF structure – current trend remains bullish unless 22,582 fails
🔍 Use LTF (1m–5m) for precision entries only after HTF levels are tested or swept
⏰ Focus on session timing (NY Open, London) for true intent
🧠 Reminder:
Don’t let LTF noise shake your bias.
HTF sets the trap. LTF gives you the trigger.
Stay patient. Trade clean.
🔖 Hashtags:
#NQ #FuturesTrading #OrderFlow #SmartMoney #ICTConcepts #LiquiditySweep #HTFvsLTF #Nasdaq100 #PriceAction #PlaymakerTrading

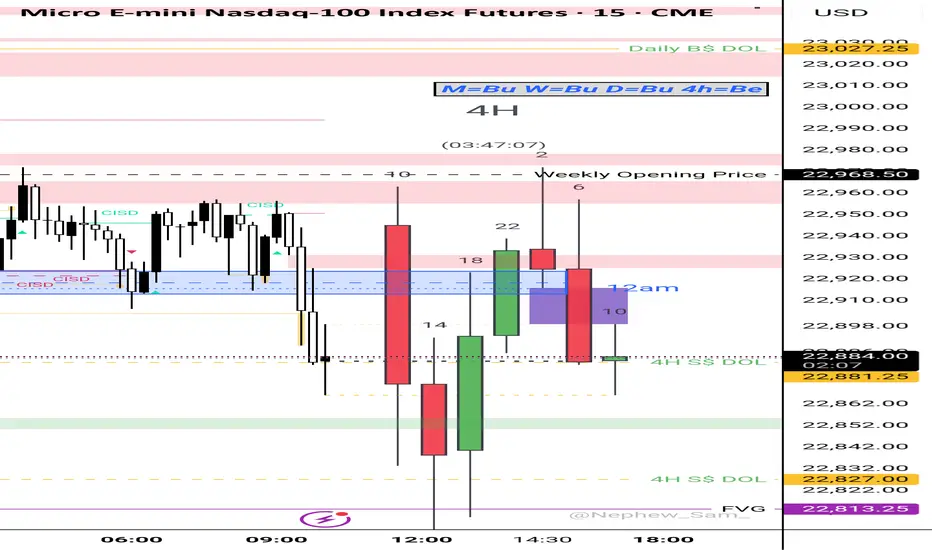
10a4h PO3 Monthly Bias = Bullish
Weekly Bias = Bullish
Daily Bias = Bullish
4h PO3 Bias = Bearish
Entry = Sweep of 15m Liquidity or Tap of 15m SIBI > 3m -CISD > Retest of 3m -CISD OB
Stop = 1$ above 3m -CISD OB 👀
NQ Power Range Report with FIB Ext - 7/8/2025 SessionCME_MINI:NQU2025
- PR High: 22853.50
- PR Low: 22808.50
- NZ Spread: 100.5
No key scheduled economic events
Session Open Stats (As of 12:25 AM 7/8)
- Session Open ATR: 318.85
- Volume: 24K
- Open Int: 269K
- Trend Grade: Neutral
- From BA ATH: -0.8% (Rounded)
Key Levels (Rounded - Think of these as ranges)
- Long: 23239
- Mid: 21525
- Short: 20383
Keep in mind this is not speculation or a prediction. Only a report of the Power Range with Fib extensions for target hunting. Do your DD! You determine your risk tolerance. You are fully capable of making your own decisions.
BA: Back Adjusted
BuZ/BeZ: Bull Zone / Bear Zone
NZ: Neutral Zone

2025-07-07 - priceactiontds - daily update - nasdaqGood Evening and I hope you are well.
comment: Market is ignoring every risk under the sun because the US government is too incompetent to follow-through with their excrement show. Beyond me that we are staying up high. Got no better comment for you today.
current market cycle: bull trend
key levels: 22500 - 23100
bull case: As long as bulls stay comfortably above 22500, they are fine and sideways is a very bullish correction for them. Bears are certainly not doing much, so bulls buy every dip and the chances of a new ath are there since we are very close to it.
Invalidation is below 22500.
bear case: Bears are just not doing enough. Markets have every reason to sell hard but they don’t. Unless we see big 1h bear bars closing on their low with follow-through selling, we can not expect lower prices. We need gaps but all bears get are huge reversal bars. Below 22500 things would look better for them but for now it’s very unlikely. It’s certainly a start that we closed a 4h bar below the 4h 20ema and below last week’s close but unless we make lower lows, it does not mean much.
Invalidation is above 23100.
short term: Neutral.
medium-long term - Update from 2024-06-29: No change in plans. I expect 20000 to get hit over the next 3 months and maybe 19000 again.
trade of the day: Scalping both sides since we had many alternating bars and prominent tails.
Continuation of sellside idea MNQU2025There is potential for trade to reverse here since its taking quite a bit for it to move lower. If we fail to go lower here, It will most likely go to buyside liquidity's 1SD.

MNQU2025 Sell Idea Targetting 1SD from Asian LowsFollow this post for the result of the trade idea! Explained my bias in the video.

NQ Power Range Report with FIB Ext - 7/7/2025 SessionCME_MINI:NQU2025
- PR High: 23028.50
- PR Low: 22943.00
- NZ Spread: 191.25
No key scheduled economic events
First full trading day following long holiday weekend
Session Open Stats (As of 12:45 AM 7/7)
- Session Open ATR: 323.71
- Volume: 33K
- Open Int: 271K
- Trend Grade: Neutral
- From BA ATH: -0.6% (Rounded)
Key Levels (Rounded - Think of these as ranges)
- Long: 23239
- Mid: 21525
- Short: 20383
Keep in mind this is not speculation or a prediction. Only a report of the Power Range with Fib extensions for target hunting. Do your DD! You determine your risk tolerance. You are fully capable of making your own decisions.
BA: Back Adjusted
BuZ/BeZ: Bull Zone / Bear Zone
NZ: Neutral Zone

Is the correction over? in the NasdaqPlotted the possible moves in the Nasdaq to explore the next target levels for support and resistance

#202527 - priceactiontds - weekly update - nasdaq
Good Day and I hope you are well.
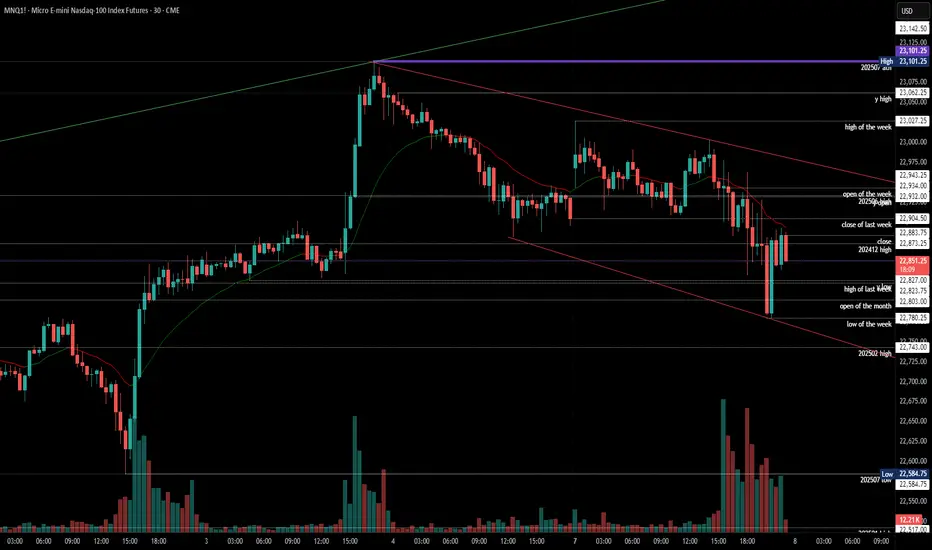
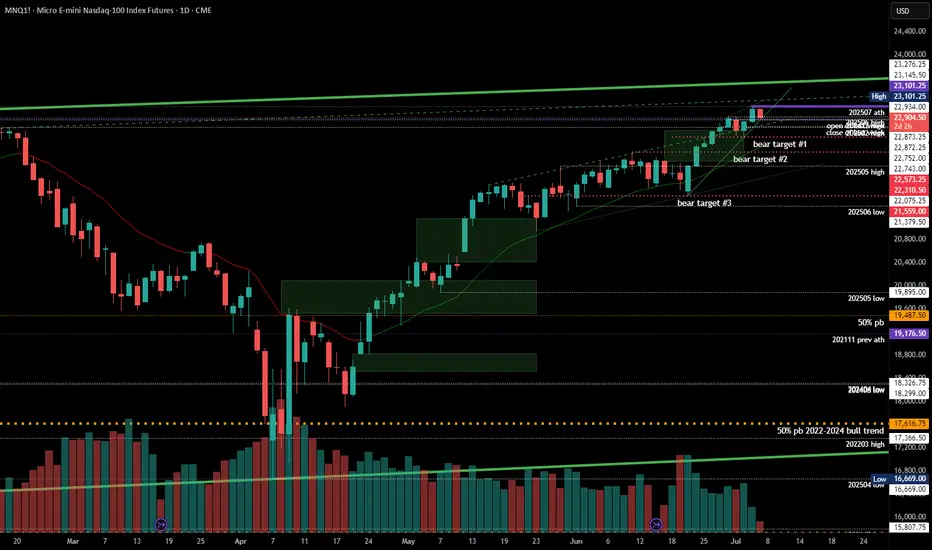
comment: Neutral. Chart is still max bullish but I have no more targets above and I’m fine with this going without me. Below 22600 I will start looking for lower targets. Until then best bears can get is sideways around 23000 but we will get a big move Monday/Tuesday once we have an answer on the US-EU tariff shit show. A good start for the bears is any price below 22584.
current market cycle: resumption of the bull trend but likely the final flag and we most likely will top out here around/under 23000
key levels for next week: 22000 - 23000
bull case: Bulls obviously still in full control. 2 bear bars out of the past 9 is a strong bull trend. Until we see much bigger selling pressure, technically we can only expect higher prices. Bulls broke above the bull channel from 21000 late may and confirmed the breakout now. The issues against the bulls are also the same arguments as for them. It’s overbought, climactic and very very late in the trend. This strong selling this late is something that usually happens before we turn,
Invalidation is below 22600
bear case: Just to make this clear again, bears have nothing right now. This chart is as bullish as it gets, that is why you can not look to short this yet. With that disclaimer, I also think it’s a bad buy. We are beyond overbought on many many economic indicators worsening and this trend is trying to accelerate. This is the time where weak/late bulls come around with the “this time it’s different” and "valuations don’t matter. We will again sell off big time this year but it’s stupid to trying to pick the top here.
Invalidation is above 23200 (any number I write here is stupid because it’s top picking. It could easily go to 23500 given the strength of this move)
short term: Neutral. No interest in buying but too early for shorts. Let’s see what the US-EU trade “talks” bring next week.
medium-long term - Update from 2024-06-29: No change in plans. I expect 20000 to get hit over the next 3 months and maybe 19000 again.
Preventing Holiday Schedule Glitches in Automated Futures Trade
Yesterday the market closed at 1:00 PM, and I still had two open positions. Normally my algorithm sends an “exit all” signal at 3:59 PM EST to close every futures contract, but it didn’t account for the holiday schedule. That glitch cost me $5,000 in just a few hours. Lesson learned.

Live Market Walkthrough Emini Nasdaq 100Outlined the orderflow distribution and trading All time highs

NQ: 216th trading session - recapA B-tier setup can become an A-tier or even sometimes an S-tier setup if price just is in a untapped zone. Of course we shouldn't ignore other confluecnes but that's one of the few I almost always rely on completely

10a4h PO3 $MNQ 10a4h PO3:
Weekly Bias = Bullish. Liquidity Targets hit. Projection Targets still in play.
Daily Bias = Bullish. Liquidity target hit.
4h Candle Closure Bias = Bullish
Structural Bias = Bullish
Waiting for 15m Liquidity Sweep or Tap into 15m BISI
Entry = 3m +CISD
Partial = 2R
Runner = 4h -2 STDV (21,562 to 22,130.75)

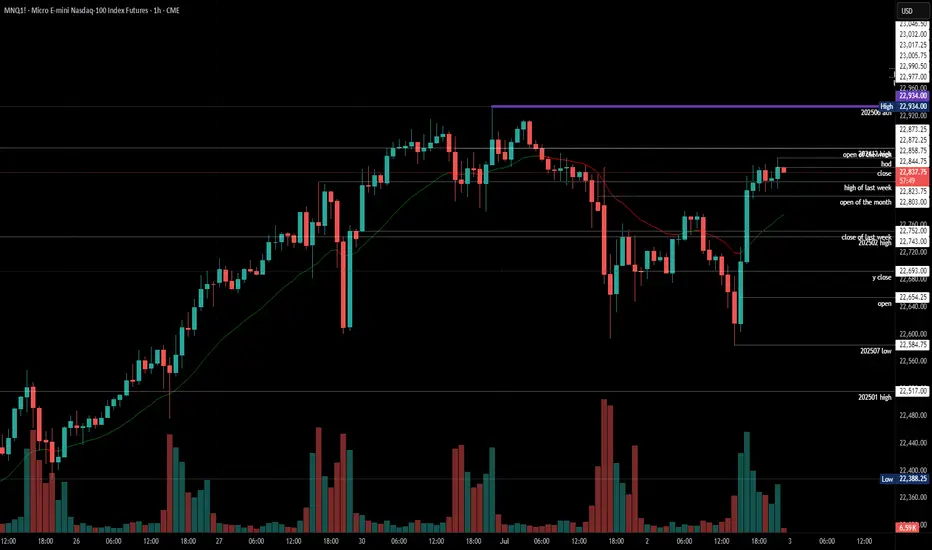
NQ Futures Explosive Breakout! Will It Hit 23,400? 1. Market Context
Timeframe: Daily chart from June 26 to July 4, 2025, with data current as of 09:29 AM EDT, July 3, 2025.
Trend: The price has been in an uptrend, breaking above 22,600.00 and approaching resistance near 22,915.00-23,000.00, consistent with recent bullish momentum in NQ futures (TradingView, CME Group).
2. Key Levels
Support: Immediate support at 22,600.00-22,700.00, where moving averages and prior consolidation align. A deeper support lies around 22,400.00 (lower trendline).
Resistance: Key resistance at 22,915.00, with a potential target at 23,000.00. A break above could aim for 23,200.00-23,400.00 (Fibonacci levels from web sources).
Stop Loss: Place below support (e.g., 22,580.00) to protect against a reversal.
Take Profit: Target 23,000.00 initially, with an extended goal at 23,400.00 if momentum holds.
3. Technical Indicators
Candlestick Patterns: Green candles near 22,915.00 suggest buying pressure, but red candles and dojis indicate potential indecision or rejection at resistance.
Volume: At 31.54K, volume is moderate. A spike on a breakout would confirm strength; a decline might signal exhaustion.
Moving Averages: The chart shows multiple MAs (e.g., 50-day, 200-day). Price above these supports the uptrend; a cross below could signal a shift.
4. Trade Plan
Entry: Enter long near 22,900.00 if consolidation holds, or on a breakout above 22,915.00 with volume confirmation.
Risk-Reward Ratio: Aim for 1:2 (e.g., risk 20 points to gain 40 points toward 23,000.00, or 400 points toward 23,400.00).
Position Sizing: Base on your account size and 1-2% risk per trade, considering NQ’s $20 multiplier per point.
Exit Strategy: Take partial profits at 23,000.00 and trail the rest, or exit fully if resistance holds.
5. Risk Management
Volatility: NQ’s recent range (22,400.00-22,915.00) suggests moderate volatility. Use tight stops due to potential news-driven moves.
News/Event Risk: Monitor Fed statements or tech earnings (key NQ drivers per CME Group) scheduled around July 3-4, 2025.
6. Scenario Analysis
Bullish Case: A break above 22,915.00 with strong volume could push NQ to 23,200.00-23,400.00, aligning with Fibonacci targets (TradingView).
Bearish Case: Rejection at 22,915.00 with a red candle might drop to 22,600.00-22,700.00. Cut losses if support fails.
NQ: 215th trading session - recapWasn't too locked in yesterday. Idk why, but I should definitely work on myself on that part.
I will be today, I'll make sure the caffeine hits diff
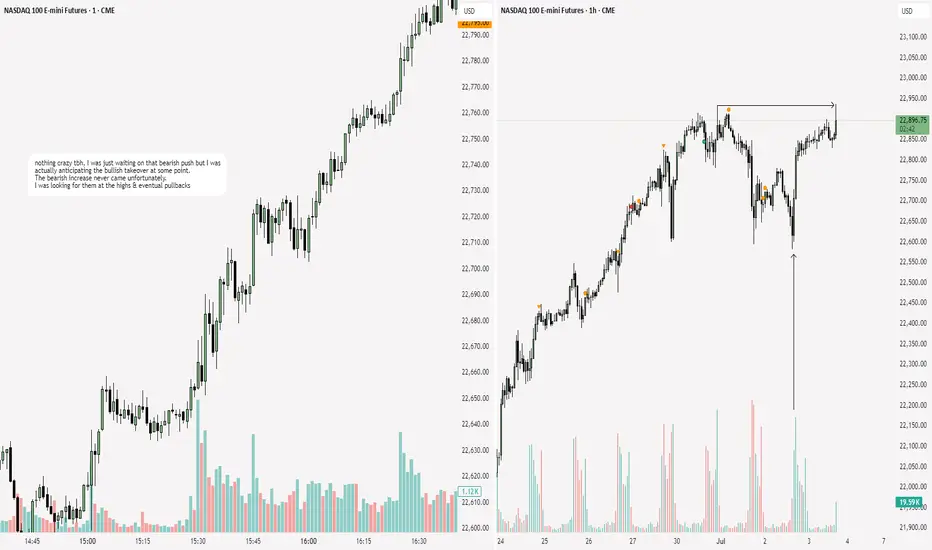
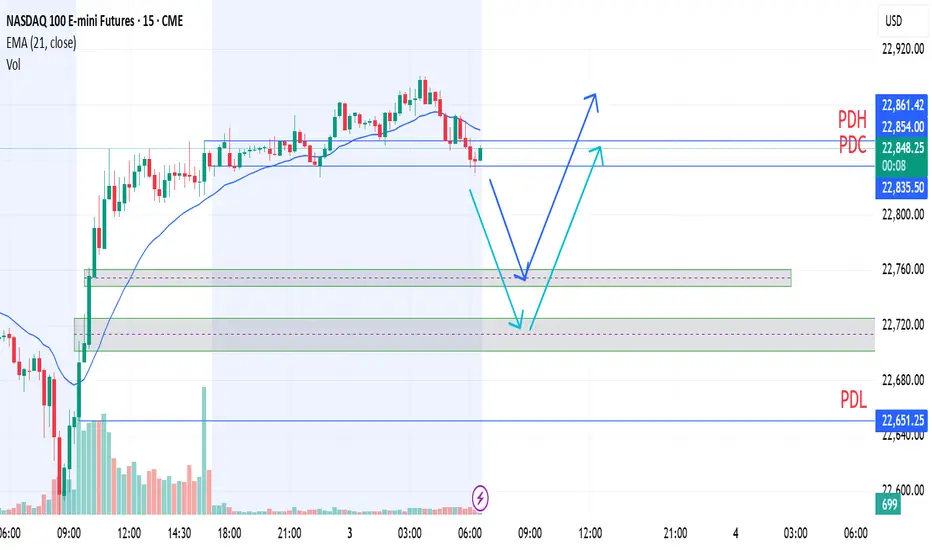
NQ expectations for todayToday I expect to pull back in on of these two demand zones.
Due to news maybe to a higher timeframe demand zone even lower.
After that I expect a solid and impulsive move to the upside.
2025-07-02 - priceactiontds - daily update - nasdaqGood Evening and I hope you are well.
comment: Big down, big up. Clear trading range. Play it until broken.
current market cycle: bull trend on higher tf but trading range on the 1h tf
key levels: 22500 - 23000
bull case: Bulls want 23000. Nothing changed. Bulls buy every dip below 22670 and until that stops, we stay at the highs and chances of higher prices are greater than a deeper pullback. I have no targets above 23000 though.
Invalidation is below 22500.
bear case: Bears not doing enough and have to scalp out or their profits disappear. They need a strong 1h close below 22500 for more downside but for now markets are continuing to ignore every bad news and the structure is as bullish as it gets on the daily tf. Bears are barely making money, so try to look for easy longs.
Invalidation is above 23200.
short term: Neutral but I still expect 23000 to get hit and maybe some more squeeze above. Zero interest in shorts and longs only for scalps and small. It’s still overbought and a deeper pullback is expected over the next days.
medium-long term - Update from 2024-06-29: No change in plans. I expect 20000 to get hit over the next 3 months and maybe 19000 again.
trade of the day: Longs below 22670 have been amazing since Friday.
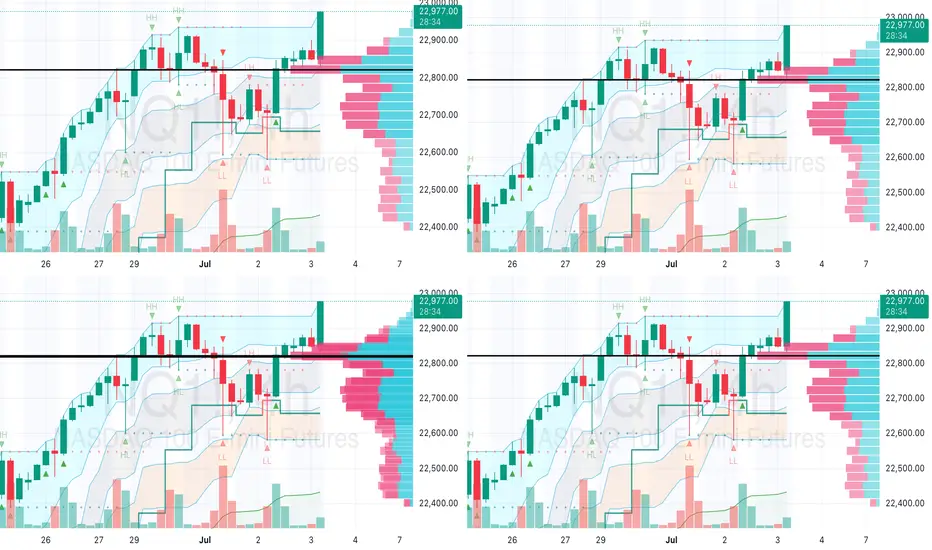
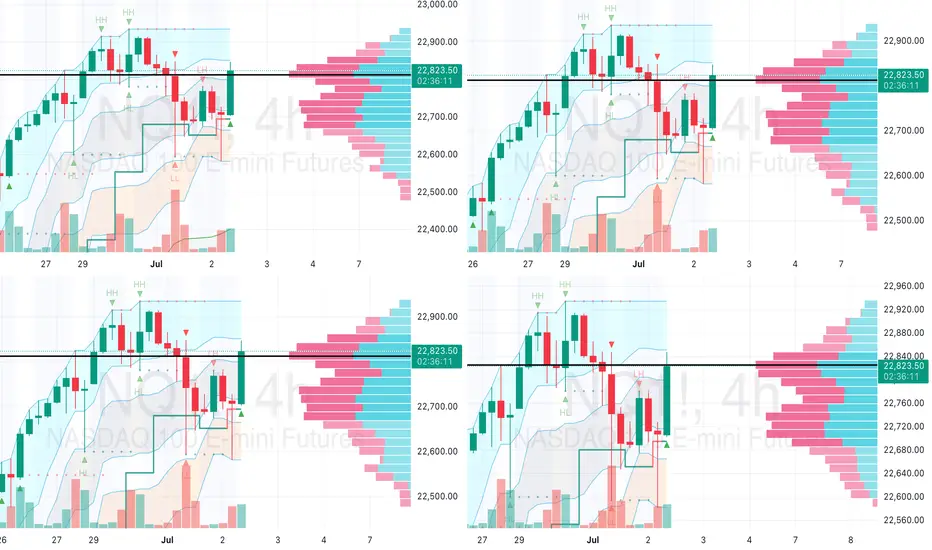
NQ (NASDAQ 100 E-Mini Futures) Market AnalysisKey Observations
The NQ is currently trading at 22,706.50, with a high of 22,847.50 and a low of 22,702.75, based on the 4-hour chart provided, timestamped at 11:22:26 UTC (7:22:26 AM EDT).
The price has pulled back from a recent high of 22,829.00 (recorded at 02:37:34) and is testing support near 22,700–22,720.
The market shows a short-term consolidation after a strong upward move, with potential for further direction depending on upcoming economic data.
Technical Analysis
Price Action: The chart displays a series of higher highs and higher lows since late June, indicating an overall uptrend. However, the recent red candles and rejection at 22,829.00 suggest a possible short-term reversal or pause. The current level of 22,706.50 is near a support zone marked by previous consolidation.
Volume Profile: The right-hand volume profile highlights high volume nodes (HVNs) between 22,700 and 22,829, with the point of control (POC) around 22,829.00. The pink bars (selling volume) dominate above 22,829, indicating strong resistance, while teal bars (buying volume) are concentrated around 22,700–22,720, suggesting a support area.
Support and Resistance:
Support: 22,700–22,720 (current level and volume-based support), with deeper support at 22,600–22,650 if the price breaks lower.
Resistance: 22,829.00 (recent high and POC), with a psychological barrier at 23,000 if bullish momentum resumes.
Indicators: The Market Profile (e.g., HH, HL, LH, LL) shows a value area narrowing near 22,700–22,829, indicating indecision. The presence of multiple timeframes (4-hour) suggests this is a key level for swing traders.
Market Context
The pullback aligns with recent economic data, including the June 2025 ADP employment report (released July 02), which reported a loss of 33,000 jobs, below the expected 100,000. This could signal economic slowdown, impacting tech-heavy indices like the NASDAQ 100.
Negative sentiment around Tesla, a significant NQ component, due to an Elon Musk-Donald Trump incident, may be contributing to the pressure.
The Nonfarm Payrolls report on July 03, 2025, is a critical upcoming event. A weaker result (forecasted at 110,000 jobs) could exacerbate selling, while a strong report might support a recovery.
Scenarios
Bullish Case: If the price holds above 22,700 and breaks 22,829 with increased buying volume, it could target 23,000. Look for a strong bullish candle to confirm.
Bearish Case: A break below 22,700 could see the price drop to 22,600–22,650, with further downside possible if selling intensifies.
Volatility: Expect increased volatility ahead of the Nonfarm Payrolls data, given its potential to sway market direction.
This is a Wyckoff VSA Shakeout and Test with Alert In this short video Author and Fund Manager, Gavin Holmes, reveals two key set ups based on the Richard D Wyckoff and Volume Spread Analysis trading strategy based on supply and demand, cause and effect and effort versus result. We have posted detailed TradingView charts at www.tradetowin.com and you can get your questions answered from there.
