MNQ1! trade ideas

DOWN MOVE IN STOCKS OVER?Good Sunday evening traders. We are off to the races. My daily chart shows the MNQ quo vadis last week and from 2 / 20 down move. Accurate Swing Trading System by Ceyhun held the market on Friday past. Let's see if these recent lows can hold or NOT . Donde vamos?

#202511 - priceactiontds - weekly update - nasdaq e-mini futuresGood Evening and I hope you are well.
comment: Let’s take this from the weekly chart. Market has not dipped below the 2024-09 low but that was way too much to expect for bears. 14% down in 4 weeks straight selling is beyond unsustainable but it’s also very very unlikely that this was it and we just go up again. My thesis is a new bear trend until proven otherwise. How would bulls do that? Anything above 21100 would be too high for a retracement in a strong bear trend and it would likely fit a trading range narrative. Trading range would mean 2024-04 low at 17900 to 2024-12 ath at 22450. Bear trend is drawn on the chart and would lead to at least the 50% retracement of this bull trend since 2022, down to around 17500. When will we know? If market retraces below or to the 50% around 20400 and strongly reverses down again, I see my theory confirmed so far. For next week I can’t see anything but a big short squeeze to trap late bears. 19140 was such a weird place to reverse and I can only see this already being strong bulls buying the dip and trapping everyone who thought we were going for 19000.
current market cycle: strong bear trend but pullback expected
key levels: 19140 - 20500
bull case: Bulls have only going for them that this selling is beyond overdone and climactic and Friday' was a very strong bullish day on huge volume. My bear target was 19600 and we almost printed 19000. 20000 is the first obvious target for a pullback but I think a 50% retracement to 20700 is doable, since the daily 20ema is also at 20400. I expect the market to fight the real battle for either the new bear trend or a multi-year trading range around 20000.
Invalidation is below 19100.
bear case: Bears showed more strength and got below my measured move target of 19600 but failed above the 2024-09 low at 18867. Last time bears made this much money was 2024-07 where we corrected for 16.91% to then rally 25.59% higher over the next 19 weeks. Hand on heart I do think it’s much more likely we will see that pattern from 2024 repeated than a new bear trend. A trading range 19000 - 22450 is much more likely than going down to 16000. As of now. Can this change if the US really goes into a bigger recession? Of course but for now this is front-running the possible risk because we got up so much the past years that funds really need to secure some profits this time. For next week I have absolutely nothing for the bears. This selling is overdone and market is so much more likely to squeeze late bears, that I won’t look for any short trades until we see 20000 or higher.
Invalidation is above 21100.
short term: Heavy bullish bias for 20000 and likely 20400. Above 20500 air would get real thin again, if this was the start of a bear market. For now I think the pattern from 2024-07 is more likely to repeat than the bear trend as drawn on the chart.
medium-long term - Update from 2024-03-16: My most bearish target for 2025 was 17500ish, given in my year-end special. We don’t know if we have printed the W1 of the new bear trend or repeat the pattern from 2024, where we sold of very strong to reverse even more strongly and make new all time highs. Market needs a bounce and around 20000/20500 we will see the real battle for the next weeks.
current swing trade: None
chart update: Updated the possible bear trend and added a bullish alternative to show what we did in 2024. For now the bullish path is more likely.

NQ and ES Weekly thought processExpecting bullish movement on NQ and ES. FOMC next week. Monday and Tuesday could be volatile but need to avoid tuesday at all cost

Nasdaq (March Contract) - Massive Meltdown!Stocks have had a rough week as uncertainty over President Donald Trump's tariff shifts whipsawed markets and overshadowed otherwise encouraging signals about the economy.
With 4 continuous weeks of bearish price action, it does not look like there is a end in sight. Sellside liquidity @ 20248.75 has not been used as a form of resistance, indicating weakness in the markets.
Going forward, my bias is neutral going into Sundays opening price

BTC weekly ReviewCurrently neutral but want bullish prices on BTC. Current fractal seems bullish on the weekly

idea on a chartNasdaq index in correction territory, many investors are trying to decide if it's a buying opportunity or if they should run for the hills. A correction is marked by an index declining 10% from its all-time high, which isn't quite as severe as a bear market. Additionally, stocks aren't necessarily a blanket buy or sell right now. Instead, I think there are certain ones that look like great bargains and others that still seem overvalued.

Technical analysis
Here is a more detailed approach. I'm focused on buying cheap stocks that could follows QQQ on this potential reversal.

Do we rally from here?
Word of day: Tariffs. As we all know the market entered correction territory. Now it is confirmed; The reason why investors were sitting with huge pile of cash. Now to the point, why do i think we rally from here? From a fundamental point of view the economy it's setup for a BOOM. From lower energy prices, lower taxes, D.O.G.E (Getting rid of wasteful spendings), tariffs (which makes our country rich), deregulations, To top 100 companies investing billions of dollars in the U.S (They will pay U.S taxes and add thousands of jobs) And when the president of the U.S openly tells wall street to invest in the U.S we shouldn't take that lightly. I mean... only a few short weeks in office we are already seeing result when it comes to lower inflation, lower egg prices, and gas prices. In my opinion, this puts Jerome Powell in a position were he will be forced to lower interest rates. Now from a technical perspective, we can see how the NQH5 found support at this FVG, now of course we are probably ranging due to FOMC meeting 7 days from now which is typical for the markets to consolidate ahead of the fed's decision. But see how everything aligns with a bullish bias (Too many confluences) Fundamental: Bullish, Technical: Bullish , Sentiment: OPTIMISIMS.

What's Next for Tech ?This is just a quick weekend analysis to help understand what's going on on the chart and prepare for what may come next.
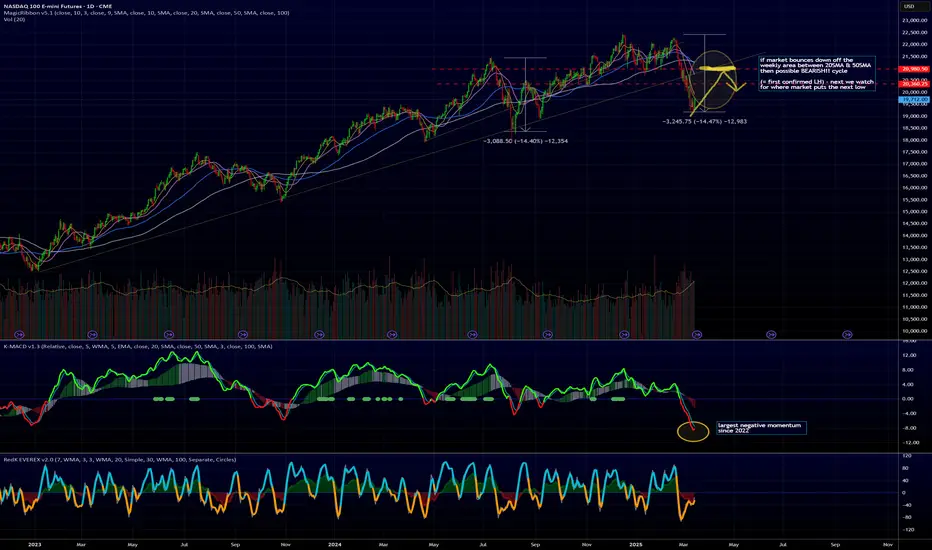
So many tech investors got caught by a fast and vicious correction (slightly exceeding -14% from recent top) - Traders should have got out of the market earlier once the prior low / support was broken, but maybe it's not too late.
there's a very interesting confluence area where many MA's (20, 50, 100) converge with the trend line of previous bottoms. so we expect a possible market reaction around that area - if it acts as resistance and we bounce off of it - so that's a new "Lower High" (that's our next chance to get out, or get some hedging in place), we then look at where the market puts the next low - we're between repeating the pattern from Aug/Sep 2024 - or a continuation down for a confirmed bear cycle.
one assumption here is that we actually bounce up off the current closing from last week - on positive geopolitical news -that may not happen and this view becomes obsolete.
Note: these are just thoughts and the analysis i will use to drive my trading in the next few weeks. Please do your own research - if you agree or disagree, i'd love to hear / read your thoughts.
$NQ IdeaOn the monthly chart, NQ maintains its bullish structure, confirming an uptrend. However, in recent weeks, the price has undergone a correction, pulling back to an equilibrium zone before potentially resuming its predominant upward movement. We can see that the price is holding at the Mean Threshold of a monthly rejection block, while also forming an SMT on swing lows with ES and YM on the weekly chart.
Since we trade on an intraday basis, it is essential to analyze multiple timeframes to confirm our bias. On the weekly chart, last week's candle swept the previous week's low and closed below the range. However, given the presence of an SMT at the lows, it is unlikely that the price will target the PWL (Previous Week Low). Instead, a correction toward a discounted area on H4 could occur before the bullish movement begins.
This scenario makes sense because the H4 chart has engineered liquidity in a premium zone, and the price is still trading within that area. Furthermore, last week's shift in market structure confirmed a bullish bias on H4, but before resuming the uptrend, we might see a sell-off to clear liquidity, as the price remains in a premium zone on H4.
Based on the economic calendar, there is a possibility that the weekly low will be formed on Monday, creating an opportunity for a counter-trend trade early in the week. However, this setup carries high risk, requiring caution and confirmation before entry.
For this week, we are looking for bullish opportunities toward equilibrium or until the price encounters resistance to continue rising. However, this outlook will be adjusted as price action unfolds throughout the week.
It is also worth noting that this will be a challenging week, due to a lack of major economic news and an upcoming Federal Reserve speech on interest rates, which could significantly impact the market and increase volatility.

March 1-15th 2025 (Profit & Loss)March Journal profit & loss posted.
I had to post as February was a red month.
However, I was able to come from a draw down in February to grow the account to this point.
Hope you enjoy the journey.

February trading statement (PROFIT & LOSS) :-(A snippet of my February trading journey!
The challenge i set for myself didn't quite pan out in the month of February.
In this video we have a display of my live trading account details for the month of February 2025!.
This is a personal journal and I will share the following month in a bit.

Short Idea on Nasdaq (NQ1!)- Stop loss : 22771.25
- Profit target : 20507.75
Based on seasonality,valuation, volume profile levels

MNQ!/NQ1! Day Trade Plan for 03/14/2025MNQ!/NQ1! Day Trade Plan for 03/14/2025
📈19570 19660
📉19380 19285
Like and share for more daily NQ levels 🤓📈📉🎯💰
*These levels are derived from comprehensive backtesting and research and a quantitative system demonstrating high accuracy. This statistical foundation suggests that price movements are likely to exceed initial estimates.*

NQ/MNQ Prediction 3/14/25 = +$5500 1 Contract If you're trading MNQ, Its 1/10th of the $$$.
Example: 1000 on NQ is 100 on MNQ. 😎🫡💰
$5525 within 2 hours (930-1125)…minimum😤🔥🫡
Levels are provided DAILY prior to market open. Like and follow for more insight 🫡💰🔥

How would you like.....to convidently enter trades knowing that you are almost certain
(well, only the fact that your live comes to an end someday is certain) of a breakeven trade.
Would that change your trading, mu guess is it would.

NQ Long (03-14-25)Wall Street will try and fix Washington Street's bad money manager (Your Fired). S/P at -10 and the NAZ was in front at -14% (from ATH). The NAZ will be used to help hold the it all together as we approach the true Danger Zone level (of NAZ and S/P). Look for the old Long side tricks to be played, starting with the Friday-Monday Long Rally and overnight weekend Gap Up. 19,200 and above is Long and below is Short. Look Long 1st and should the tricks not work, Strong Short it is.

$800 Profit in under 10 Minutes on NQ! Turned $800 Profit in Under 10 Minutes Trading NQ! 📈💰 Watch How It Happened! 👀🔥
Forex, Crypto and Futures Trading Risk Disclosure:
The National Futures Association (NFA) and Commodity Futures Trading Commission (CFTC), the regulatory agencies for the forex and futures markets in the United States, require that customers be informed about potential risks in trading these markets. If you do not fully understand the risks, please seek advice from an independent financial advisor before engaging in trading.
Trading forex and futures on margin carries a high level of risk and may not be suitable for all investors. The high degree of leverage can work against you as well as for you. Before deciding to trade, you should carefully consider your investment objectives, level of experience, and risk appetite.
There is a possibility of losing some or all of your initial investment, and therefore, you should not invest money that you cannot afford to lose. Be aware of the risks associated with leveraged trading and seek professional advice if necessary.
BDRipTrades Market Opinions (also applies to BDelCiel and Aligned & Wealthy LLC):
Any opinions, news, research, analysis, prices, or other information contained in my content (including live streams, videos, and posts) are provided as general market commentary only and do not constitute investment advice. BDRipTrades, BDelCiel, and Aligned & Wealthy LLC will not accept liability for any loss or damage, including but not limited to, any loss of profit, which may arise directly or indirectly from the use of or reliance on such information.
Accuracy of Information: The content I provide is subject to change at any time without notice and is intended solely for educational and informational purposes. While I strive for accuracy, I do not guarantee the completeness or reliability of any information. I am not responsible for any losses incurred due to reliance on any information shared through my platforms.
Government-Required Risk Disclaimer and Disclosure Statement:
CFTC RULE 4.41 - HYPOTHETICAL OR SIMULATED PERFORMANCE RESULTS HAVE CERTAIN LIMITATIONS. UNLIKE AN ACTUAL PERFORMANCE RECORD, SIMULATED RESULTS DO NOT REPRESENT ACTUAL TRADING. ALSO, SINCE THE TRADES HAVE NOT BEEN EXECUTED, THE RESULTS MAY HAVE UNDER-OR-OVER COMPENSATED FOR THE IMPACT, IF ANY, OF CERTAIN MARKET FACTORS, SUCH AS LACK OF LIQUIDITY. SIMULATED TRADING PROGRAMS IN GENERAL ARE ALSO SUBJECT TO THE FACT THAT THEY ARE DESIGNED WITH THE BENEFIT OF HINDSIGHT. NO REPRESENTATION IS BEING MADE THAT ANY ACCOUNT WILL OR IS LIKELY TO ACHIEVE PROFIT OR LOSSES SIMILAR TO THOSE SHOWN.
Performance results discussed in my content are hypothetical and subject to limitations. There are frequently sharp differences between hypothetical performance results and the actual results subsequently achieved by any particular trading strategy. One of the limitations of hypothetical trading results is that they do not account for real-world financial risk.
Furthermore, past performance of any trading system or strategy does not guarantee future results.
General Trading Disclaimer:
Trading in futures, forex, and other leveraged products involves substantial risk and is not appropriate for all investors.
Do not trade with money you cannot afford to lose.
I do not provide buy/sell signals, financial advice, or investment recommendations.
Any decisions you make based on my content are solely your responsibility.
By engaging with my content, including live streams, videos, educational materials, and any communication through my platforms, you acknowledge and accept that all trading decisions you make are at your own risk. BDRipTrades, BDelCiel, and Aligned & Wealthy LLC cannot and will not be held responsible for any trading losses you may incur.

Is ICT The Only One.....that can predict price movements and levels before hand?
Well meet theGhost in the Machine II, and the beauty is, i can teach you this without all the ego stuff, just plain 100% rules based.
Well, maybe i'm just lucky (all the time)

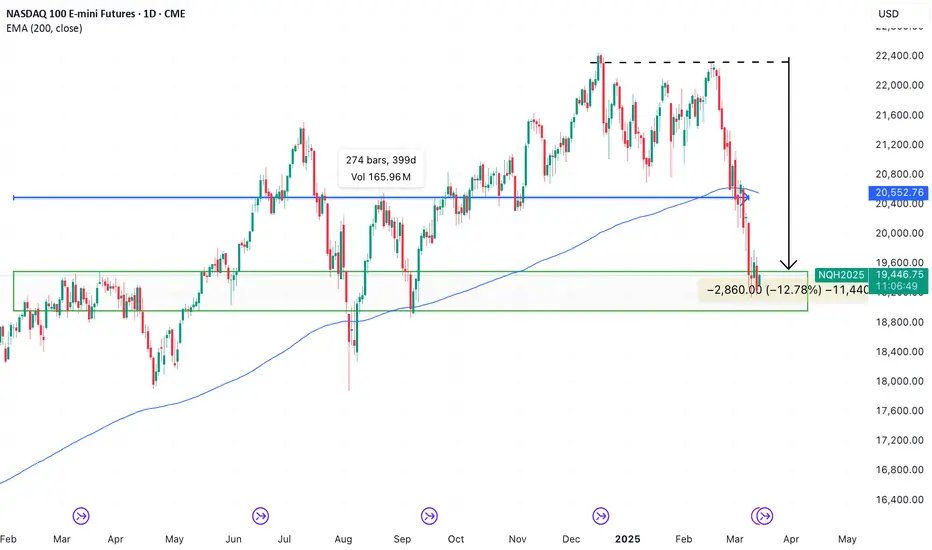
NASDAQ 100: Same Song, Different LyricsAfter a 12% pullback, NQ is retesting price levels from 400 days ago, and to many, it looks like a crash is coming. But what’s really driving the jitters?
1.Apple’s sales concerns & downgrades
2.Tariff fears (that haven’t even been imposed yet)
3.Doomsday takes on the U.S. economy
Sounds familiar? Same melody, just different words.
Yes, the stop is wide, but the profit target from here is at least 5X.
The question is—who sees an opportunity, and at what levels?
NQ ShortRejection of the 5m FVG with local highs as the Stop.
TP1 - Appx 45 pts - 50% retracement of the internal structure
TP2 - Appx 100 pts - 50% retracement of the swing structure
Need to see the algo's allow us to break the 1m 200 EMA first.

NQ Power Range Report with FIB Ext - 3/14/2025 SessionCME_MINI:NQH2025
- PR High: 19382.00
- PR Low: 19296.75
- NZ Spread: 190.75
No key scheduled economic events
Maintaining Tuesday's range, rotating back to Wednesday's lows
- Constant intraday swings has overall sentiment frustrated
Session Open Stats (As of 1:15 AM 3/14)
- Session Open ATR: 481.32
- Volume: 50K
- Open Int: 264K
- Trend Grade: Neutral
- From BA ATH: -13.5% (Rounded)
Key Levels (Rounded - Think of these as ranges)
- Long: 22667
- Mid: 21525
- Short: 19814
Keep in mind this is not speculation or a prediction. Only a report of the Power Range with Fib extensions for target hunting. Do your DD! You determine your risk tolerance. You are fully capable of making your own decisions.
BA: Back Adjusted
BuZ/BeZ: Bull Zone / Bear Zone
NZ: Neutral Zone
