NQ Long (03-13-25)Long at 3-4am in O/N, Long still Mopping out. Under Shaded Zone is strong Short and above is Long.
MNQ1! trade ideas

NQ: 155th trading session - recapAlso no trades today - I took 3 winning scalps but I don't post them on here (just yet, maybe in a few days I will)

NQ: 154th trading session - recapThis was yesterdays session, forgot to post it oopsies - no trades tho so it doesn't really matter

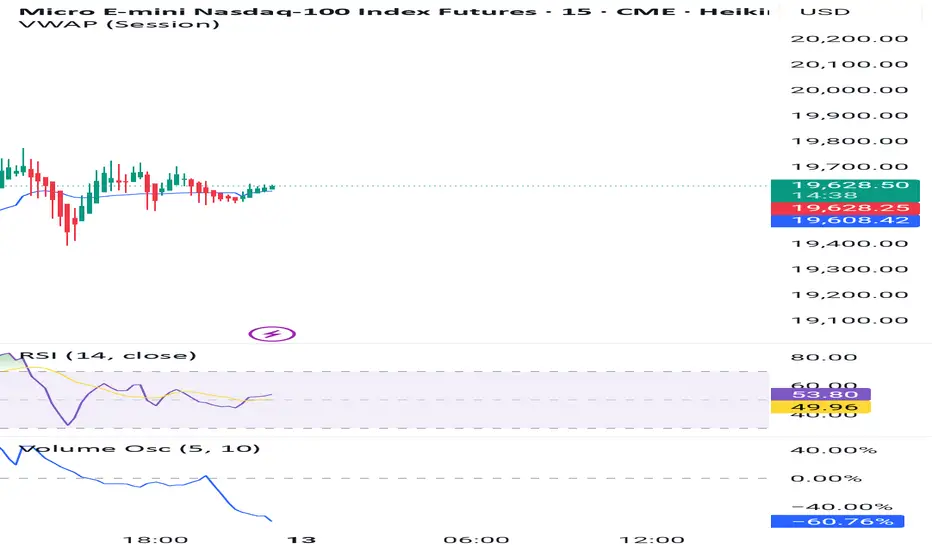
MNQ!/NQ1! Day Trade Plan for 03/13/2025MNQ!/NQ1! Day Trade Plan for 03/13/2025
📈19660 19760
📉19470 19380
Like and share for more daily NQ levels 🤓📈📉🎯💰
*These levels are derived from comprehensive backtesting and research and a quantitative system demonstrating high accuracy. This statistical foundation suggests that price movements are likely to exceed initial estimates.*

MNQ!/NQ1! Day Trade Plan for 03/12/2025MNQ!/NQ1! Day Trade Plan for 03/12/2025
📈19760 19850
📉19570 19475
Like and share for more daily NQ levels 🤓📈📉🎯💰
*These levels are derived from comprehensive backtesting and research and a quantitative system demonstrating high accuracy. This statistical foundation suggests that price movements are likely to exceed initial estimates.*

Markets Seeing Strength Over the last few weeks, traders have seen consistent selling pressure across equity markets, and today we are seeing buyers step in and the markets are moving higher. On the day, the equity indices, Gold, Silver and Crude Oil are seeing higher prices as traders saw CPI come in worse than expected and Crude Inventories came in better than expected. The NQ contract led the gains for the indices being up over 1% and Silver trading up near 1%% on the session.
The CME Fed Watch Tool has been fluctuating over the past few weeks as the equity markets have been selling off, and is now pricing in a pause for the March and May meetings. To finish out the week, economic data including initial jobless claims, PPI, and Bond Auction data will be on the front of traders' minds to see if the selling will continue in equities or if buyers will be confident to step into the market.
If you have futures in your trading portfolio, you can check out on CME Group data plans available that suit your trading needs tradingview.com/cme/
*CME Group futures are not suitable for all investors and involve the risk of loss. Copyright © 2023 CME Group Inc.
**All examples in this report are hypothetical interpretations of situations and are used for explanation purposes only. The views in this report reflect solely those of the author and not necessarily those of CME Group or its affiliated institutions. This report and the information herein should not be considered investment advice or the results of actual market experience.

Nasdaq Daily Trade Setups 13/03/25In this update we review the recent price action in the emini Nasdaq and identify the next high probability trading opportunities and price objectives to target. To review today's video analysis, click here!

Quick 70 point scalp on NQShowing you guys a trade idea with my current thoughts on the market and price.
I will be busy today so that is all for me, taking my $370 dollars for the day and I am calling it.
Good luck and Good trading to anyone trading today!
Forex, Crypto and Futures Trading Risk Disclosure:
The National Futures Association (NFA) and Commodity Futures Trading Commission (CFTC), the regulatory agencies for the forex and futures markets in the United States, require that customers be informed about potential risks in trading these markets. If you do not fully understand the risks, please seek advice from an independent financial advisor before engaging in trading.
Trading forex and futures on margin carries a high level of risk and may not be suitable for all investors. The high degree of leverage can work against you as well as for you. Before deciding to trade, you should carefully consider your investment objectives, level of experience, and risk appetite.
There is a possibility of losing some or all of your initial investment, and therefore, you should not invest money that you cannot afford to lose. Be aware of the risks associated with leveraged trading and seek professional advice if necessary.
BDRipTrades Market Opinions (also applies to BDelCiel and Aligned & Wealthy LLC):
Any opinions, news, research, analysis, prices, or other information contained in my content (including live streams, videos, and posts) are provided as general market commentary only and do not constitute investment advice. BDRipTrades, BDelCiel, and Aligned & Wealthy LLC will not accept liability for any loss or damage, including but not limited to, any loss of profit, which may arise directly or indirectly from the use of or reliance on such information.
Accuracy of Information: The content I provide is subject to change at any time without notice and is intended solely for educational and informational purposes. While I strive for accuracy, I do not guarantee the completeness or reliability of any information. I am not responsible for any losses incurred due to reliance on any information shared through my platforms.
Government-Required Risk Disclaimer and Disclosure Statement:
CFTC RULE 4.41 - HYPOTHETICAL OR SIMULATED PERFORMANCE RESULTS HAVE CERTAIN LIMITATIONS. UNLIKE AN ACTUAL PERFORMANCE RECORD, SIMULATED RESULTS DO NOT REPRESENT ACTUAL TRADING. ALSO, SINCE THE TRADES HAVE NOT BEEN EXECUTED, THE RESULTS MAY HAVE UNDER-OR-OVER COMPENSATED FOR THE IMPACT, IF ANY, OF CERTAIN MARKET FACTORS, SUCH AS LACK OF LIQUIDITY. SIMULATED TRADING PROGRAMS IN GENERAL ARE ALSO SUBJECT TO THE FACT THAT THEY ARE DESIGNED WITH THE BENEFIT OF HINDSIGHT. NO REPRESENTATION IS BEING MADE THAT ANY ACCOUNT WILL OR IS LIKELY TO ACHIEVE PROFIT OR LOSSES SIMILAR TO THOSE SHOWN.
Performance results discussed in my content are hypothetical and subject to limitations. There are frequently sharp differences between hypothetical performance results and the actual results subsequently achieved by any particular trading strategy. One of the limitations of hypothetical trading results is that they do not account for real-world financial risk.
Furthermore, past performance of any trading system or strategy does not guarantee future results.
General Trading Disclaimer:
Trading in futures, forex, and other leveraged products involves substantial risk and is not appropriate for all investors.
Do not trade with money you cannot afford to lose.
I do not provide buy/sell signals, financial advice, or investment recommendations.
Any decisions you make based on my content are solely your responsibility.
By engaging with my content, including live streams, videos, educational materials, and any communication through my platforms, you acknowledge and accept that all trading decisions you make are at your own risk. BDRipTrades, BDelCiel, and Aligned & Wealthy LLC cannot and will not be held responsible for any trading losses you may incur.

NQ1! Morning Mark UP Hey yall! Mark up is done in 100R TF. Please wait to take this after the news at 8:30am EST. We have some unemployment claims and PPI coming through. As always I have marked up for the buy and sell I’m very neutral in this bc the NQ has went deep both ways when it opened back up yesterday. There was a strong ‘W’ formed for a possible bullish rally but went flat :(. Use your best judgment SL are wide at 120 pt and always practice risk management and stick to your trading plan! Good luck!!

NQ Down ChannelUS indices need to bust out of this down channel....
Rejected yesterday afternoon, and again this morning. We see what happens when the markets open.

NQ Power Range Report with FIB Ext - 3/13/2025 SessionCME_MINI:NQH2025
- PR High: 19637.25
- PR Low: 19567.50
- NZ Spread: 155.75
Key scheduled economic events:
08:30 | Initial Jobless Claims
- PPI
13:00 | 30-Year Bond Auction
AMP margins temporarily increased for tomorrow economic events
- Previous session closed as inside print
- Auction returning to previous session low (closed bullish)
- Advertising rotation back to Tuesday's lows
Session Open Stats (As of 12:55 AM 3/13)
- Session Open ATR: 484.58
- Volume: 37K
- Open Int: 280K
- Trend Grade: Neutral
- From BA ATH: -13.2% (Rounded)
Key Levels (Rounded - Think of these as ranges)
- Long: 22667
- Mid: 21525
- Short: 19814
Keep in mind this is not speculation or a prediction. Only a report of the Power Range with Fib extensions for target hunting. Do your DD! You determine your risk tolerance. You are fully capable of making your own decisions.
BA: Back Adjusted
BuZ/BeZ: Bull Zone / Bear Zone
NZ: Neutral Zone

US Market Reversal Emerged? This Week's Closing is CrucialThe final trading day of February. I always take the opportunity to analyze the monthly chart closely.
We saw an inverted hammer. From the cash chart, clearly, we can see the inverted hammer. Beyond that, it also appears to be a potential double top for the Nasdaq.
E-mini Nasdaq Futures & Options
Ticker: NQ
Minimum fluctuation:
0.25 index points = $5.00
Micro E-mini Nasdaq Futures & Options
Ticker: MNQ
Minimum fluctuation:
0.25 index points = $0.50
Disclaimer:
• What presented here is not a recommendation, please consult your licensed broker.
• Our mission is to create lateral thinking skills for every investor and trader, knowing when to take a calculated risk with market uncertainty and a bolder risk when opportunity arises.
CME Real-time Market Data help identify trading set-ups in real-time and express my market views. If you have futures in your trading portfolio, you can check out on CME Group data plans available that suit your trading needs tradingview.com/cme/
Trading the Micro: cmegroup.com/markets/microsuite.html

My Daily Bias is LowerToday I'm thinking we move lower and should be targeting yesterday's (today's at the time of writing this) low.

NQ Panic Sell into SupportNQ and the global markets have been getting destroyed on news of trump tariffs, inflation, as well as recession warnings. Although many of these issues are political and are being viewed with altering perspectives, we are approaching a major support level here at the anchored VWAP of the overall uptrend since the nasdaq sold off 17%.
Shorting the market here can be quite dangerous as there is a potential for support to hold, and continue the uptrend here.
Lets see how it plays out

History rep. itself? Whipsaw shakeout, emotional rollercoasterThis is an optimistic view of the recovery from the recent selloff.
Reasons for the optimistic bias:
- weak USDX helps exports
- low Crude helps manufacturing
- employment remains steady
- interbank interest rates are lower, liquidity is ample
- tariffs are noise, yet to see objectively based on data what they will do
Its less likely though that we have a clean V bounce, price rarely moves in straight lines specially on the way up. We are yet to see if the recent positive data sustains the bounce or the rally will be sold by people who bought the top and try to get out at a smaller loss before it gets worse (and it may). In any case there is another leg down wether one support level lower or starting to create the staircase upwards we will see. The timescale might drag out into longer consolidation before move up depending on data, but the next earnings cycle around mid-May could prove the growth scare wrong. The projections are based on a similar pattern last year scaled to current moves.

Expectations for PPI tomorrowMarch 13, 2025: Producer Price Index (PPI) Report & Market Outlook
PPI Overview: Inflation Trends & Market Impact
The Producer Price Index (PPI) measures the average change over time in the selling prices received by domestic producers for their output. It's a key indicator of inflation at the wholesale level, influencing consumer prices, monetary policy decisions, and financial markets.
Recent PPI Trends:
January 2025: PPI for final demand increased 0.4% MoM, following a 0.5% rise in December 2024. Year-over-year, PPI advanced 3.5% in January.
February 2025 Forecast: Analysts anticipate a 0.3% MoM increase, suggesting continued inflationary pressures.
PPI Data Breakdown: Expected vs. Actual (To Be Updated Post-Release)
Expected PPI (MoM): +0.3%
Expected PPI (YoY): +3.5%
Core PPI (Ex-Food & Energy, MoM): +0.2%
Core PPI (Ex-Food & Energy, YoY): +3.2%
Actual PPI Data: Pending release at 8:30 AM EST
Immediate Market Reaction (Post-Release Update Needed)
Stocks: S&P 500, Nasdaq, and Dow futures reaction.
Bonds: 10-Year Treasury yield movement.
Forex: USD reaction vs. EUR, JPY, and GBP.
Commodities: Gold, oil, and industrial metals response.
Sector-Specific Impacts
Growth Stocks (Tech & Discretionary): Higher PPI could trigger a sell-off if rate hike fears rise.
Defensive Stocks (Utilities & Consumer Staples): Likely to outperform in a high-inflation scenario.
Industrial & Energy Sectors: Higher input costs could pressure margins.
Financials: Banks may benefit if inflation keeps rates higher for longer.
Trading Strategies & Key Levels
S&P 500 Levels: Watching 4,800 support, 5,000 resistance.
Nasdaq: Tech stocks volatile above/below 16,000.
DXY (Dollar Index): Bullish above 105 if inflation exceeds expectations.
Gold: Strong resistance at $2,100; potential breakout if inflation data disappoints.
Bonds: 10-Year yield key level at 4.25%.
Macro & Fed Policy Implications
Hotter PPI (+0.4% or higher): Could delay Fed rate cuts, leading to risk-off sentiment.
Cooler PPI (+0.2% or lower): Could reinforce rate cut expectations, boosting risk assets.
Fed Watch: Next FOMC decision hinges on both PPI and CPI trends; traders should monitor Fed speakers post-release.
Considerations for Investors
Monitor Federal Reserve Signals: Any shift in rate-cut expectations will heavily impact market direction.
Sector Analysis: Industries with high input costs may experience increased volatility.
Inflationary Pressures: Rising PPI suggests consumer prices could also increase, influencing Fed decisions.
Conclusion
The March 13 PPI report will set the tone for upcoming Fed policy moves, market sentiment, and trading strategies leading into Q2. Stay alert for real-time updates post-release as market conditions evolve.

NQ Long (03-12-25)Staying with the Long and U Turn Pop up retest higher. Bigger move after Pop Stall out. Yesterday's Post Scalp trades in the range did show the build or positioning for a Long move next. Will update as we go, the BTD/FOMO's showing up from Spring Break but may be hungover so give then a day or so.

Increasing VolatilityExecutive Summary
Volatility in the E-mini S&P 500 (ES) futures market has risen significantly over the past two weeks, as evidenced by the upward trajectory of both the 10-period and 60-period SMA Historical Volatility (HV) metrics. This report analyzes the implications of heightened volatility on market participation and liquidity, while providing actionable strategies to leverage these conditions effectively.
Current Volatility Overview
Key Observations (March 3–13, 2025):
The 10-period SMA HV (10-minute) has surged from 0.075 to 0.225, reflecting rapid intraday price swings.
The 60-period SMA HV (60-minute) trended upward from 0.100 to 0.200, confirming a sustained volatility regime.
Divergence between the two SMAs indicates accelerating short-term volatility relative to the longer-term trend.
Drivers:
Macroeconomic uncertainty (e.g., geopolitical events, central bank policy shifts).
Earnings seasonality and sector rotation.
Algorithmic trading amplifying price movements.
Impact of Volatility on Market Dynamics
1. Market Participation
Increased Activity from Short-Term Traders:
Day traders and algo systems capitalize on wider price ranges and intraday momentum.
Scalping strategies thrive in choppy markets.
Reduced Long-Term Positioning:
Institutional investors may defer large orders to avoid slippage.
Risk-averse participants hedge via options or reduce exposure.
2. Liquidity Dynamics
Bid-Ask Spreads: Likely to widen as market makers price in risk, particularly during off-peak hours.
Slippage Risk: Elevated during high-volatility spikes (e.g., news events).
Liquidity Clustering: Focus on peak trading hours (e.g., NYSE open/close) where order book depth remains robust.
Strategic Recommendations for Traders
1. Adapt Position Sizing and Risk Management
Reduce position sizes to mitigate volatility-driven drawdowns.
Use dynamic stop-loss orders to protect against sudden reversals.
2. Leverage Volatility-Sensitive Instruments
Trade volatility derivatives (e.g., VIX futures, options) to hedge or speculate.
Implement straddle/strangle strategies ahead of scheduled catalysts (e.g., CPI reports).
3. Optimize Execution Timing
Focus on high-liquidity windows (e.g., 9:30–11:30 AM ET) to minimize slippage.
Avoid holding oversized positions into overnight sessions.
4. Monitor Key Technical Levels
Track the 10-period SMA HV for intraday momentum signals.
Use the 60-period SMA HV to identify broader trend reversals.
5. Stay Informed
Track real-time news feeds for unexpected catalysts.
Analyze volume profiles to distinguish between noise and meaningful price action.
Conclusion
The current volatility regime in ES futures presents both opportunities and risks. Traders who adjust their strategies to prioritize risk management, liquidity awareness, and tactical execution will be best positioned to capitalize on price dislocations. While short-term traders may thrive in this environment, long-term participants should remain cautious, using volatility as a tool for strategic entry/exit points rather than a deterrent.
Prepared by: Joshua C Dawson
Managing Director/ Oxley & Sinclair
Date: March 12, 2025

How to trade CPI?You don't! You wait till the storm is over then you just ping pong your way to riches ;-)
now who's TheGhost In The Machine ?

$2k in profits after this one trade on NQ!Give it a thumbs up if you guys liked this video!
Thank you for the support guys.

100 tick NQ trade, SL hit in profitsTargeting BSL and NY AM highs, but we were stopped out after taking the short term buyside.

NASDAQ I Weekly CLS, Daily CLS, KL - W Ob, Daily Ob model 1Hey Traders!!
Feel free to share your thoughts, charts, and questions in the comments below—I'm about fostering constructive, positive discussions!
Nasdaq seasonality suggests upside since march
🧩 What is CLS?
CLS represents the "smart money" across all markets. It brings together the capital from the largest investment and central banks, boasting a daily volume of over 6.5 trillion.
✅By understanding how CLS operates—its specific modes and timings—you gain a powerful edge with more precise entries and well-defined targets.
🛡️Follow me and take a closer look at Models 1 and 2.
These models are key to unlocking the market's potential and can guide you toward smarter trading decisions.
📍Remember, no strategy offers a 100%-win rate—trading is a journey of constant learning and improvement. While our approaches often yield strong profits, occasional setbacks are part of the process. Embrace every experience as an opportunity to refine your skills and grow.
Wishing you continued success on your trading journey. May this educational post inspire you to become an even better trader!
“Adapt what is useful, reject what is useless, and add what is specifically your own.”
Dave Hunter ⚔
