MNQ1! trade ideas
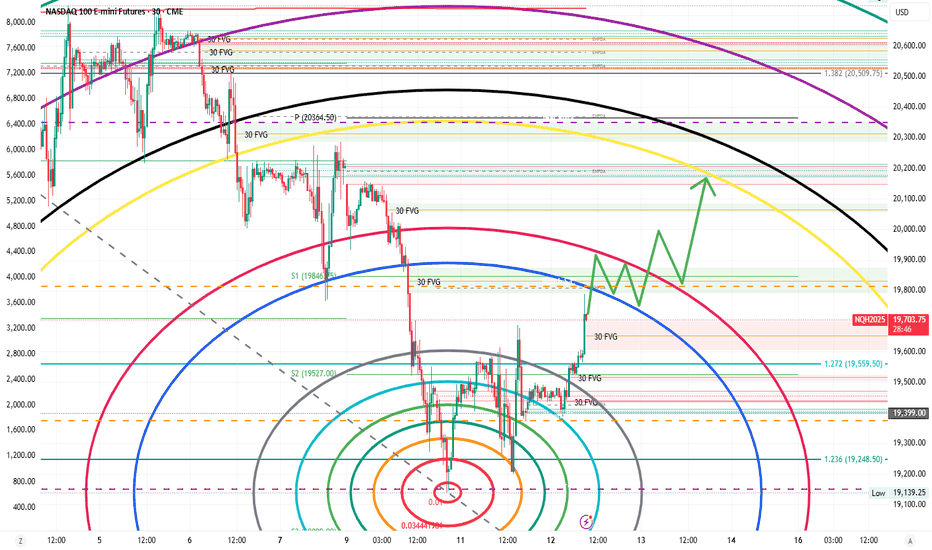
nq heading to top of long downward channel for a testprice is still under a break down trend line, just tested with cpi bounce. i believe it will continue to test that line or break above it to challenge the top of the channel. any good news will be a massive squeeze. there is a gap to fill at 20200ish, possible friday target for a relief rally.
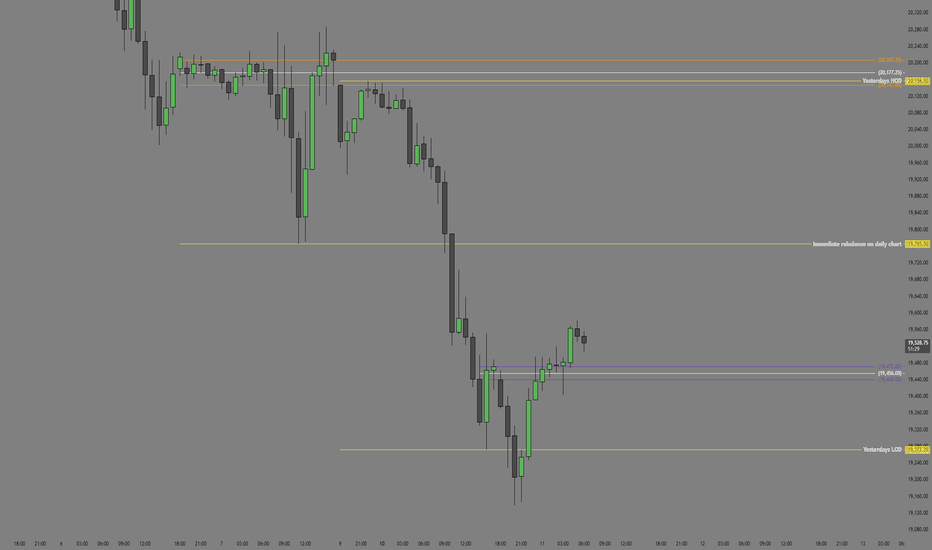
NAS Futures - LongsLooking for longs from this fib range off the 78.6 zone.
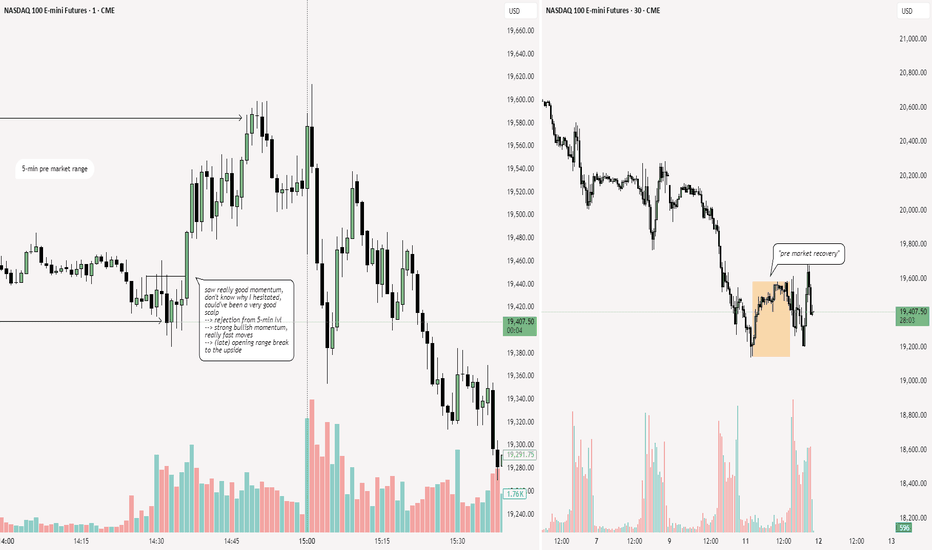
Targeting the immediate high from this 15m range to at least take partials because price can go higher.
Higher timeframe on daily I see that we could continue higher which is why I am playing the 15m trend building after visiting our Daily IPA.
Limit is set and we shall see how it turnes out. Let me know what yall think and follow to keep track of my journey.
CME_MINI:MNQ1!
NQ Power Range Report with FIB Ext - 3/12/2025 SessionCME_MINI:NQH2025
- PR High: 19479.75
- PR Low: 19399.25
- NZ Spread: 180.0
Key scheduled economic events:
08:30 | CPI (Core|YoY|MoM)
09:30 | Crude Oil Inventories
13:00 | 10-Year Note Auction
Previous session closed practically unchanged following wide value swings
- Auctions continues to hold Monday's lows
- Inventory low declined to 19200, advertising rotation above 19690
Session Open Stats (As of 12:35 AM 3/12)
- Session Open ATR: 482.56
- Volume: 30K
- Open Int: 292K
- Trend Grade: Neutral
- From BA ATH: -13.2% (Rounded)
Key Levels (Rounded - Think of these as ranges)
- Long: 22667
- Mid: 21525
- Short: 19814
Keep in mind this is not speculation or a prediction. Only a report of the Power Range with Fib extensions for target hunting. Do your DD! You determine your risk tolerance. You are fully capable of making your own decisions.
BA: Back Adjusted
BuZ/BeZ: Bull Zone / Bear Zone
NZ: Neutral Zone
MNQ!/NQ1! Day Trade Plan for 03/11/2025MNQ!/NQ1! Day Trade Plan for 03/11/2025
📈19470 19560
📉19380 19285
Like and share for more daily NQ levels 🤓📈📉🎯💰
*These levels are derived from comprehensive backtesting and research and a quantitative system demonstrating high accuracy. This statistical foundation suggests that price movements are likely to exceed initial estimates.*
MNQ!/NQ1! Day Trade Plan for 03/10/2025MNQ!/NQ1! Day Trade Plan for 03/10/2025
📈20040 20140
📉19760 19665
Like and share for more daily NQ levels 🤓📈📉🎯💰
*These levels are derived from comprehensive backtesting and research and a quantitative system demonstrating high accuracy. This statistical foundation suggests that price movements are likely to exceed initial estimates.*
Nasdaq (March 2025) - Aiming For Low Hanging FruitsAs we have seen a recent delivery through a higher timeframe Sellside liquidity pool @ 20248.75 as well as tagging the weekly bullish order block @ 20011.25 I am not really seeing any signatures on this timeframe to suggest that Nasdaq is bullish at the moment.
However, on the lower timeframes, there is a potential for Nasdaq to attack premium PD arrays before reversing and continuing it's bearish trend.
I want to see the highs for the week created by Wednesday latest.
Sunday gap opening will determine the likelihood of this bias delivering
NQ Long (03-11-25)NAZ is at U Turn #2 and third triangle Key Level. You would think we would see a bounce as we are 13% from ATH and 13% from 2024 Open Price. Follow KL's lower for support or look for any bounce 1st, then to stall and drop. NAZ has no strength and much of the prior strength (past few years) came in the O/N (overnight). BTD/FOMO's are on at the Tiki Bar on Spring Break. Just a classic pump/dump, they aren't even hiding it.
Fractality in Trading: the market’s hidden patternHave you ever noticed how price movements look similar across different timeframes? This is Fractality in Trading, a concept that suggests markets behave in repeating patterns regardless of scale.
In the chart above, we compare the 1-Day (left) vs. 1-Week (right) timeframe for NASDAQ 100 Futures. Despite the difference in time horizons, the price movements, corrections, and trend reversals mirror each other, following the same wave structures.
What Does This Mean for Traders?
✔️ Price Action Repeats Itself: Market cycles—uptrends, downtrends, and consolidations—occur in similar ways across different timeframes.
✔️ Multi-Timeframe Analysis (MTA): By analyzing a higher timeframe (1W), traders can identify key trends and use the lower timeframe (1D) for precision entries.
✔️ Scalability: Whether you are a swing trader, day trader, or long-term investor, the same patterns apply, making technical analysis universally effective.
Key Takeaway
Understanding fractality helps traders align their trades with the dominant trend, reducing false signals and improving trade confidence.
Do you use multi-timeframe analysis in your strategy? Let me know in the comments!
$1,000+ Profit on NQ with this one tradeGive this post a like and if we get it to 100 likes I will post on my YT the entry to this trade as well as an explanation as to why I entered here.
Forex, Crypto and Futures Trading Risk Disclosure:
The National Futures Association (NFA) and Commodity Futures Trading Commission (CFTC), the regulatory agencies for the forex and futures markets in the United States, require that customers be informed about potential risks in trading these markets. If you do not fully understand the risks, please seek advice from an independent financial advisor before engaging in trading.
Trading forex and futures on margin carries a high level of risk and may not be suitable for all investors. The high degree of leverage can work against you as well as for you. Before deciding to trade, you should carefully consider your investment objectives, level of experience, and risk appetite.
There is a possibility of losing some or all of your initial investment, and therefore, you should not invest money that you cannot afford to lose. Be aware of the risks associated with leveraged trading and seek professional advice if necessary.
BDRipTrades Market Opinions (also applies to BDelCiel and Aligned & Wealthy LLC):
Any opinions, news, research, analysis, prices, or other information contained in my content (including live streams, videos, and posts) are provided as general market commentary only and do not constitute investment advice. BDRipTrades, BDelCiel, and Aligned & Wealthy LLC will not accept liability for any loss or damage, including but not limited to, any loss of profit, which may arise directly or indirectly from the use of or reliance on such information.
Accuracy of Information: The content I provide is subject to change at any time without notice and is intended solely for educational and informational purposes. While I strive for accuracy, I do not guarantee the completeness or reliability of any information. I am not responsible for any losses incurred due to reliance on any information shared through my platforms.
Government-Required Risk Disclaimer and Disclosure Statement:
CFTC RULE 4.41 - HYPOTHETICAL OR SIMULATED PERFORMANCE RESULTS HAVE CERTAIN LIMITATIONS. UNLIKE AN ACTUAL PERFORMANCE RECORD, SIMULATED RESULTS DO NOT REPRESENT ACTUAL TRADING. ALSO, SINCE THE TRADES HAVE NOT BEEN EXECUTED, THE RESULTS MAY HAVE UNDER-OR-OVER COMPENSATED FOR THE IMPACT, IF ANY, OF CERTAIN MARKET FACTORS, SUCH AS LACK OF LIQUIDITY. SIMULATED TRADING PROGRAMS IN GENERAL ARE ALSO SUBJECT TO THE FACT THAT THEY ARE DESIGNED WITH THE BENEFIT OF HINDSIGHT. NO REPRESENTATION IS BEING MADE THAT ANY ACCOUNT WILL OR IS LIKELY TO ACHIEVE PROFIT OR LOSSES SIMILAR TO THOSE SHOWN.
Performance results discussed in my content are hypothetical and subject to limitations. There are frequently sharp differences between hypothetical performance results and the actual results subsequently achieved by any particular trading strategy. One of the limitations of hypothetical trading results is that they do not account for real-world financial risk.
Furthermore, past performance of any trading system or strategy does not guarantee future results.
General Trading Disclaimer:
Trading in futures, forex, and other leveraged products involves substantial risk and is not appropriate for all investors.
Do not trade with money you cannot afford to lose.
I do not provide buy/sell signals, financial advice, or investment recommendations.
Any decisions you make based on my content are solely your responsibility.
By engaging with my content, including live streams, videos, educational materials, and any communication through my platforms, you acknowledge and accept that all trading decisions you make are at your own risk. BDRipTrades, BDelCiel, and Aligned & Wealthy LLC cannot and will not be held responsible for any trading losses you may incur.
NQ Power Range Report with FIB Ext - 3/11/2025 SessionCME_MINI:NQH2025
- PR High: 19461.50
- PR Low: 19370.25
- NZ Spread: 204.0
Key scheduled economic events:
10:00 | JOLTS Job Openings
Value decline continues, finding 19200s inventory
- Advertising continued selling, keeping slight gap above previous session high open
- Holding auction above previous session close at the lows
Session Open Stats (As of 12:35 AM 3/11)
- Session Open ATR: 498.26
- Volume: 83K
- Open Int: 297K
- Trend Grade: Neutral
- From BA ATH: -13.2% (Rounded)
Key Levels (Rounded - Think of these as ranges)
- Long: 22667
- Mid: 21525
- Short: 19814
Keep in mind this is not speculation or a prediction. Only a report of the Power Range with Fib extensions for target hunting. Do your DD! You determine your risk tolerance. You are fully capable of making your own decisions.
BA: Back Adjusted
BuZ/BeZ: Bull Zone / Bear Zone
NZ: Neutral Zone


