NQ Holding Above Daily Highs – Trend Structure Intact📈 NASDAQ 100 (NQ) – Riding the Trend, Holding Above Key Daily Highs | 4H Chart
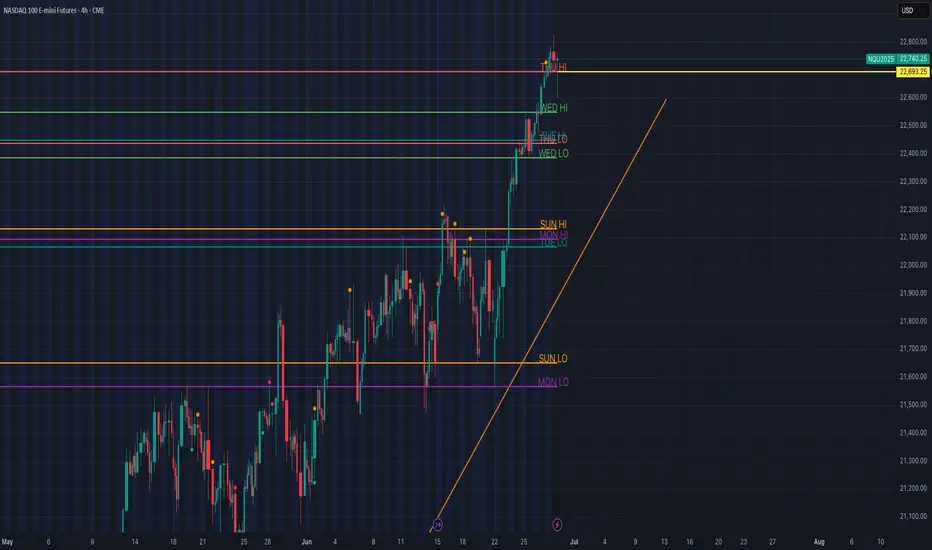
NQ remains in a strong uptrend, respecting structure and reclaiming key daily highs going into the final trading days of June.
🔍 Key Observations:
🔼 Price is currently holding above Thursday’s high: 22,740
✅ Strong support formed at Wednesday high: 22,693.25
🔁 Clean reclaim of Tuesday and Wednesday lows — confirming bullish pressure
🔸 Trendline from June 23 low continues to guide the rally
🗓️ Previous Day Levels Providing Structure:
SUN LO / MON LO (~21,550–21,650) → Base of the rally
JUNE 17–21: Price consolidated just below 22,400, forming resistance
JUNE 25: Breakout above Sun/Mon Highs confirmed expansion phase
🧠 Bias & Plan:
Bias: Bullish, as long as price remains above 22,693
🕵️♂️ Watch for reaction around 22,800–22,900 zone (potential exhaustion or continuation)
If we sweep Thursday’s high and shift structure → possible short-term pullback
📌 Summary:
NQ continues to honor the prior week’s highs as new support. The market is trending cleanly with structure, and as long as daily highs hold, the bullish case remains intact.
#NQ100 #NASDAQ #FuturesTrading #SmartMoney #MarketStructure #DailyLevels #PlaymakerTrades
MNQ1! trade ideas
NQ Short (06-24-25)Going with the recent pop as: Short Cover rally or Drop Offset. We may see a decent head fake long set up as some may start to exit (up here). Give it the week with the Friday-Monday Long move to change to Short Rip lower.

NQ: 211th trading session - recapYo if I'm late posting ever again god will need to punish me with 3 losses in a row istg. Took a loss, don't care it was a good setup
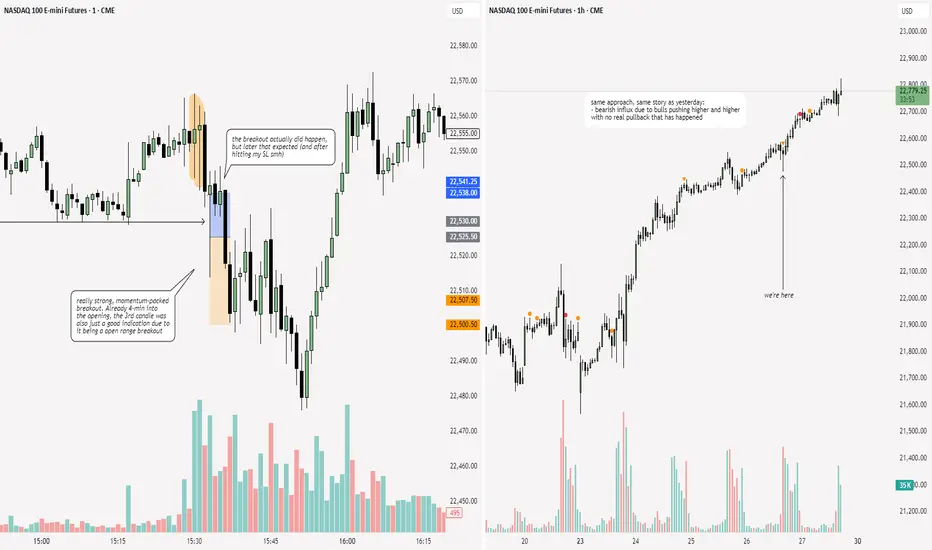
NQ Power Range Report with FIB Ext - 6/27/2025 SessionCME_MINI:NQU2025
- PR High: 22713.50
- PR Low: 22669.25
- NZ Spread: 98.75
Key scheduled economic events:
08:30 | Core PCE Price Index (YoY|MoM)
Session Open Stats (As of 12:35 AM 6/27)
- Session Open ATR: 348.99
- Volume: 21K
- Open Int: 260K
- Trend Grade: Neutral
- From BA ATH: -1.7% (Rounded)
Key Levels (Rounded - Think of these as ranges)
- Long: 23239
- Mid: 21525
- Short: 20383
Keep in mind this is not speculation or a prediction. Only a report of the Power Range with Fib extensions for target hunting. Do your DD! You determine your risk tolerance. You are fully capable of making your own decisions.
BA: Back Adjusted
BuZ/BeZ: Bull Zone / Bear Zone
NZ: Neutral Zone
Keep in mind this is not speculation or a prediction. Only a report of the Power Range with Fib extensions for target hunting. Do your DD! You determine your risk tolerance. You are fully capable of making your own decisions.
BA: Back Adjusted
BuZ/BeZ: Bull Zone / Bear Zone
NZ: Neutral Zone

Nasdaq: At the Upper EdgeYesterday, the Nasdaq climbed above resistance at 22,475 points. Currently, the index is positioned outside our turquoise Target Zone (coordinates: 21,751 – 22,425 points), which remains active. Stops for short positions 1% above the zone have not yet been triggered. Our primary scenario remains intact for now: technically, there is room for wave B to reach the next resistance at 23,229 points. Following the B-wave peak, a downtrend is expected with the corrective wave C. With a 42% probability, we anticipate that wave alt.(4) is already complete, and the index may break directly higher within the magenta-colored wave alt.(5), surpassing the 23,229-point mark.
📈 Over 190 precise analyses, clear entry points, and defined Target Zones - that's what we do.


NQ: 210th trading session - recapWow I actually took a trade for once. I'M LATE POSTING THIS AGAIN, had some stuff to do yesterday and I actually just forgot.
Won't happen again hopefully but my session today starts in 30min.
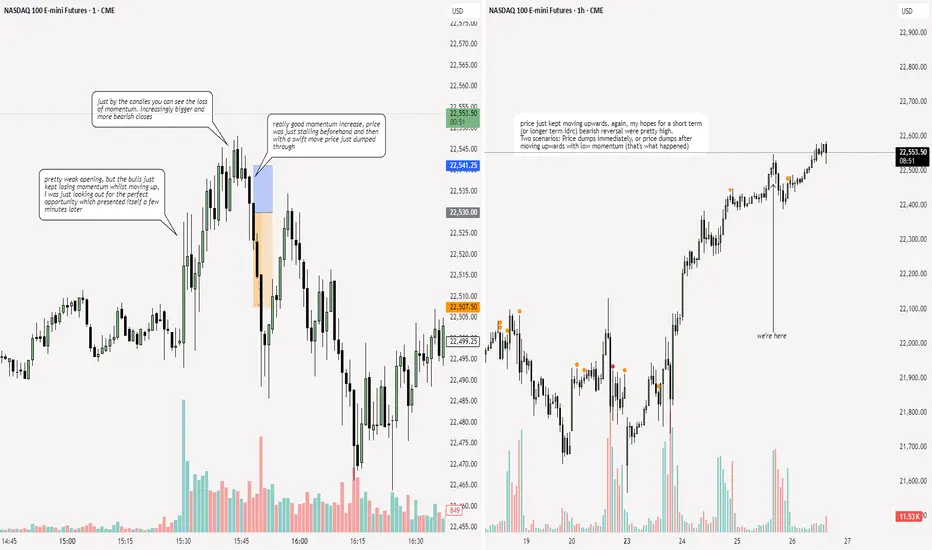
NQ Power Range Report with FIB Ext - 6/26/2025 SessionCME_MINI:NQU2025
- PR High: 22488.25
- PR Low: 22450.25
- NZ Spread: 85.0
Key scheduled economic events:
08:30 | Initial Jobless Claims
GDP
Durable Goods Orders
Session Open Stats (As of 12:25 AM 6/26)
- Session Open ATR: 358.17
- Volume: 20K
- Open Int: 252K
- Trend Grade: Neutral
- From BA ATH: -1.7% (Rounded)
Key Levels (Rounded - Think of these as ranges)
- Long: 22667
- Mid: 21525
- Short: 20383
Keep in mind this is not speculation or a prediction. Only a report of the Power Range with Fib extensions for target hunting. Do your DD! You determine your risk tolerance. You are fully capable of making your own decisions.
BA: Back Adjusted
BuZ/BeZ: Bull Zone / Bear Zone
NZ: Neutral Zone

PO3 analysis previewThis chart displays my current working model for PO3 structure, focusing on a multi-timeframe analysis (9m, 27m, 81m, 3H) using volume imbalances and key time-based phases. I’ve marked potential accumulation, manipulation, and distribution zones, alongside session-specific traps (like NYO sweeps) and key reaction areas tied to historical VIs.
The purpose of this post is to visually document these events and align them with real-time behavior. I'm exploring how price respects past VIs and cycles — especially when PO3 bar counts match across timeframes — and whether timing precision (e.g., bar 3/9 revisits) is consistently repeatable.
All annotations are part of a larger test strategy currently in development.

NASDAQ 100 ABOUT TO TEST ALL TIME HIGH WITH UPTREND!Hey Traders so looking today at the Nasdaq 100 it's looking really bullish confirmed with 3 bar trendline.
However we are now approaching resistance of this all time high at 22,820 after bounce off support at around 21,500.
So I believe it's a good place to buy on pullback to trendline at around 21,900. This level is 50% of the last big candle with is showing strong bullish momentum.
With Stop under support around 21,400
As it approaches resistance it can do 3 things.
Break through, Pause, or Reverse so will be keeping on eye on how it reacts at that level.
So if bullish watch for pullback if bearish I would not short right now too much buying momentum or at least wait until market breaks suppport or trades below downtrend line.
Always use Risk Management!
(Just in we are wrong in our analysis most experts recommend never to risk more than 2% of your account equity on any given trade.)
Good Luck & Hope This Helps Your Trading 😃
Clifford

2025-06-25 - priceactiontds - daily update - nasdaq e-mini
Good Evening and I hope you are well.
comment: Market is leaving behind gaps and breakout prices are tested but we stay above. Also higher highs and higher lows. Max bullish for new ath still.
current market cycle: trading range
key levels: 21500 - 22300
bull case: Bulls want 23000. They have to keep it above 22400 to keep the max bullish momentum going for tomorrow. Below 22400 we could test down to 22200 before another leg up. Multiple way to draw the trend lines, all are correct until broken. So draw them and watch what market does when it gets near them.
Invalidation is below 22200.
bear case: Bears actually made money selling 22500, which was a surprise to me. Especially that we stay below the open price. Bad session for me today. I still got nothing for the bears until they print below 22200 again. Everything on this chart is bullish. Best bears can hope for is another pullback below 22500 and go sideways.
Invalidation is above 22550.
short term: Max bullish for 22800 or 23000.
medium-long term - Update from 2024-06-22: Daily close below 21500 is my validation for the new bear trend which has the first bigger target at 21000 but I think we will printed below 20000 again this year. Structure is obviously not yet bearish, so don’t be early if you want confirmation and can’t/won’t scale in to shorts higher. Getting into longer term shorts above 21500 seems like the banger trade right now.
trade of the day: Buying the double bottom 22390 or any long close to it. Wasn’t the trade with most profit but the most obvious one.

Automating Your Trading Pipeline: Series Overview
Hello fellow traders!
Over the next week I’ll be rolling out a short series on how to take your TradingView alerts all the way through to live orders—fully automated—using AWS and the Tradovate API.
Today’s post is just the big-picture overview. In the days ahead we’ll peel back the layers and show you exactly how each piece fits together:
TradingView PineScript Alerts: how to craft alert payloads in Pine.
AWS API Gateway web-hook: receiving and validating your alerts.
AWS Lambda Python – processing payloads & calculating SL and TP.
Tradovate REST API – placing bracket (OCO) orders.
Telegram Notifications – real-time trade confirmations to your phone.
At the end of this series you’ll have a fully-automated end-to-end pipeline, no more manual order entry!
Stay tuned for Part 2 , when we’ll dive into crafting precise JSON alerts in PineScript.

In the 2030's The Nasdaq 100 to 2X the Dow Jones.#CupandHandle don't fight the trend.
Technology vs Industrials.
AI
Robotics
Space Economy
Biotech
Artificial Super Intelligence to power GDP to insane levels.


NQ Power Range Report with FIB Ext - 6/25/2025 SessionCME_MINI:NQU2025
- PR High: 22412.00
- PR Low: 22384.50
- NZ Spread: 61.5
Key scheduled economic events:
10:00 | Fed Chair Powell Testifies
- New Home Sales
10:30 | Crude Oil Inventories
Session Open Stats (As of 12:35 AM 6/25)
- Session Open ATR: 372.52
- Volume: 18K
- Open Int: 253K
- Trend Grade: Neutral
- From BA ATH: -1.9% (Rounded)
Key Levels (Rounded - Think of these as ranges)
- Long: 22667
- Mid: 21525
- Short: 20383
Keep in mind this is not speculation or a prediction. Only a report of the Power Range with Fib extensions for target hunting. Do your DD! You determine your risk tolerance. You are fully capable of making your own decisions.
BA: Back Adjusted
BuZ/BeZ: Bull Zone / Bear Zone
NZ: Neutral Zone

4 Powerful, Daily Affirmations for Faith-Based TradersAffirmations make a huge difference.
But why?
It's because they shape our beliefs.
Whatever we think, affects what we say.
Whatever we say, affects what we do.
Whatever we do, is who we become and what our life actual looks like.
Repeat these affirmations daily and watch your life change before your eyes.
Wealth flows to me with ease as I walk in purpose.
I reject scarcity and embrace Kingdom abundance.
I am open to divine provision in expected and unexpected ways.
I have more than enough to thrive and to give.
Happy trading!
For those of you who are trading to make a bigger impact in the world, I am praying for you!

NQ Invalidated Bearish bias!We close above 2H wick CE and went for the Daily FVG. If we close this day, I´m bullish up to All Time Highs.

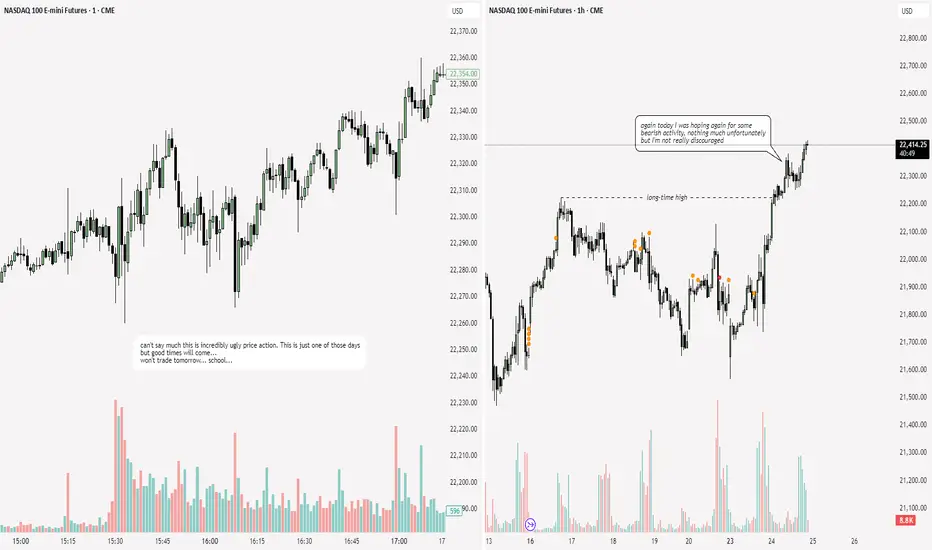
NQ: 209th trading session - recapToday wasn't the best day: My performance wasn't it tbh. Moreover I'm just really anxious about my future and I did NOT have it controlled during my session, not good.
Nasdaq Deep Bearish RetraceI Think we're going to retrace (potentially deeply) on FED release or just before it to then reverse aggressively higher.
I am considering the current "range" on m15 as re-distribution and expecting lower prices on Fed release or just prior before continuation higher that may be delayed till tomorrow next FED.

NQ Power Range Report with FIB Ext - 6/24/2025 SessionCME_MINI:NQU2025
- PR High: 22217.00
- PR Low: 22065.75
- NZ Spread: 337.75
Key scheduled economic events:
10:00 | CB Consumer Confidence
- Fed Chair Powell Testifies
Session Open Stats (As of 12:35 AM 6/24)
- Session Open ATR: 384.68
- Volume: 45K
- Open Int: 240K
- Trend Grade: Neutral
- From BA ATH: -2.8% (Rounded)
Key Levels (Rounded - Think of these as ranges)
- Long: 22096
- Mid: 20383
- Short: 19246
Keep in mind this is not speculation or a prediction. Only a report of the Power Range with Fib extensions for target hunting. Do your DD! You determine your risk tolerance. You are fully capable of making your own decisions.
BA: Back Adjusted
BuZ/BeZ: Bull Zone / Bear Zone
NZ: Neutral Zone

2025-06-23 - priceactiontds - daily update - nasdaq e-miniGood Evening and I hope you are well.
comment: Not even the US President joining a war can start the selling. Truly a special time. Above 22130 there is no reason this can’t test 22300 or higher. Market clearly does not care about the event and the pain trade seems up. Can’t hold bearish thoughts after today’s reversals. Very small chance that if we stay below 22130, bears come around and we test down to 21800 or lower.
current market cycle: trading range
key levels: 21500 - 22300
bull case: Bulls had the following legs up today: 380, 260, 350 points from swing lows to highs. On such a day, this is as bullish as it gets. They now need to print a higher high and then there is no more obvious reason why we can’t test back up to 22300 or higher.
Invalidation is below 21900.
bear case: Bears vanished after the double bottom in the US session and market closed at the high. Which is worst case for bears. Above 21130 they have to cover and I expect an acceleration upwards. If they somehow come around strongly and we go below 21950, then chances are decent that we can test down to 21800 again. Bears need to sell it early tomorrow or the bear trend line is gone and we could go much higher.
Invalidation is above 22130.
short term: Neutral. Only interested in shorts if we stay below 22130. I still think markets are grossly miss-priced and complacent but for now that thesis is wrong.
medium-long term - Update from 2024-06-22: Daily close below 21500 is my validation for the new bear trend which has the first bigger target at 21000 but I think we will printed below 20000 again this year. Structure is obviously not yet bearish, so don’t be early if you want confirmation and can’t/won’t scale in to shorts higher. Getting into longer term shorts above 21500 seems like the banger trade right now.
trade of the day: Buying literally every dip was good.

NQ Range (06-20-25)NAZ U Turn #45 or Bust, we have the Friday-Monday Long Rig test on deck. The F-M trade has been working for about a year and half, the break down here may be a big dipper. Watch the Tweet stall out and Reg Session selling, otherwise to the Moon with F-M lift.
