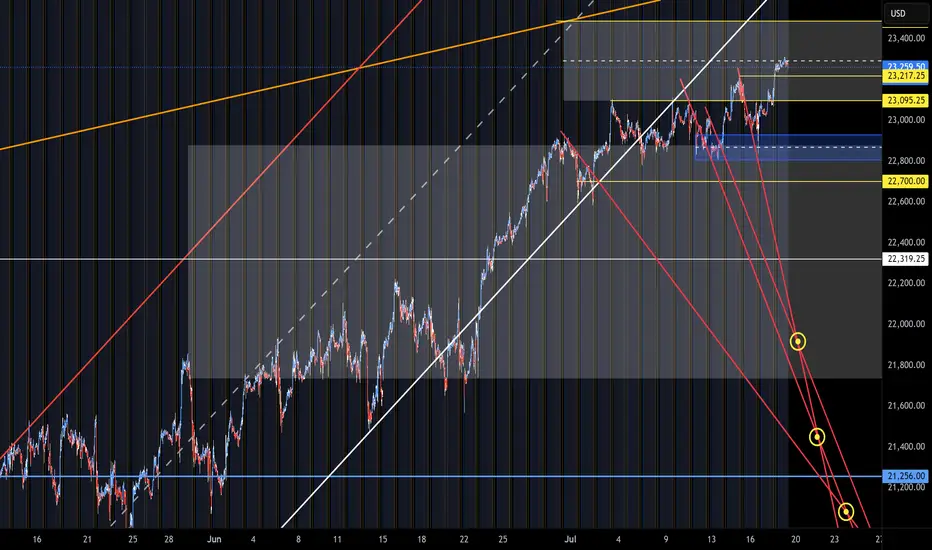
NQ Targets (07-18-25)I have not posted a Target call in awhile, this one is Long to upper TZ (23,486) and Short to YTD Open level. Prior use of Diablo's to Target drop was prior to NAZ 25% drop (11/24 Post's).
We are due for some drop retesting as we watch typical Long Side Tweets, Tricks and Games start to fizzle som
Related futures
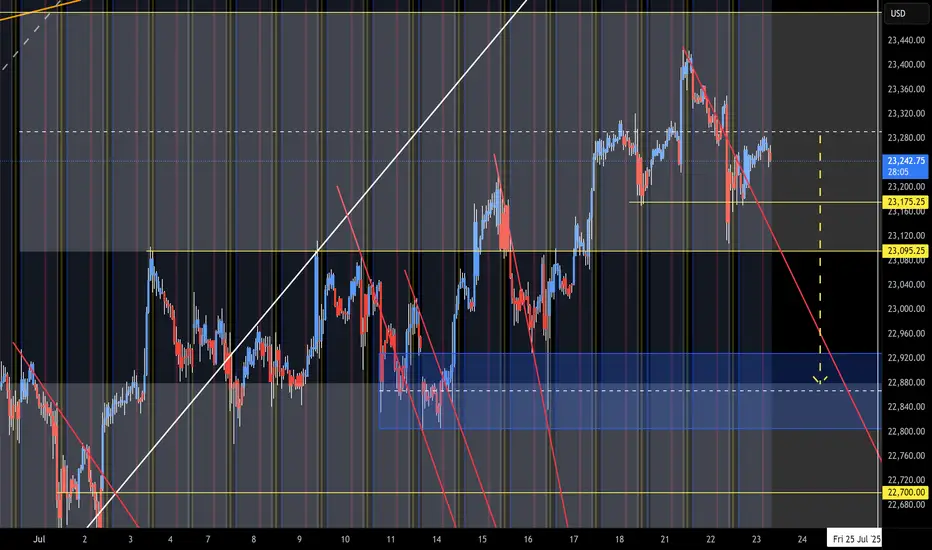
NQ Range (07-23-25)The O/N slight lift back to Mid Level of range. The big Tweet regarding Japan, did show up after the close. Now we need to see how the Open Drive & Reg Session move today, may be snail lift higher 1st. The next bullish move would be F-M Long play. The selling just does not have much force or is part
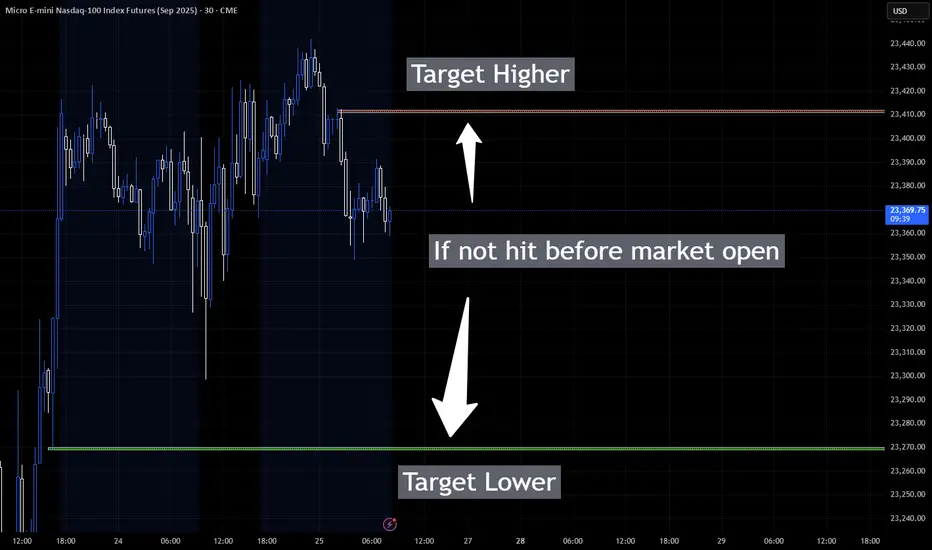
US Market open Targets for NQTarget areas for NQ at US Market open. I will use lower timeframe signals to watch for move up to higher target area or Down to lower target.
Nasdaq in future Everything's clear on chart
I wanna see a bullish move on NQ first to create a up run leg and come back to the lower 50 percent of that leg then ...
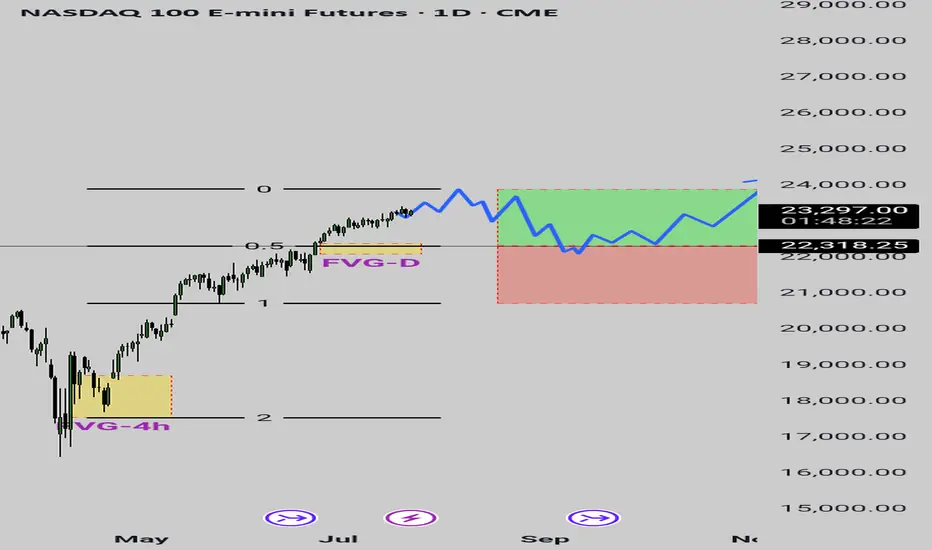
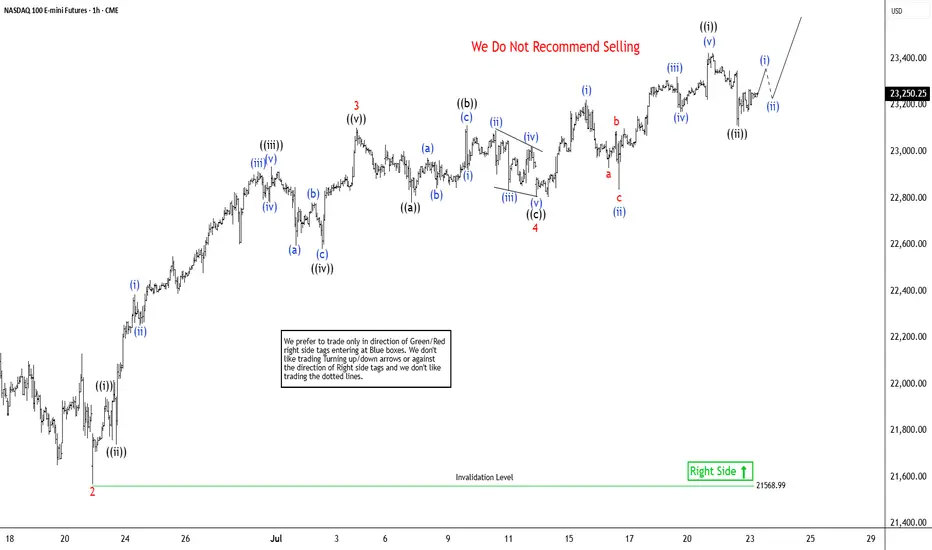
Elliott Wave View: Nasdaq Futures (NQ_F) Poised To Extend HigherThe Nasdaq Futures (NQ_F) favors higher in bullish impulse sequence from April-2025 low. It already broke above December-2024 high & expect short term pullback in 3, 7 or 11 swings to remain supported. Impulse sequence unfolds in 5, 9, 13, 17, 21….. swings count. It ended daily corrective pullback i
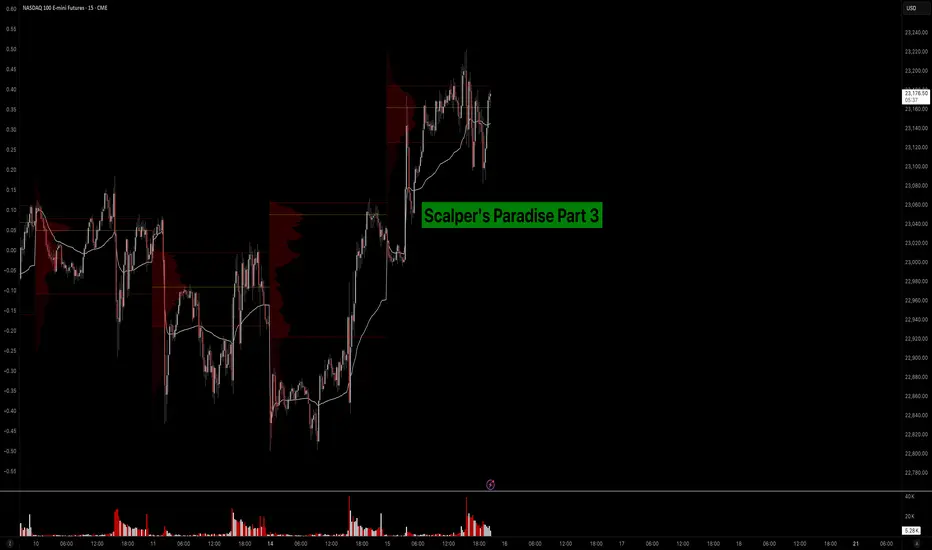
Scalper’s Paradise Part 3 – The Power of Order Flow and DOMWelcome back to Scalper’s Paradise! In this third part of the series, I want to take you into one of the most powerful tools in professional trading: Order Flow and the Depth of Market (DOM).
I chose this topic because during my time as an institutional trader, this was our entire world. We didn’
Emini Nasdaq 100. Daily Orderflow. 22.07.2025, TuesdayDaily orderflow and the thought process behind execution on Nasdaq

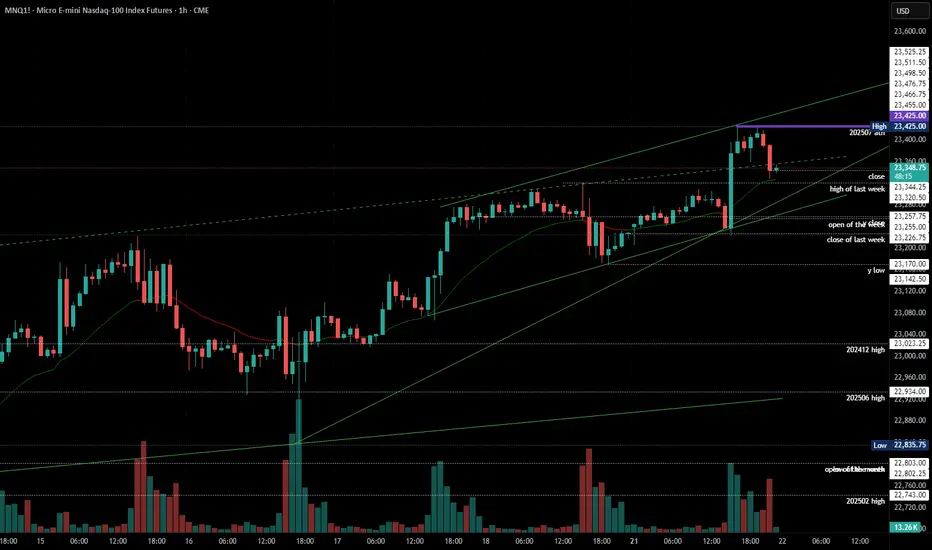
2025-07-21 - priceactiontds - daily update - nasdaqGood Evening and I hope you are well.
comment: Melt-up and bears failed to close below last weeks high, which means we are still max bullish. Until bears print below 23200, longs just make more sense than trying to look for shorts.
current market cycle: bull trend
key levels: 23000 - 23500
bull
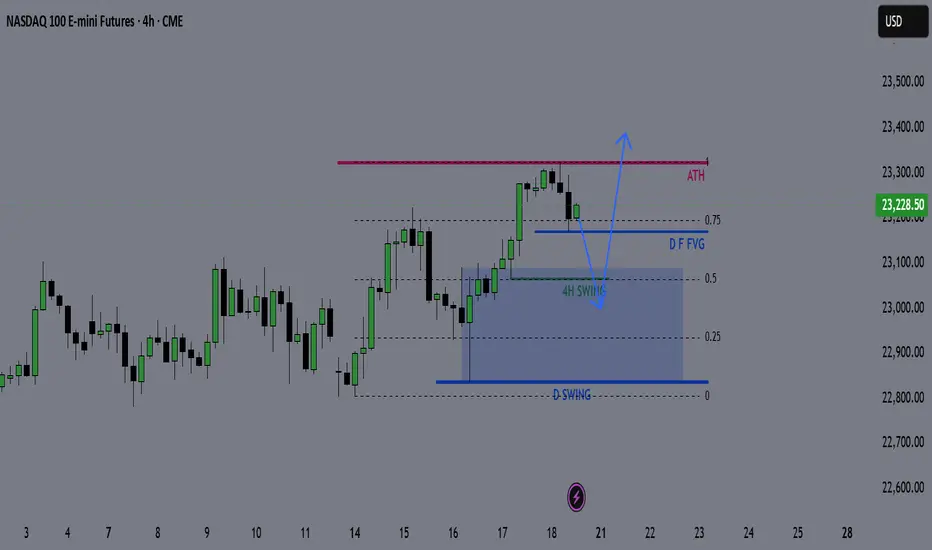
NQ Weekly Outlook & Game Plan 20/07/2025NQ Weekly Outlook & Game Plan
🧠 Fundamentals & Sentiment
Market Context:
NQ continues its bullish momentum, driven by institutional demand and a supportive U.S. policy environment.
📊 Technical Analysis:
Price is currently in price discovery, and the weekly structure remains strongly bullish — so I
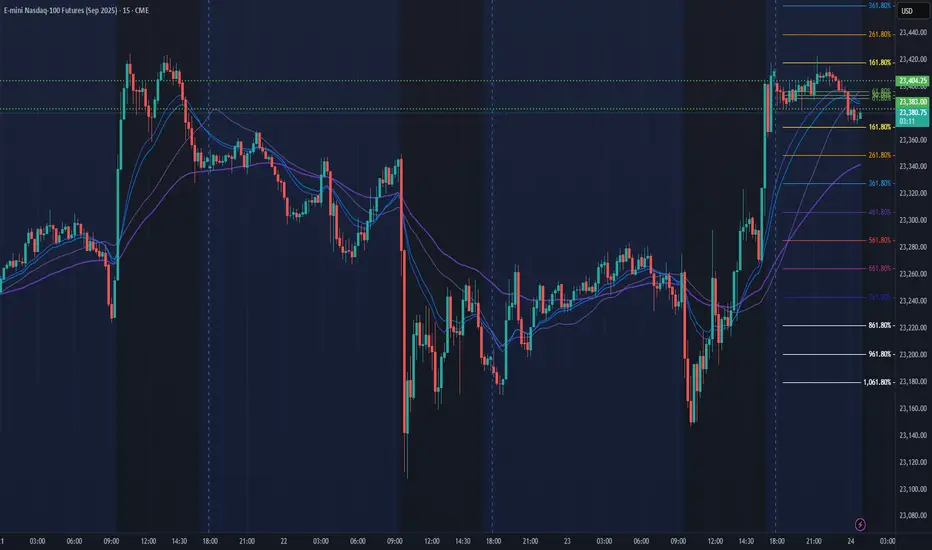
NQ Power Range Report with FIB Ext - 7/24/2025 SessionCME_MINI:NQU2025
- PR High: 23404.25
- PR Low: 23383.00
- NZ Spread: 47.75
Key scheduled economic events:
08:30 | Initial Jobless Claims
09:45 | S&P Global Manufacturing PMI
- S&P Global Services PMI
10:00 | New Home Sales
Front run ATH, advertising breakout potential
Session Open Stats (As
See all ideas
Summarizing what the indicators are suggesting.
Neutral
SellBuy
Strong sellStrong buy
Strong sellSellNeutralBuyStrong buy
Neutral
SellBuy
Strong sellStrong buy
Strong sellSellNeutralBuyStrong buy
Neutral
SellBuy
Strong sellStrong buy
Strong sellSellNeutralBuyStrong buy
A representation of what an asset is worth today and what the market thinks it will be worth in the future.
Frequently Asked Questions
The current price of Micro E-mini Nasdaq-100 Index Futures (Sep 2026) is 24,369.50 USD — it has risen 0.19% in the past 24 hours. Watch Micro E-mini Nasdaq-100 Index Futures (Sep 2026) price in more detail on the chart.
The volume of Micro E-mini Nasdaq-100 Index Futures (Sep 2026) is 1.00. Track more important stats on the Micro E-mini Nasdaq-100 Index Futures (Sep 2026) chart.
The nearest expiration date for Micro E-mini Nasdaq-100 Index Futures (Sep 2026) is Sep 18, 2026.
Traders prefer to sell futures contracts when they've already made money on the investment, but still have plenty of time left before the expiration date. Thus, many consider it a good option to sell Micro E-mini Nasdaq-100 Index Futures (Sep 2026) before Sep 18, 2026.
Open interest is the number of contracts held by traders in active positions — they're not closed or expired. For Micro E-mini Nasdaq-100 Index Futures (Sep 2026) this number is 3.00. You can use it to track a prevailing market trend and adjust your own strategy: declining open interest for Micro E-mini Nasdaq-100 Index Futures (Sep 2026) shows that traders are closing their positions, which means a weakening trend.
Buying or selling futures contracts depends on many factors: season, underlying commodity, your own trading strategy. So mostly it's up to you, but if you look for some certain calculations to take into account, you can study technical analysis for Micro E-mini Nasdaq-100 Index Futures (Sep 2026). Today its technical rating is strong buy, but remember that market conditions change all the time, so it's always crucial to do your own research. See more of Micro E-mini Nasdaq-100 Index Futures (Sep 2026) technicals for a more comprehensive analysis.