NQ: 170th trading session - recapYurr, I'm back actually trading again. Last week was so bad because price action was SO UGLY AHHHHHH. It's still not ideal, especially on the higher timeframes, sh*t looks like a heart rate monitor.
But yk, I gotta start trading someday again yk.
Might aswell be now.
NQ1! trade ideas

nasdaq rallies to 32kgood morning,
i don’t usually post publicly, especially not about the stock market, but today feels like the right moment. i wanted to share my updated outlook for the nasdaq over the next year or so.
this was originally a member-only idea i shared back in september. you can check out the original post here:
---
the whole idea was based on a leading diagonal pattern, followed by a sharp wave 2 that resets sentiment and shakes out early optimism. this kind of move tends to scare most people out before the real run begins. from there, the setup calls for a parabolic wave 3 that carries us all the way to the grand cycle wave 5 target, around 32k (chart attached)
👇
---
the reason behind this move is actually pretty straightforward... a short squeeze into the end of the cycle, a weakening dollar, falling interest rates, looser tariff policy, and everyone’s favorite fuel: quantitative easing. while rates haven’t fallen yet and tariff policies are still tight, major shifts are on the horizon. i believe those shifts will trigger a parabolic rally.
and there’s one more catalyst behind this push, the ai boom. i believe artificial general intelligence will be cracked before the year is over, and the market is already beginning to price that in, starting now.
🌙


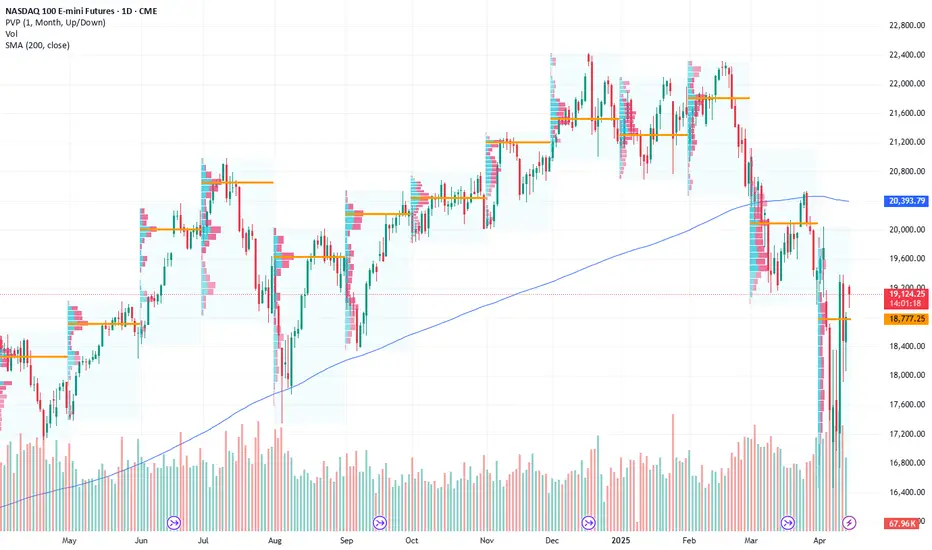
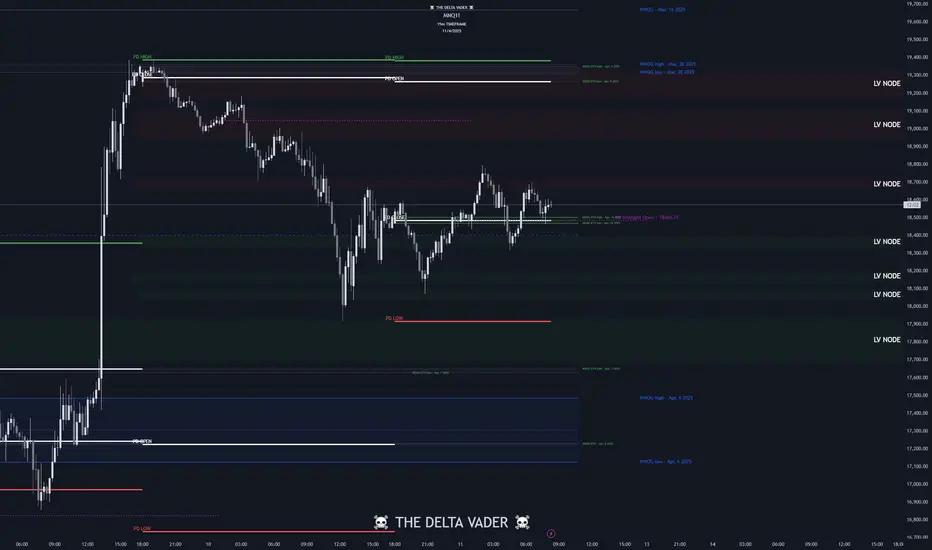
NQ KEY ICT LEVELS - 14th APRIL 2025Levels marked on the chart using my free indicator which marks out all of the ICT key levels which can be used for potential POIs where price might react

NQ KEY LEVELS - 14th APRIL 2025Key levels marked by using low volume nodes for potential key levels where we may see price react.

Nasdaq Technical Analysis. What Makes Nasdaq a Trader’s Favorite📊 Nasdaq Technical Analysis – Week 15, 2025
This week’s Nasdaq structure suggests a high probability of sideways movement between 19,500 and 18,700,
despite recent macro-driven volatility.
Key headlines include: – U.S. tariff adjustments & China’s 125% retaliation
– March CPI hitting the lowest level since early 2021
– Bond market instability and capital outflows
From a technical perspective:
🔹 volatility on the weekly is overheated — suggesting reduced volatility ahead
🔹 Fibonacci 0.618 near 20,084 may act as short-term resistance
🔹 Ideal long zone sits between 18,600 and 18,700, with invalidation below 18,500
(by 12H closure)
🔹 Ideal long zone sits between 18,000 and 18,300, with invalidation below 17,900
(Just a touch of 17,900 might invalidate this idea)
This analysis includes trendline setups held since 2023, confirming the value of clean charting.
A full structure review from Yearly to 4H charts is included.
No news-based guesswork. Just structured, chart-driven insight.
📌 If this chart aligns with your bias, feel free to save, comment, or follow.

UPDATE - NDX/NQ!Good Morning,
NASDAQ setting itself in with come consolidation. We will need really strong volume to break up into bullish price action which is above the last resistance.
NDX - RESISTANC LEVEL - 19,492-19,8000 - HIGH VOLUME
NDX - SUPPORT LEVEL - 18,590- 18,309 LOW VOLUME
Enjoy!

Is NASDAQ Futures Set to Continue Its Bullish Momentum? Key Leve
- Key Insights: Nasdaq Futures are off to a strong start with a 1.4% gain,
bolstered by optimism in the tech sector and risk-on sentiment. However,
caution is advised as mid-week reversals could emerge, driven by
macroeconomic events and Federal Reserve commentary. Traders should monitor
yields, tech earnings, and sector tailwinds closely.
- Price Targets:
- Target Level 1 (T1): 19,400 (~3.2% higher), indicating a breakout
opportunity tied to bullish sentiment.
- Target Level 2 (T2): 19,800 (~5.3% higher), representing extended upside
momentum if T1 is breached.
- Stop Level 1 (S1): 18,200 (~3.2% lower), key downside protection in case of
a midweek reversal.
- Stop Level 2 (S2): 17,700 (~5.9% lower), deeper support for risk control
against volatility.
- Recent Performance: Nasdaq Futures gained 260 points, up 1.4% amidst strong
market sentiment, buoyed significantly by technology stocks. Weekend Wall
Street Futures also rallied 2-3%, signaling robust market positioning and
optimism leading into the new trading week.
- Expert Analysis: Analysts attribute current bullishness to the technology
sector’s leadership, strong earnings outlook, and broader risk-on appetite
reflected in correlated assets like Bitcoin. However, higher Treasury yields
(4.5%) could temper growth stocks later in the week as borrowing costs rise.
Investors are urged to monitor inflation data and sector developments for
recalibration.
- News Impact: Apple options activity hints at potential upcoming catalysts,
while Nasdaq ETF trends in QQQ suggest sustained bullishness with resistance
levels aligning to Futures analysis. Federal Reserve commentary and
inflation data may pose key risks, especially for rate-sensitive tech
stocks.
Today analysis for Nasdaq, Oil, and GoldNasdaq
The Nasdaq closed higher on the daily chart. It held above 18,360 at the close, and today’s candle formed a golden cross as the MACD crossed above the Signal line, creating a potential buy signal. However, this signal will only be confirmed if the candle closes as a solid bullish bar, so it's too early to say that a buy confirmation has been established.
On the weekly chart, although the index has not yet reclaimed the 5-week MA, it has gapped above it. Overall, the index appears to be forming a box range between the 3-week and 10-week MAs, and if further upside occurs, we could potentially see a move toward the 60-week MA. However, since the MACD and Signal line on the weekly chart are still sloping downward, there's a high possibility of a medium-term pullback even if the index rallies to the 10-week MA.
On the daily chart, the index is still meeting resistance at the 20-day MA, and the key point now is whether the MACD completes the golden cross or turns downward again. Since the index has managed to hold above 18,360, the potential for a rebound remains open. Buying during pullbacks near the lower wick remains a favorable strategy.
On the 240-minute chart, the MACD is turning upward after finding support at the Signal line, forming a potential third wave of buying. In short-term timeframes, buying on dips remains favorable.
This week, the Retail Sales data is scheduled for Wednesday, and the U.S. markets will be closed on Friday. Please keep that in mind for risk management.
Crude Oil
Crude oil closed higher in a narrow range on the daily chart. On the weekly chart, a long lower wick formed, finishing with a doji candle, suggesting indecision. Last week, oil was rejected at the 3-week MA, forming an upper wick. If it rallies this week, it could target the 5-week MA. The $65 level, near both the 5-week and 240-week MAs, remains a strong resistance zone, making it a potentially favorable area to consider short trades.
On the daily chart, oil has entered a box range between the 5-day and 10-day MAs. Though the MACD and Signal line still point downward, oil is currently holding within a supportive range. There is a possibility the MACD could begin to turn upward, so keeping both bullish and bearish scenarios open is advisable.
On the 240-minute chart, the MACD is still rising after a golden cross but remains below the zero line, suggesting a potential for another pullback. Overall, monitor intraday movements and continue to trade within the range.
Gold
Gold closed higher, setting a new all-time high. The weekly chart formed a strong bullish candle, resuming its upward trend. Buying near the 3-week MA remains favorable. As the price has overshot the previous target of $3,216, we’ve now entered an overshooting zone, making it difficult to define the next resistance. Therefore, caution is advised for short positions, and it’s best to focus on buying the dips.
On the daily chart, the new all-time high generated a bullish signal, and buying near the 3-day MA is recommended. Gold may enter a sideways consolidation phase while aligning its moving averages. In that case, buying near the 5-day MA may also be considered, but avoid chasing the price higher.
The MACD has made another golden cross, and it’s important that the MACD doesn’t create a divergence by failing to surpass its previous peak. Avoid shorts, and stick with buy-the-dip strategies. On the 240-minute chart, buying momentum remains strong. The RSI is in overbought territory, so again, avoid shorting and focus only on buying during pullbacks.
Market Outlook
Compared to the last two weeks of high volatility, this week is expected to be more subdued. After a period of extreme moves, the market is likely to consolidate and seek direction. Rather than swinging for home runs, it's better to focus on small base hits and steadily build profits.
Wishing you a successful trading week!
If you like my analysis, please follow me and give it a boost!
For additional strategies for today, check out my profile. Thank you!

NASDAQ Futures Long Setup: Pullback Entry After Tariff BoostMarket Outlook – April 13, 2025
Quick recap: In my last public analysis, I mentioned watching the 18,350–18,000 zone for signs of support — a level stacked with confluence (50–61.8% Fib, EMA, VWAP, pivot). Price broke down deeper than expected but responded beautifully:
✅ Tagged 18,000 almost to the tick
✅ Rejected hard at the 61.8 Fib
✅ Respected the 50 Fib on the way back up
All solid signs of strength.
Now with tariff exemptions announced today (bullish for tech/Nasdaq), I’m opening the door to more long setups this week.
Here’s What I’m Watching:
🔹 Scenario A: Pullback into the 18,575–18,500 zone (first dotted white line). If price reclaims structure or gives me something clean — EMA bounce, VWAP tag, candle pattern — I’ll look for longs.
🔹 Scenario B: If that level breaks or I miss the first shot, I’ll look for a second chance around 18,000–18,300. Same deal: not jumping in blindly, waiting for a setup to form.
To be clear — these are areas of interest, not automatic trades. I want clean structure and confirmation before entering.
Let’s see how it plays out. Will update if/when I take a position. Stay sharp. 📈

LONG NASDAQ Hello everyone, today I’m sharing an update on my analysis of the Nasdaq 100, following the bullish bias I previously mentioned in an earlier idea. Below, I’ll break down the reasons behind my perspective and how I plan to take advantage of this movement. Let’s dive into the details!
Why I Remain Bullish on the Nasdaq 100
Institutional and Retail Trader Activity
My indicator of institutional and retail trader data shows that retail traders are selling heavily. Historically, my indicator suggests that the price tends to correct these positions, which reinforces my bullish bias.
Open Interest
My open interest indicator, which tracks the net positions of institutional traders—the ones who truly move the market—shows a clear upward trend in long contracts. This indicates that the big players are positioning themselves for an upward move.
Valuation
My valuation indicator, which compares the Nasdaq to the US dollar, gold, and 10-year US Treasury bonds, points to a clear undervaluation relative to all three. This suggests that the current price is an attractive buying opportunity.
Seasonality
Seasonality also supports my outlook, indicating a bullish trend for the coming months. In my previous idea, I mentioned that I expected a potential low at the beginning of April, specifically around April 4th. Here’s the excerpt from that idea:
"My seasonality analysis, which studies historical patterns at certain times of the year, indicates that the Nasdaq could hit a low around April 4th. If this low is confirmed, it could be the springboard for an upward rebound, and I want to be ready for that moment."
That low appears to have been confirmed, and we’re now seeing the development of the expected bullish move.
Update: Bullish Intent Confirmed
In this new phase, I’ve been waiting for the price to show clear bullish intent through price action. I can now see this in the chart with massive, large candles indicating strong buying momentum. Using advanced technical analysis of supply and demand—or what some in the newer community refer to as an "Order Block"—I’ve identified a key zone to go long in the 16-hour timeframe, as shown in the chart.
My Entry Strategy
I’ll be entering a long position in this demand zone I’ve identified, aiming to capitalize on the bullish momentum that’s forming. I’ll keep this idea updated as the price and my indicators evolve, so stay tuned for more details.
Disclaimer
This is my personal analysis and does not constitute financial advice. Trading carries risks, so always conduct your own research and assess your risk tolerance before making decisions.

#202515 - priceactiontds - weekly update - nasdaqGood Evening and I hope you are well.
comment: Lower low major trend reversal or continuing of the bear trend? This is the question we will get an answer to most likely when futures open in a couple of hours. My assumption is that we will see a mind boggling rally for the MAG7 while small caps will be crashed like there is no tomorrow. Orange face man want the companies come crawling and bending the knee begging for an exemption and so far for some it worked. Market has respected the bear trend line and daily 20ema last week but I doubt those will hold next week. If they do, it would be a very strong sign by the bears that they remain in full control and we will most likely retest the lows over the next days/weeks.
current market cycle: bear trend but above 20046 it ends and we will be in a giant trading range
key levels: 16000 - 20100
bull case: Bulls want this trend to end and crush the hopes for a third leg down. They have received another gift in form of more news helping them, like the bears did when this whole thing started. It’s tough to trade when 1 tweet can move the markets 5-15%. I normally lean towards volatility but this is insanity. Above 20050 I honestly don’t see a reason why market can not do a measured move up to 22000. Bears have to cover shorts latest at 19500 and the move up could become that violent.
Invalidation is below 18000.
bear case: Bears are fine if we continue with the lower highs and stay inside the bear channel but the probability after the big tariff exemption is low. I expect remaining bears to rush for the exits on futures open and we could see a complete capitulation higher. If they somehow manage to stay below 19500, that would be a very strong sign and we will likely continue the bear trend and the chance for a third leg down would be there.
Invalidation is above 19500 (very low chance that 20000 is the big resistance if we make higher highs above 19500).
short term: Above 19500 I will be max bullish for a meltup to 21000 or 22000. This will most likely be a pure momentum trade and we could see a 5-10% move down this week as well but for now, my assumption is max bullish if futures open strong. Bears would have to stay below 19400 and make lower lows below 18000 for me to turn bear again.
medium-long term - Update from 2024-03-16: My most bearish target for 2025 was 17500ish, given in my year-end special. We had the clear W1 and W3 but now it’s messy. News have given bulls everything they dreamed of and if we make higher highs again, bear trend is over and my base case would be a trading range 16000 - 23000 for months if not years.
current swing trade: Swing long above 19400 for 20000 and likely 21000+
chart update: Nothing

Buyside liquidity draw on liquidity Price took sellside liquidity, then had a IFVG Bullish, last 2 daily candle respecting the IFVG level. I have interest on the level of The buy stops as my initial target.

NQ TO BUY As we see nq moving on uptrend so , here a chance to try from 16680 with a good ration up to 5 reward,Let's see what the market want to do .
HAVE A GOOD DAY
CME_MINI:NQ1!

MNQ!/NQ1! Day Trade Plan for 04/11/2025MNQ!/NQ1! Day Trade Plan for 04/11/2025 (Just because 😏)
📈18670 18820
📉18220 18060
Thanks to all my followers! Truly appreciate the support!
Please like and share for more NQ levels Tues & Thurs 🤓📈📉🎯💰
*These levels are derived from comprehensive backtesting and research and a quantitative system demonstrating high accuracy. This statistical foundation suggests that price movements are likely to exceed initial estimates.*

NQ: 169th trading session - recapYea so also nothing happened friday, I just noticed that overall everything is just off:
- Overall market was just too volatile this past week
- My psychology is absolutely f*cked
- Didn't stick to my plan
With the upcoming holidays (2 weeks) I will be relocking back in.
I got my psychology and my plan right. These next two weeks I'll be trading everyday, sticking to my plan and executing it (if I get setups) in a perfect way.
Also, really important: I'm excited again to face the markets, that's what counts.

NQ: 168th trading session - recapDidn't trade that day, as explained: Everything is just too damn volatile

Nasdaq Outlook (Apr 15–19)🧠 Nasdaq Outlook (Apr 15–19)
📌 Bias: Neutral → Bearish
📈 Bull Target (if bounce):
→ 19,200 – 19,600
📉 Bear Targets (if rejection):
→ 18,000
→ 17,500
→ 16,000–16,500
🗓️ Key Events
• Tue: Empire State Index
• Wed: Core Retail Sales, Powell 🧨
• Thu: Unemployment Claims, Philly Fed
Price may rebalance D/W inefficiency early — then drop if macro aligns 🧩
📛 Disclaimer: Not financial advice. Educational only. Trade safe.
#NQ #NASDAQ #Futures #Macro #DayTrading #SoothingTrades

April 11th $350 DUBGreat way to end the week trading. I go over this amazing setup and it is the same one as yesterday!

NQ Range (04-11-25)The forecast here is until the Monday Close, looking at the typical Long play from Friday - Monday. Expecting some games on this one, including some head fakes. Long to KL 19,389 and rejection would be the Short, pass hold Long. Short to any KL below will have the push/pull price action and will struggle to get lower. After Monday and should the NAZ still be inside this range look Short. The games usually come out on Friday's and in the Sunday-Monday Pre Open session. 30M Chart is below.

EXTREME WARNING!!! NQ is heading to 16.000Based on my trading algo, NQ is heading to 16.000, Be warned beforehand

NQ KEY ICT LEVELS - 11th APRIL 2025Levels marked on the chart using my free indicator which marks out all of the ICT key levels which can be used for potential POIs where price might react
NQ KEY LEVELS - 11th APRIL 2025Key levels marked by using low volume nodes for potential key levels where we may see price react.
