3.25.25 Market UpdateTradovate is not working for me, so I cannot trade. Times like this shows how sometimes having different brokers is beneficial.
Forex, Crypto and Futures Trading Risk Disclosure:
The National Futures Association (NFA) and Commodity Futures Trading Commission (CFTC), the regulatory agencies for the forex and futures markets in the United States, require that customers be informed about potential risks in trading these markets. If you do not fully understand the risks, please seek advice from an independent financial advisor before engaging in trading.
Trading forex and futures on margin carries a high level of risk and may not be suitable for all investors. The high degree of leverage can work against you as well as for you. Before deciding to trade, you should carefully consider your investment objectives, level of experience, and risk appetite.
There is a possibility of losing some or all of your initial investment, and therefore, you should not invest money that you cannot afford to lose. Be aware of the risks associated with leveraged trading and seek professional advice if necessary.
BDRipTrades Market Opinions (also applies to BDelCiel and Aligned & Wealthy LLC):
Any opinions, news, research, analysis, prices, or other information contained in my content (including live streams, videos, and posts) are provided as general market commentary only and do not constitute investment advice. BDRipTrades, BDelCiel, and Aligned & Wealthy LLC will not accept liability for any loss or damage, including but not limited to, any loss of profit, which may arise directly or indirectly from the use of or reliance on such information.
Accuracy of Information: The content I provide is subject to change at any time without notice and is intended solely for educational and informational purposes. While I strive for accuracy, I do not guarantee the completeness or reliability of any information. I am not responsible for any losses incurred due to reliance on any information shared through my platforms.
Government-Required Risk Disclaimer and Disclosure Statement:
CFTC RULE 4.41 - HYPOTHETICAL OR SIMULATED PERFORMANCE RESULTS HAVE CERTAIN LIMITATIONS. UNLIKE AN ACTUAL PERFORMANCE RECORD, SIMULATED RESULTS DO NOT REPRESENT ACTUAL TRADING. ALSO, SINCE THE TRADES HAVE NOT BEEN EXECUTED, THE RESULTS MAY HAVE UNDER-OR-OVER COMPENSATED FOR THE IMPACT, IF ANY, OF CERTAIN MARKET FACTORS, SUCH AS LACK OF LIQUIDITY. SIMULATED TRADING PROGRAMS IN GENERAL ARE ALSO SUBJECT TO THE FACT THAT THEY ARE DESIGNED WITH THE BENEFIT OF HINDSIGHT. NO REPRESENTATION IS BEING MADE THAT ANY ACCOUNT WILL OR IS LIKELY TO ACHIEVE PROFIT OR LOSSES SIMILAR TO THOSE SHOWN.
Performance results discussed in my content are hypothetical and subject to limitations. There are frequently sharp differences between hypothetical performance results and the actual results subsequently achieved by any particular trading strategy. One of the limitations of hypothetical trading results is that they do not account for real-world financial risk.
Furthermore, past performance of any trading system or strategy does not guarantee future results.
General Trading Disclaimer:
Trading in futures, forex, and other leveraged products involves substantial risk and is not appropriate for all investors.
Do not trade with money you cannot afford to lose.
I do not provide buy/sell signals, financial advice, or investment recommendations.
Any decisions you make based on my content are solely your responsibility.
By engaging with my content, including live streams, videos, educational materials, and any communication through my platforms, you acknowledge and accept that all trading decisions you make are at your own risk. BDRipTrades, BDelCiel, and Aligned & Wealthy LLC cannot and will not be held responsible for any trading losses you may incur.
NQ1! trade ideas

Buy Nasdaq FuturesAs per the chart!
Expectin the market to recover today. Got a nice bounce off the Asian session.

Trading Mistake made before 9:30 openEntered a trade that I should have waited on, here it is. Transparent and shown in real time in this video with my personal opinions.
Forex, Crypto and Futures Trading Risk Disclosure:
The National Futures Association (NFA) and Commodity Futures Trading Commission (CFTC), the regulatory agencies for the forex and futures markets in the United States, require that customers be informed about potential risks in trading these markets. If you do not fully understand the risks, please seek advice from an independent financial advisor before engaging in trading.
Trading forex and futures on margin carries a high level of risk and may not be suitable for all investors. The high degree of leverage can work against you as well as for you. Before deciding to trade, you should carefully consider your investment objectives, level of experience, and risk appetite.
There is a possibility of losing some or all of your initial investment, and therefore, you should not invest money that you cannot afford to lose. Be aware of the risks associated with leveraged trading and seek professional advice if necessary.
BDRipTrades Market Opinions (also applies to BDelCiel and Aligned & Wealthy LLC):
Any opinions, news, research, analysis, prices, or other information contained in my content (including live streams, videos, and posts) are provided as general market commentary only and do not constitute investment advice. BDRipTrades, BDelCiel, and Aligned & Wealthy LLC will not accept liability for any loss or damage, including but not limited to, any loss of profit, which may arise directly or indirectly from the use of or reliance on such information.
Accuracy of Information: The content I provide is subject to change at any time without notice and is intended solely for educational and informational purposes. While I strive for accuracy, I do not guarantee the completeness or reliability of any information. I am not responsible for any losses incurred due to reliance on any information shared through my platforms.
Government-Required Risk Disclaimer and Disclosure Statement:
CFTC RULE 4.41 - HYPOTHETICAL OR SIMULATED PERFORMANCE RESULTS HAVE CERTAIN LIMITATIONS. UNLIKE AN ACTUAL PERFORMANCE RECORD, SIMULATED RESULTS DO NOT REPRESENT ACTUAL TRADING. ALSO, SINCE THE TRADES HAVE NOT BEEN EXECUTED, THE RESULTS MAY HAVE UNDER-OR-OVER COMPENSATED FOR THE IMPACT, IF ANY, OF CERTAIN MARKET FACTORS, SUCH AS LACK OF LIQUIDITY. SIMULATED TRADING PROGRAMS IN GENERAL ARE ALSO SUBJECT TO THE FACT THAT THEY ARE DESIGNED WITH THE BENEFIT OF HINDSIGHT. NO REPRESENTATION IS BEING MADE THAT ANY ACCOUNT WILL OR IS LIKELY TO ACHIEVE PROFIT OR LOSSES SIMILAR TO THOSE SHOWN.
Performance results discussed in my content are hypothetical and subject to limitations. There are frequently sharp differences between hypothetical performance results and the actual results subsequently achieved by any particular trading strategy. One of the limitations of hypothetical trading results is that they do not account for real-world financial risk.
Furthermore, past performance of any trading system or strategy does not guarantee future results.
General Trading Disclaimer:
Trading in futures, forex, and other leveraged products involves substantial risk and is not appropriate for all investors.
Do not trade with money you cannot afford to lose.
I do not provide buy/sell signals, financial advice, or investment recommendations.
Any decisions you make based on my content are solely your responsibility.
By engaging with my content, including live streams, videos, educational materials, and any communication through my platforms, you acknowledge and accept that all trading decisions you make are at your own risk. BDRipTrades, BDelCiel, and Aligned & Wealthy LLC cannot and will not be held responsible for any trading losses you may incur.

NQ!Buying opportunity for NQ.
This idea is based on a search for liquidity after a high-volume rally, leaving a gap that needs to be filled.
A Weychoff-based entry analysis is valid.

NQ: 159th trading session - recapFORGOT TO POST THIS!!!!!!!!!!!
Man I gotta work on that, one losing trade, it's not that deep tho

Tuesday's NQ Trade idea 3.25.25 first trade of the day. SL was hit at $160 profit. We disrespected the bearish FVG level.
Let's see what happens next.
Forex, Crypto and Futures Trading Risk Disclosure:
The National Futures Association (NFA) and Commodity Futures Trading Commission (CFTC), the regulatory agencies for the forex and futures markets in the United States, require that customers be informed about potential risks in trading these markets. If you do not fully understand the risks, please seek advice from an independent financial advisor before engaging in trading.
Trading forex and futures on margin carries a high level of risk and may not be suitable for all investors. The high degree of leverage can work against you as well as for you. Before deciding to trade, you should carefully consider your investment objectives, level of experience, and risk appetite.
There is a possibility of losing some or all of your initial investment, and therefore, you should not invest money that you cannot afford to lose. Be aware of the risks associated with leveraged trading and seek professional advice if necessary.
BDRipTrades Market Opinions (also applies to BDelCiel and Aligned & Wealthy LLC):
Any opinions, news, research, analysis, prices, or other information contained in my content (including live streams, videos, and posts) are provided as general market commentary only and do not constitute investment advice. BDRipTrades, BDelCiel, and Aligned & Wealthy LLC will not accept liability for any loss or damage, including but not limited to, any loss of profit, which may arise directly or indirectly from the use of or reliance on such information.
Accuracy of Information: The content I provide is subject to change at any time without notice and is intended solely for educational and informational purposes. While I strive for accuracy, I do not guarantee the completeness or reliability of any information. I am not responsible for any losses incurred due to reliance on any information shared through my platforms.
Government-Required Risk Disclaimer and Disclosure Statement:
CFTC RULE 4.41 - HYPOTHETICAL OR SIMULATED PERFORMANCE RESULTS HAVE CERTAIN LIMITATIONS. UNLIKE AN ACTUAL PERFORMANCE RECORD, SIMULATED RESULTS DO NOT REPRESENT ACTUAL TRADING. ALSO, SINCE THE TRADES HAVE NOT BEEN EXECUTED, THE RESULTS MAY HAVE UNDER-OR-OVER COMPENSATED FOR THE IMPACT, IF ANY, OF CERTAIN MARKET FACTORS, SUCH AS LACK OF LIQUIDITY. SIMULATED TRADING PROGRAMS IN GENERAL ARE ALSO SUBJECT TO THE FACT THAT THEY ARE DESIGNED WITH THE BENEFIT OF HINDSIGHT. NO REPRESENTATION IS BEING MADE THAT ANY ACCOUNT WILL OR IS LIKELY TO ACHIEVE PROFIT OR LOSSES SIMILAR TO THOSE SHOWN.
Performance results discussed in my content are hypothetical and subject to limitations. There are frequently sharp differences between hypothetical performance results and the actual results subsequently achieved by any particular trading strategy. One of the limitations of hypothetical trading results is that they do not account for real-world financial risk.
Furthermore, past performance of any trading system or strategy does not guarantee future results.
General Trading Disclaimer:
Trading in futures, forex, and other leveraged products involves substantial risk and is not appropriate for all investors.
Do not trade with money you cannot afford to lose.
I do not provide buy/sell signals, financial advice, or investment recommendations.
Any decisions you make based on my content are solely your responsibility.
By engaging with my content, including live streams, videos, educational materials, and any communication through my platforms, you acknowledge and accept that all trading decisions you make are at your own risk. BDRipTrades, BDelCiel, and Aligned & Wealthy LLC cannot and will not be held responsible for any trading losses you may incur.

Short position NQShort position NQ high probability setup
SL: swing high
TP: FE 1.618
Size based on your risk management strategy

Short Position High Probability NQShort Position High Probability NQ
TP: FE 1.61
SL: Swing High
Size based on your risk management strategy

NQ High Probability Short TradeNQ High Probability Short Trade
Short position
TP: 20245.75
SL: 20374.25
Adapt the size to your risk management strategy


Price moving up through resistance - facing new resistancePrice climbed after the bullish headshup we had on Friday
Strong bullish signs: strong close with little selling at the top, Closing above horizontal resistance and previous daily high
Warning signs:
1)Still bellow major LT MAs
2)Volume is not picking up, decline from Friday and bellow 7 day avg.
Should be cautious with Longs at this point
Current action: No action

NQ Power Range Report with FIB Ext - 3/25/2025 SessionCME_MINI:NQM2025
- PR High: 20366.25
- PR Low: 20342.25
- NZ Spread: 53.5
Key scheduled economic events:
10:00 | CB Consumer Confidence
- New Home Sales
Weekend gap remains unfilled and untested
- Return to daily Keltner average cloud above 20276
- Retracing below previous session close, holding in the highs
- 180+ point value increase above previous week auction
Session Open Stats (As of 12:55 AM 3/25)
- Session Open ATR: 446.54
- Volume: 25K
- Open Int: 227K
- Trend Grade: Neutral
- From BA ATH: -10.3% (Rounded)
Key Levels (Rounded - Think of these as ranges)
- Long: 20954
- Mid: 19814
- Short: 18675
Keep in mind this is not speculation or a prediction. Only a report of the Power Range with Fib extensions for target hunting. Do your DD! You determine your risk tolerance. You are fully capable of making your own decisions.
BA: Back Adjusted
BuZ/BeZ: Bull Zone / Bear Zone
NZ: Neutral Zone

Today analysis for Nasdaq, Oil, and GoldNasdaq
The Nasdaq closed higher, forming a gap up on the daily chart. It showed a strong, one-directional rebound up to the 5-week moving average on the weekly chart.
Since the 5-week MA overlaps with the 60-week MA, it's unlikely to break through easily without a short-term correction.
On the daily chart, the MACD has formed a golden cross, meaning that even if a pullback occurs, the strategy should remain buy-on-dip oriented.
There is still an open gap down to 19,960, which could be filled at any time—so it's important to consider the possibility of a retest of that level. If the gap is filled, that area could be a good support zone to buy from.
On the 240-minute chart, strong buying momentum entered around the zero line, confirming a breakout after basing in a range. Therefore, buying on pullbacks remains the preferred approach in this structure.
Crude Oil
Crude oil continued its upward move, closing higher on the daily chart.
With strong support around the $68 level, the market could potentially rise toward the $70 zone, and possibly test resistance between $70–$71, which is a key area to watch closely.
Overall, traders should continue to buy on dips, but be cautious with chasing long positions above $70. If taking short positions, they should be managed with tight stop-losses.
On the 240-minute chart, oil appears to be in the midst of a third wave rally, so any short positions should be considered above $70, while buying pullbacks remains valid.
Current Middle East tensions and U.S. sanctions on Venezuelan oil are contributing to a supply risk premium in oil prices.
Since the market is recovering from the lows and showing a positive technical setup, short trades should be managed carefully with proper risk control.
Gold
Gold closed lower, remaining within its range-bound structure. On the daily chart, gold is currently trading between the 3-day and 5-day MAs above, and the 10-day MA below, forming a narrow consolidation zone. This makes sell-at-highs and buy-at-lows strategies effective.
Since there's room for a pullback to the 5-week MA on the weekly chart, chasing longs is not advised. If the MACD crosses below the signal line, this could create a bearish divergence, leading to potential sharp downside, so caution is warranted.
On the 240-minute chart, the MACD is failing to break above the signal line and continues to decline. However, since the signal line remains above the zero line, a rebound attempt is likely, even if the MACD dips below zero.
Given the current slope and distance, it's unlikely that a golden cross will form soon. Also, traders should keep in mind that major economic data such as GDP and PCE reports are scheduled later this week, which could influence market direction.
If you can understand the daily chart structure, you can better anticipate intraday high/low ranges and potential wave patterns. Make it a habit to perform thorough daily chart analysis each day, and prepare a trading scenario that suits the market’s behavior. As always, questions are welcome.
Wishing you a successful trading day!
If you like my analysis, please follow me and give it a boost!
For additional strategies for today, check out my profile. Thank you!
NAS Futures LongNQ1! long the regression break - There are many options this morning as there has been many moves across the USA.

MNQ!/NQ1! Day Trade Plan for 03/24/2025MNQ!/NQ1! Day Trade Plan for 03/24/2025
*LAST UPDATE FOR THIS WEEK*
📈20370 20420
📉20140 20090
Like and share for more daily NQ levels 🤓📈📉🎯💰
*These levels are derived from comprehensive backtesting and research and a quantitative system demonstrating high accuracy. This statistical foundation suggests that price movements are likely to exceed initial estimates.*

NQ Power Range Report with FIB Ext - 3/24/2025 SessionCME_MINI:NQM2025
- PR High: 20102.50
- PR Low: 20050.50
- NZ Spread: 116.5
Key scheduled economic events:
09:45 | S&P Global Manufacturing PMI
- S&P Global Services PMI
Unfilled weekend gap up of 0.38% above the session open
- Gap fills below 19978
- Auction return to previous week's highs
Session Open Stats (As of 12:15 AM 3/24)
- Session Open ATR: 458.01
- Volume: 54K
- Open Int: 226K
- Trend Grade: Neutral
- From BA ATH: -11.2% (Rounded)
Key Levels (Rounded - Think of these as ranges)
- Long: 20954
- Mid: 19814
- Short: 18675
Keep in mind this is not speculation or a prediction. Only a report of the Power Range with Fib extensions for target hunting. Do your DD! You determine your risk tolerance. You are fully capable of making your own decisions.
BA: Back Adjusted
BuZ/BeZ: Bull Zone / Bear Zone
NZ: Neutral Zone

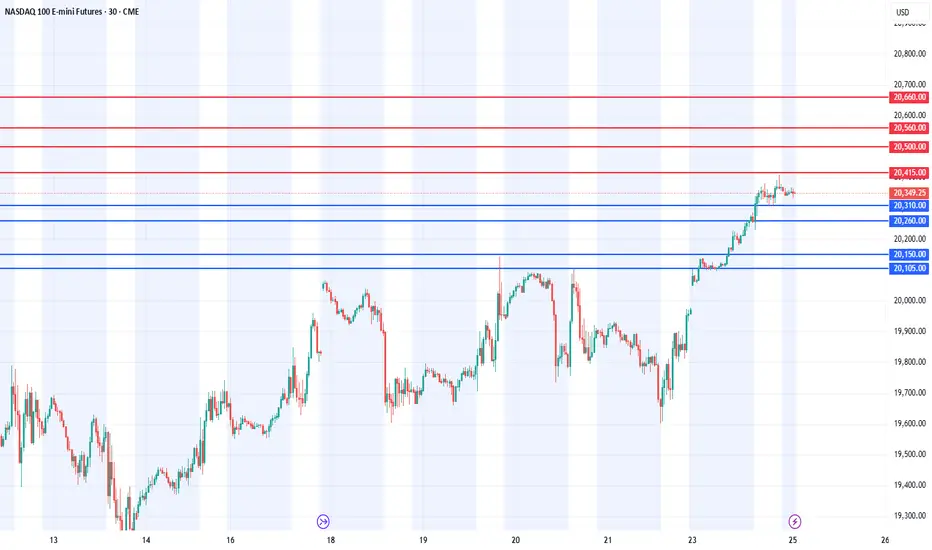
simple analogy to 20kFollow through with indicators, buy area, sell area, and volatility, looking for mid-20k

#202512 - priceactiontds - weekly update - nasdaq e-mini futuresGood Day and I hope you are well.
comment: Bulls were not strong enough to trap late bears and every bear selling below 19700 had multiple chances of exiting break-even or even with a profit. I still think we need to see a bigger bounce but for now market is in balance at 19800, which is bad for the bulls. We need to form a proper channel down and going sideways to do so would be amazing for the bears and a show of big strength by them. 23 days earlier we were trading couple points below ath. Volume last week was low but I can’t see this breaking down again this early after that much selling. I still expect 20400/20700 to be hit next week. Anything above would be bad for bears.
current market cycle: strong bear trend but pullback expected
key levels: 19300 - 20700
bull case: Bulls stopped the selling and printed a green week, which was only due to a 100 point rally in the final 10min of Friday. They are expect to bounce this higher but for now it’s not happening. Their first target is a daily close above 20k and next would be the daily 20ema around 20300. Market has now touched the bull trend line from 2023-01, 3 times and it also touched the monthly 20ema 3 times with it. I can not see this just breaking down below it, without a bigger bounce.
Invalidation is below 19100.
bear case: Bears showing incredible strength by keeping the market mostly below 20k. They even printed a couple ticks below the previous low on Friday, which means lower lows and higher highs and that’s always something that happens in trading ranges, not in trends. Bears are fine with going sideways because they can hold on to longer term positions comfortably. As long as any bounce stays below the 50% retracement to 20700, bears are good and expect more selling after we have formed a proper channel. You can never expect a -14% move to just get more follow-through selling after a couple of days. If any market does it, it’s a parabolic climax which can go on for long but are unsustainable. My best guess on how the next weeks could play out is in my chart since last week and is valid until market does something very different.
Invalidation is above 21100.
short term: Still… Heavy bullish bias for 20000 and likely 20400. Above 20500 air would get real thin again, if this was the start of a bear market. For now I think the pattern from 2024-07 is more likely to repeat than the bear trend as drawn on the chart. No updates since we moved sideways. Important to note, again, is that the longer the market stays at these lows, the more accepted the prices are and the higher the odds of another strong leg down.
medium-long term - Update from 2024-03-16: My most bearish target for 2025 was 17500ish, given in my year-end special. We don’t know if we have printed the W1 of the new bear trend or repeat the pattern from 2024, where we sold of very strong to reverse even more strongly and make new all time highs. Market needs a bounce and around 20000/20500 we will see the real battle for the next weeks.
current swing trade: None
chart update: Updated the possible bear trend and added a bullish alternative to show what we did in 2024. For now the bullish path is more likely.

$NQ IdeaAnalyzing the NQ for the upcoming week, we observe that the price held at the monthly OB, where an SMT also formed, reinforcing the indication of a bullish continuation from that point.
On the daily chart, we identify a shift in market structure, evidenced by the presence of an SMT + MSS, followed by a continuation purge of the price. Given this, we understand that our weekly DOL will initially be the daily CRT High and the Weekly FVG, although the final target may be the monthly Range High.
Additionally, based on the economic calendar, we anticipate more significant movements on Monday, Thursday, and Friday due to news related to the dollar.
It is important to emphasize that this analysis is based solely on price action, and macroeconomic factors may impact the market throughout the week. Therefore, we must be prepared for potential changes in the scenario.

NQ weekly review and outlook for next weekExpect a buyside run on NQ towards weekly FVG coupled with daily arrays. IRB on the weekly

GOLD 24.03.2025-28.03.2025Expecting a meltdown on GOLD. Weekly retracement profile. Against the overall bullish orderflow. Risky. but thats the thought. I will only hunt for shorts

Enhance Your Trading with Dual MACD OverlaysBy using two MACD overlays—one based on the current timeframe and another on a higher timeframe—you gain a more comprehensive view of market momentum. This approach helps identify short-term opportunities while aligning trades with the broader trend, reducing false signals. As seen in my chart, combining multiple MACD perspectives can improve decision-making and trade timing.
Try it out and refine your strategy with better trend confirmation!

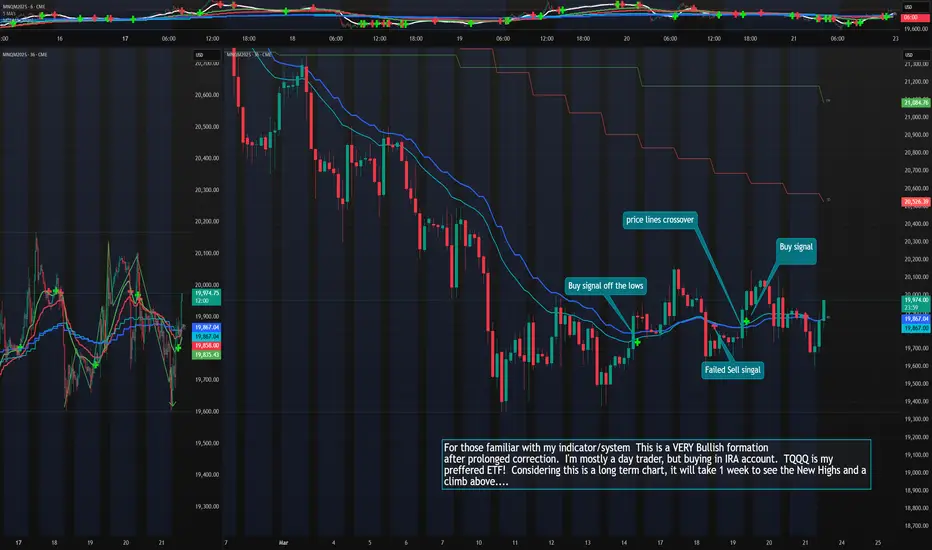
NQ, TQQQ, QQQ going up!! I say, time to buy.My indicator issued a buy signal. All the explanations are on the chart. It is a 3 hour chart so takes time to play out. we will see higher higher within 1 week, based on my experience.