RTY UpdateMFI dropping fast, but RTY barely even dipped. There's a weird short squeeze on garbage stocks today. AFRM, PTON, BYND, TSLA (lol) all green by a lot.
No trades, but I'm hoping for the market to tank so we finally get some tradable action.
Note: Some of the garbage stocks appear to have rolled over, might be a play there.
RTY1! trade ideas

RTY MFI OverboughtYeah, I said overBOUGHT. That means don't BTFD.
Wanted to post this early since I said BTFD earlier this week. I have NO intentions of going long today. Will post ES and NQ updates later since they are not overbought yet.
Also, I was right about playing GM puts for TSLA earnings, looks to be 175% return on open. I didn't play it, lol. Gonna kick myself on this one, I mentioned it twice before close yesterday.

RTY UpdateJust drifting sideways, indicators are neutral. I think MFI goes oversold tomorrow morning on RTY and ES, will wait until then to BTFD, lol.
I think it's gonna be a whipsaw day. Futures need to sell off but lots of dip buyers already. Slept in (kinda obvious now, lol) because I was all cash, no positions. Will take a potshot at the market again tomorrow if indicators go oversold.
No idea which way the market gaps tomorrow, I'm not bullish on TSLA earnings. FDAX MFI is dropping but the index isn't. Maybe another small gap down again? i dunno.
Really thinking it might be a good time to take a break from the market... but PCAR earnings next Tuesday. Maybe after that.

RTY UpdateRSI hit overbought and stalled, MFI is overbought.
Appears to be a rotation from small cap to tech, took the easy money and dumped my long positions

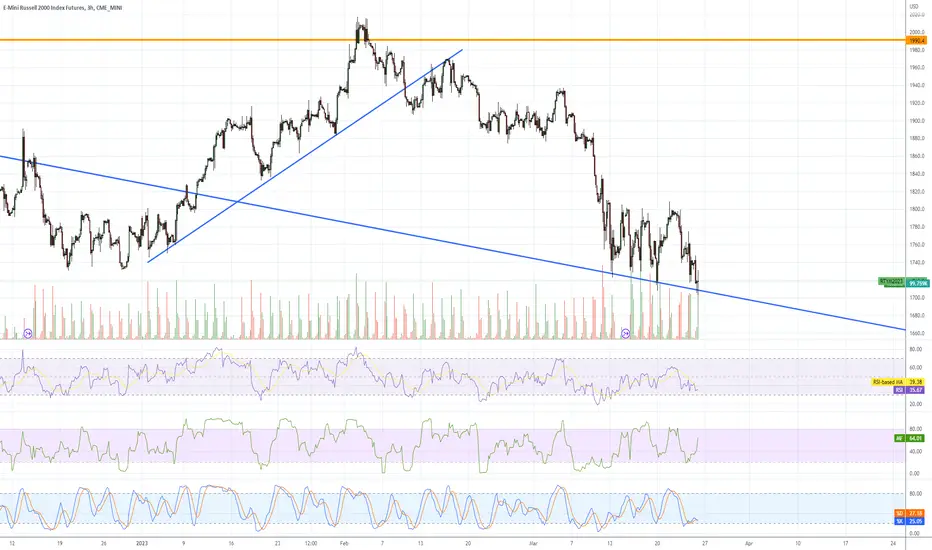
SMALL CAPS: Russell 2000 Futures (RTY)The current price consolidation resembles the previous three formations which were a precursor to a price advance.
In order for the index to confirm that a new short term bullish reversal has commenced, following is required:
1. Strong candle structure i.e. large green candles that produce a shift out of the consolidation zone.
2. A break above the current range highs. This level is at 1816.
A WEEKLY CLOSE below 1735 would negate this structure.

RTY UpdateCPI pump and dump as predicted, RTY went overbought on RSI with MFI divergence.
Fed meeting minutes at 2pm, unemployment and PPI numbers premarket tomorrow and retail numbers premarket Friday. Garbage stocks didn't even last 15 minutes, lol. PTON shot down so fast I couldn't even catch up to it. Managed to snag a few BYND puts, we'll see where taht goes.
Might snag some CAT puts EOD for unemployment number tomorrow.

RTY MFI OverboughtRTY MFI is overbought as is YM, but all other indices including ES, NQ, FDAX, and GC1! (gold) are all neutral. Not getting the pre-CPI pump I expected so far.
Might just sit this week out, not feeling all that well. Don't need the heartburn, lol.

long position on RTYMy strtegy is based on price action with the reading of certain indicators that I like whilerespecting all the values that define the stock maket

small cap setupBuy: 1768 or lower
Stop: 1751
Notes: maybe small caps get close some of the wide performance gap so far this year
The model:
The Ingenuity Trading Model is a Geometric Markov Model with specific inputs related to Price, Time, Volume , and Volatility. The model attempts to predict local minimums and maximums in price on a daily and weekly basis. A fancy way of saying a trading system that detects specific patterns in price, time, volume, and volatility and indicates whether to buy or sell.
On winning trades after 1 day take at least ⅓ of the position off and move stop to breakeven

Russell2000 H4 Potential Pitchfork Play Targeting 1850In this update we review the recent price action in the #Russell200 emini futures contract and identify the next high probability trading opportunity and price objectives to target

RTY UpdateES and NQ MFI are creeping up because they went oversold yesterday but RTY MFI is dropping because it hi overbought this morning. Also, FDAX MFI hit overbought, so high probability of a gap down tomorrow or every index.
ES and NQ might melt up today but watch out for the gap tomorrow and I'd shy away from small caps.
Still all cash, waiting for Friday CPE numbers.

RTY UpdateThe algos are pumping money into RTY trying to hold that blue line. You can see MFI climbing.
Problem is MFI will go overbought Monday so we'll see a drop Tuesday, if not Monday afternoon. Plus Euro markets tanked so we might even see a gap down Monday. Seems to me garbage stocks are done tanking so there's really no choice but to go long here.
Crappy whipsaw market to trade.
RTY UpdateNo idea what the other indices are doing, looks like a melt up on ES and NQ because MFI is dropping while RSI is rising.
RTY is oversold, and PTON is up so it means short squeeze time, lol. Small long position, don't need the heartburn.

Elliott Wave Projects Zone where Russell (RTY) Rally May FailRussell 2000 (RTY) ended a 3 swing corrective rally from 10.13.2022 low at 2016.90 on 2.2.2023 high. From this level, the Index declines lower with internal subdivision as a 5 waves impulse Elliott Wave structure. Down from 2.2.2023 high, wave ((i)) ended at 1906.2 and rally in wave ((ii)) ended at 1970.10. The Index resumes lower in wave ((iii)) towards 1728.5 and wave ((iv)) rally ended at 1800.8. Final leg wave ((v)) ended at 1708 which completed wave 1 in higher degree. Rally in wave 2 is now in progress to correct cycle from 2.3.2023 high in 3, 7, or 11 swing before the decline resumes.
Internal subdivision of wave 2 is unfolding as a zigzag Elliott Wave structure. Up from wave 1, wave ((a)) ended at 1779.4 and pullback in wave ((b)) ended at 1750.40. Wave ((c)) higher is in progress as 5 waves. Up from wave ((b)), wave (i) ended at 1808.2 and wave (ii) pullback ended at 1785.30. Expect the Index to extend higher before it completes wave ((c)) of 2. Potential target higher is 100% – 161.8% fibonacci extension of wave ((a)). This area comes at 1821.4 – 1865.4 where the rally in Russell may fail and the Index starts to resume lower. As far as pivot at 2.2.2023 high at 2016.9 stays intact, expect rally to fail in 3, 7, or 11 swing for more downside.

RTY UpdateAppears to be a complete pump and dump failure. I got bullish because of the buy volume the past couple of days, but it hit overbought on MFI and now is dropping. i think there's potential for it to stay oversold for a day or two when it gets there because it's dropping on much lower volume. Those that bought have to sell, and volume isn;t matching up yet.

Continued weakness on small caps or we could see reversal soon.?REjection of support level 3 (1730) three times in a row.
I think we could see this moving higher at least for short term.


Russell2000 False Break PlayIN this update we review the recent price action in the Russell2000 emini futures contract and identify a high probability trading pattern and price objectives to target

RTY UpdateRSI oversold again, but I wouldn't consider going long until ES and NQ also go oversold.
ES MFI has a LONG way to go before it hits oversold. Plus the market gave up on the short squeeze and lost all interest in garbage stocks. PTON down 7% now. Friday is when funds rebalance their portfolios, and I'd imagine they'd want to get rid of garbage stocks and move to dividend stocks. Flight to safety trade tomorrow, I think. Problem is ES MFI needs to go down....

RTY UpdateRSI hit oversold, MFI has stayed oversold.
No idea about gap direction tomorrow, but I'm sure this throws a reversal pattern.

looks creepysad but true salaries are runteeo rodeo onward, how to spend money when you are a fraud? wisely, yes...


RTY UpdateNot at all what I expected today, small caps leading the market down. I don't recommend a long position until RTY goes oversold.
Asia and Europe usually don't pump small caps, so it's probably toast this week. Chart pattern is extremely bearish.
