RTY UpdateRTY remains the only index futures with an open gap, but it looks like it's coiling.
Not really sure what the heck this market is doing, might be easier to buy back in when it goes oversold again since it still needs a gap fill. I think I'm gonna take a break this week.
RTY1! trade ideas

Long Russell! - Trading w Commercials - Fading Speculators (COT)Looking at the net positions of the Commercials (Red Line), the Russell 2000 is at record high levels. Additionally, the small speculators (Blue Line - tough to see but it's blown up on lower indicator)) are very short compared to historical levels. The COT index on the bottom shows dark green when both commercials are maxed net long and small speculators are maxed net short. Use a daily chart with your favorite indicator/candlestick pattern to look for entry - be patient - don't forget a stop. See below for explanations of what you're looking at and what I'm talking about with COT
RISKS: The trend is down which makes this counter-trend trade
COT Definitions:
- COT: Commitments of Traders Reports - A weekly report published by the government (CFTC) that shows long and short positions of the below 3 groups (As well as much more data I don't look at). We look at the NET positions of these 3 groups and compare them to historical levels to signal trade opportunities
1- Commercials: Hedgers - We want to trade with them when they're at extreme levels (Think Tyson, Cargill, General Mills, etc)
2- Large Speculators: Hedge funds and large institutions - We want to fade them when they are at max positions (Think suits in NYC and commodity funds)
3- Small Speculators: People/institutions trading small lot sizes not big enough to report to CFTC - We want to fade their max positions as well since they represent the public (Think dude in his PJs trading and small trading firms)
Indicators on Chart:
- The first indicator shows the net positions of the 3 groups above plotted over time
- The second indicator is an index of the relative buying/selling of commercials over a certain lookback period. Anything above 95 is looking for buy, look to sell when it hits 0
- Note: Just because the Commercial's net position is negative doesn't mean it can't be relatively net long and signal a buy (same in the opposite scenario)
Trade Setup - Both Must Happen:
- When commercials are at max levels we are alerted to buy or sell (Depending on the criteria above)
- On a daily chart, use technical indicators, candlestick patterns, news, etc to enter the trade (not shown here)

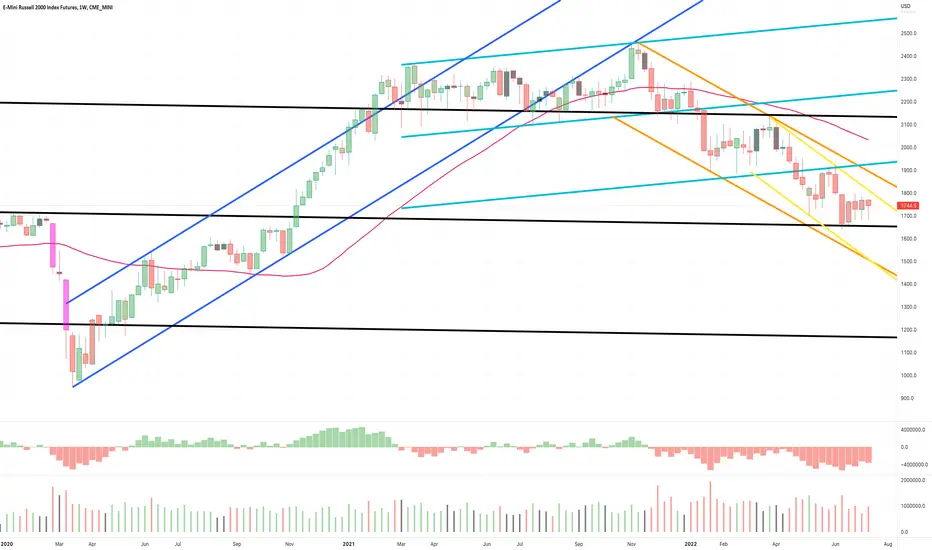
RTY1! - Weekly Market Update, 7/18/22Russell Futures remain bound by support below and resistance above which leaves us little to no opportunity to confirm a trade idea for this upcoming week.
This market like the other indexes remain very rangebound seeking a catalyst to drive prices in a direction.
Support and resistance structures have been adjusted accordingly for you review and reference.
I do not see any actionable ideas at this time. I will update midweek if need be.
Wish you many blessings and much prosperity!
M2K - Daytrading - Micro E-mini Future Russell 20002022-07-14 M2K 1 contract Period 15 minutes DayTrading
4 wins/4 trades, 100%
Points x 5$, minus 2$ (fess and slippage) by trade
Trades activated on signals at the bottom pane
and or by connecting to Moving averages
These Ma are the basics ones :
Ma18-21 red Ma50 green
Ma100 blue Ma200 orange

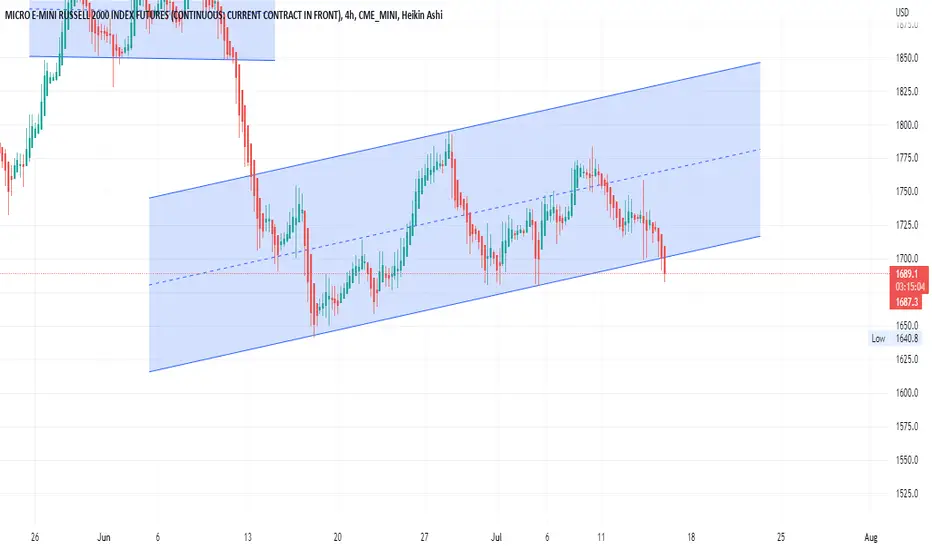
MICRO E-MINI RUSSELL 2000 INDEX FUTURES (CONTINUOUS: CURRENT CONVery strong downward momentum and God willing to continue his strong relegation and achieve good bottoms and can break us a strong call for the future
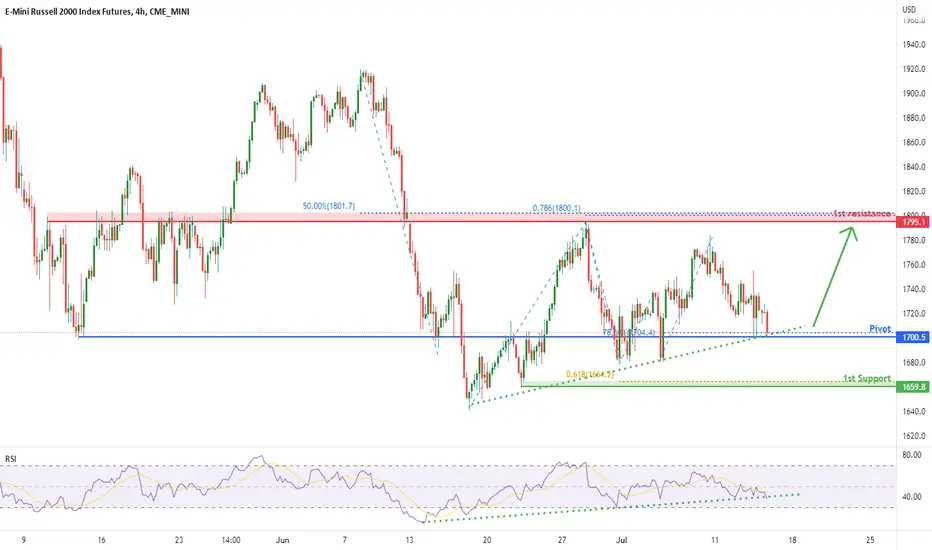
Potential Bullish ContinuationTitle: Russell 2000 Index Futures ( RTY1! ),H4 Potential for Bullish Rise
Type : Bullish Rise
Resistance : 1795.1
Pivot: 1700.5
Support : 1659.8
Preferred Case: On the H4, with price moving in an ascending trendline on the RSI , we have a bullish bias that price will reverse off the pivot at 1700.5 at the pullback support in line with the 78.6% fibonacci projection to the 1st resistance at 1795.1 at the pullback swing high in line with the 50% fibonacci retracement and 78.6% fiboancci projection.
Alternative scenario: Alternatively, price may break the support structure at the pivot and drop to the 1st support at 1659.8 at the swing low in line with the 61.8% fibonacci projection .
Fundamentals: Equities continue to experience a volatile summer trading season as Russell 2000 futures continue to trend lower, giving us a bearish bias on Russell 2000.

Potential Bullish ContinuationTitle: Russell 2000 Index Futures (RTY1!),H4 Potential for Bullish Rise
Type : Bullish Rise
Resistance : 1795.1
Pivot: 1700.5
Support : 1659.8
Preferred Case: On the H4, with price moving in an ascending trendline on the RSI, we have a bullish bias that price will reverse off the pivot at 1700.5 at the pullback support in line with the 78.6% fibonacci projection to the 1st resistance at 1795.1 at the pullback swing high in line with the 50% fibonacci retracement and 78.6% fiboancci projection.
Alternative scenario: Alternatively, price may break the support structure at the pivot and drop to the 1st support at 1659.8 at the swing low in line with the 61.8% fibonacci projection.
Fundamentals: Equities continue to experience a volatile summer trading season as Russell 2000 futures continue to trend lower, giving us a bearish bias on Russell 2000.
M2K - Daytrading - Micro E-mini Future Russell 2000M2K 1 contract Period 15 minutes DayTrading
5 wins/ 6 trades, 83%
Points x 5$, minus 2$ (fess and slippage) by trade
Trades activated on signals at the bottom pane
and or by connecting to Moving averages (Ma)
These Ma are the basics ones :
Ma18-21 red Ma50 green
Ma100 blue Ma200 orange

Stock Market Today, Stuck in This RangeAfter the inflation announcement, the stock market continued its downward trend from earlier this week.
Those who followed yesterday's Nasdaq technical analysis knew we expected price to drop and test lower critical levels. Following that dip, buyers brought all the main indexes back to the top, as seen in the video below.
Trading ranges are characterized by a "tie" between bulls and bears. As such, it's a day of long-term consolidation.
Ping-pong-like price action. When prices rise, long traders sell and leave their positions rather than adding to them. Short sellers will seek fresh positions. When the price reaches the bottom of the range, short sellers will buy to finish their shorts and fresh bulls will start new longs. Traders don't think stock market movements will continue, therefore they depart and gamble on a reverse.

RTY UpdateMFI went oversold this morning, and you can see RTY is coiling.
CPI release tomorrow morning before market open, the market tanked before the last release, so if it doesn't tank before EOD it's a bullish sign.
Normally I would say this is a continuation pattern, but the algos need to fill he open gap. If it breaks upwards then the target is the resistance zone, upper orange line. Plan accordingly.
If you're short, you'll want to bail tomorrow if the market goes green at all. I'm all cash, even garbage will float on a rising tide. Wouldn;t surprise me at all if they pump even shitcoin.

RTY UpdateThis morning's selloff sent all indicators to neutral. Everything was overbought last week in a weird melt up.
ES, NQ, RTY all have similar indicator patterns. I'm hoping the indicators start cycling from overbought to oversold again, because that's the easiest time to make money.
I get the weird feeling we see a bounce tomorrow then only a mild drop Wed, but who knows. Market could completely tank again, lol, but at this point I think 75 is priced in for the next Fed meeting. This week is all about the CPI and market reaction to it. I don't think indicators will matter much.
Really don't feel like trading this week. I shifted my BITO (shitcoin) puts to a lower strike and next week's expiration since BTC tends to tank on weekends and CPI numbers coming out Wed. Just a small play, a couple grand including today's profits.

RTY1! - Russell 2000 Weekly Analysis, 7/11The slightly descending BLACK channel has served as support for several weeks now.
This market like the other major indexes have been consolidating.
We anxiously await a reversal from here and a break of resistance above OR a breakdown with selling continuation.
Support and Resistance structures have been adjusted for your reference this upcoming week.
Wishing you a blessed and profitable week!
RTY UpdateRealigned the overlay, bad news doesn't matter the algos want the gap fill.
Probably staying out of the market for a week or two since it could wind up being a melt up, will still post updates if I wake up early enough

M2K Micro E-mini Future Russell 2000M2K 2022-07-07 Dau trading in 15 minutes period
Trade #1
-Buy on open at 9h30, because the trend is up as the Ma18-21 // (double red lines) is moving up
- No Lmt order used on this trade
- First Stop placed under the 9h15 candle Low
- Next stops are following under Ma12 (turquoise step line)
- Or Stop placed under successive higher lows
- Also may appear a reversal \\// of the signals at the bottom pane, for a possible ending
of this trade, but not necessarily, depending of the protective following stops success
Note that at 14h30 Bollinger-Bands are beginning to rectact

RTY UpdateLOL, i slept in and missed the morning pump. I was all cash.
I think the overlay is a bit too bullish, but I also think the RTY gets a gap fill tomorrow. We could see a possible sector rotation instead of an all out rally.
My play is to short EOD tomorrow, not chasing the pump. Earnings season coming up end of month (EOM), and Fed minutes had nothing positive in it.
Remember the last time the market pumped Fed meeting minutes it was a Thu/Fri pump. I guess the same here.

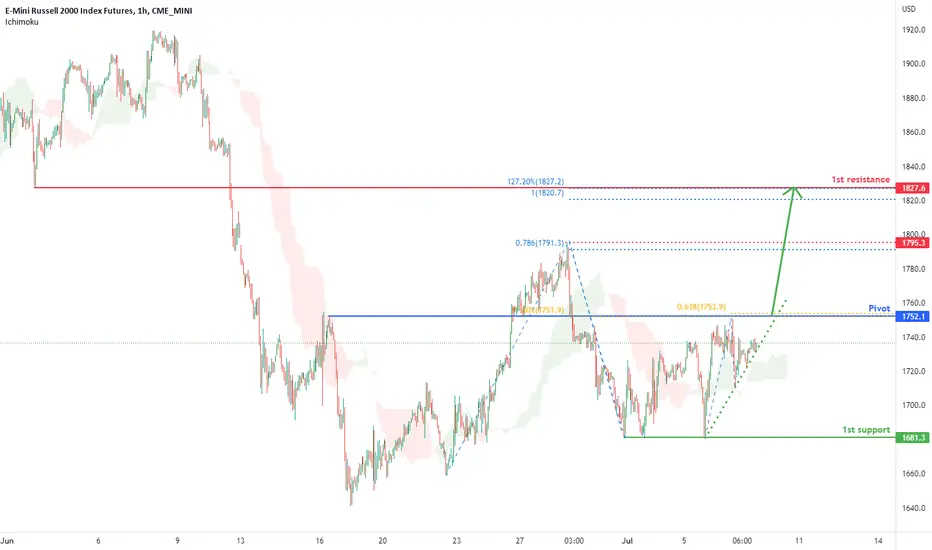
Russell 2000 Index Futures (RTY1!),H1 Potential for Bullish RiseType : Bullish Rise
Resistance : 1827.6
Pivot: 1752.1
Support : 1681.3
Preferred Case: On the H4, with price moving above the ichimoku cloud and along the ascending trendline, we have a bullish bias that price will rise to the pivot at 1752.1 in line with the overlap resistance, 61.8% fibonacci projection and 61.8% fibonacci retracement . Once we have upside confirmation that price has broken past pivot , we would expect bullish momentum to carry price to the intermediate resistance at 1795.3 in line with swing high resistance and 78.6% fibonacci projection . Should price break intermediate resistance, we would have a bullish bias that price would rise to the 1st resistance at 1827.6 where the pullback resistance, 100% fibonacci projection and 127.2% fibonacci extension are.
Alternative scenario: Alternatively, price may drop to the 1st support level at 1681.3 in line with the swing low support.
Fundamentals: Equities continue to experience a volatile summer trading season as Russell 2000 futures continue to trend lower, giving us a bearish bias on Russell 2000.

Russell 2000 Index Futures (RTY1!),H1 Potential for Bullish RiseType : Bullish Rise
Resistance : 1827.6
Pivot: 1752.1
Support : 1681.3
Preferred Case: On the H4, with price moving above the ichimoku cloud and along the ascending trendline, we have a bullish bias that price will rise to the pivot at 1752.1 in line with the overlap resistance, 61.8% fibonacci projection and 61.8% fibonacci retracement . Once we have upside confirmation that price has broken past pivot , we would expect bullish momentum to carry price to the intermediate resistance at 1795.3 in line with swing high resistance and 78.6% fibonacci projection. Should price break intermediate resistance, we would have a bullish bias that price would rise to the 1st resistance at 1827.6 where the pullback resistance, 100% fibonacci projection and 127.2% fibonacci extension are.
Alternative scenario: Alternatively, price may drop to the 1st support level at 1681.3 in line with the swing low support.
Fundamentals: Equities continue to experience a volatile summer trading season as Russell 2000 futures continue to trend lower, giving us a bearish bias on Russell 2000.
RTY UpdateStill tracking the overlay more or less, but it all depends on the reaction to the Fed meeting minutes this afternoon. Appears that's when it will break up or down.
DUmped my calls, on open. Didn't like the way futures trading looked, actually a couple hundred on EWY but made money on the rest. Glad I flipped because GM tanked right after.
Next time the market pumps garbage stocks, I guess I have to bet on garbage stocks. Asia is a bit unpredictable and transports are weak. Can't just bet on your favorite sectors I guess.
If anything the right thing to do was flip EOD yesterday and short China, lol. PDD down quite a bit

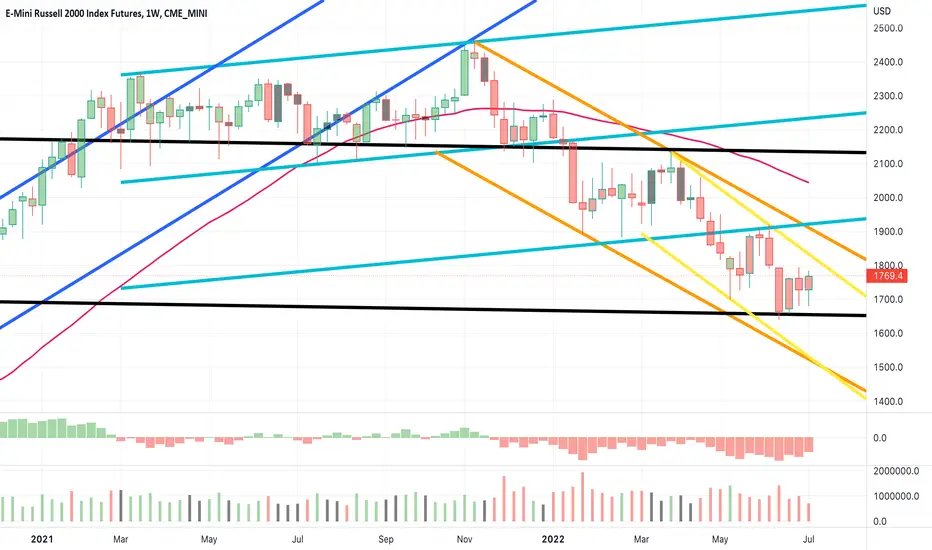
RUSSELL 2000 respecting FIB levels; ABC may reach 1500 vol zone.The smallcaps Russell 2000 futures RTY1! (also the IWM etf), a leading market indicator like the transports, may complete an A=C correction ending in the volume profile zone near 1500. (IWM seems to be consolidating in tranches of 200…ex…230, 210, 190, now @ 170 & maybe 150 around 4Q2022.) This will complete the final wave 5 of C-wave.
As you can see in this weekly chart, Russell 2000 respects impt FIB levels. 2100 zone is Fib 0.236, 1900 is Fib 0.383, the current 1700 zone is Fib 0.50 & the projected 1500 bottom zone will be Fib 0.618, the most likely zone for a reversal.
THE BULLISH CASE: if Russell 2000 holds the 1700 zone, the bounce will be very quick due to the 2 LOW VOLUME zones. The target will be 2100 with some consolidation near the 1900 zone.
Not trading advice

M2K - Daytrading - Micro E-mini Future Russell 2000 Day Trading with the M2k using 1 contract
- Periods set ar 15 minutes each
- Moving averages used :
Ma18 red; Ma21 red; Ma12 turquoise step line; Ma50 blue; Ma100 green; Ma200 orange
- Bottom pane, 3 indicators with each its Ma:
Stoch RSI; CCTBBO; CCIOBV

M2K - Daytrading - Micro E-mini Future Russell 2000M2K Daytrading 2022-07-05 15m periods
Moving averages, Bollinger-Bands and three indicators are used to pulse trades.
As of AMP broker, the fees are calculated at 1.00$/trade (in-out), pl;us I add a 1.00$ slippage.
Not all of these trades, nor none, have been executed.

M2K - Micro E-mini Future Russell 2000Day trading of the M2K - Micro E-mini Future Russell 2000 in periods of 15 minutes.
Win 4 on 4 trades : +301$

RTY UpdateRTY MFI went oversold earlier toady though you can;t tell anymore.
In any case, someone asked me for a target, I'll give you 2. First target is the gap fill, and the pumptarded scenario is the overlay.
I am inclined to take the easy money as you guys know by now, lol.
