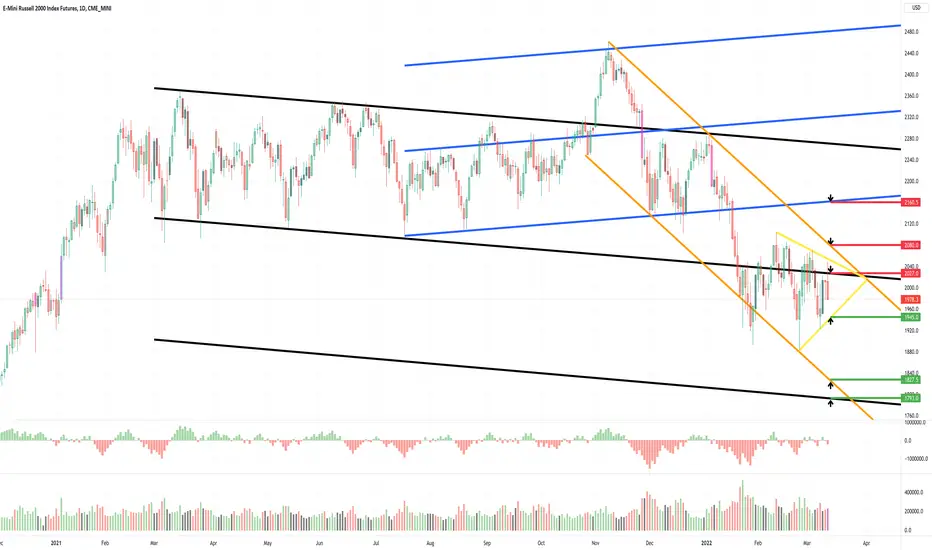
RTY1! - Weekly Market Update, 4/4Indicated areas of support (green) and areas of resistance (red) are ascending (rising) and descending (falling).
These areas indicated suggest support / resistance for the week of April 4 and either rise or fall based on their channel structure ascending or descending.
Please check back for any mid-week updates. You can also follow me on my social networks and my website, all links are located below.
Wishing you a profitable week ahead! Anthony Speciale
RTY1! trade ideas

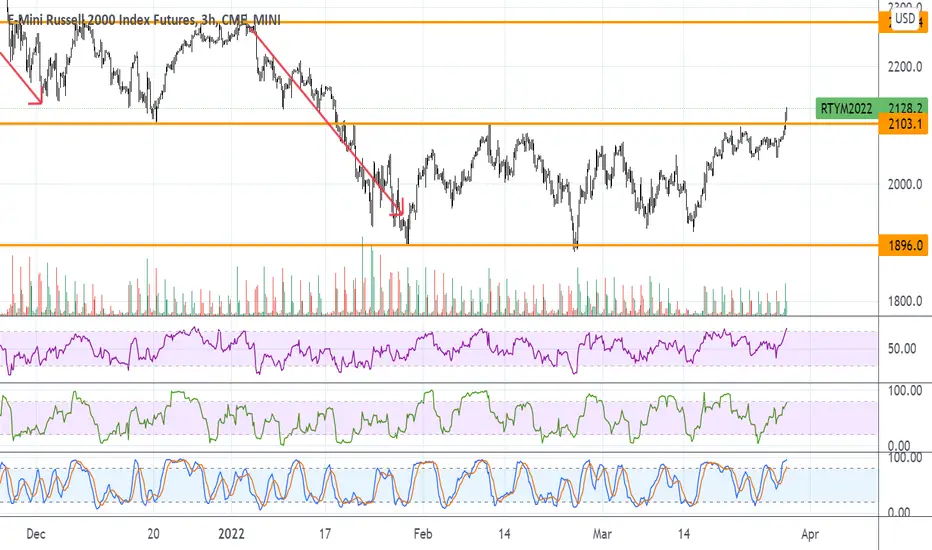
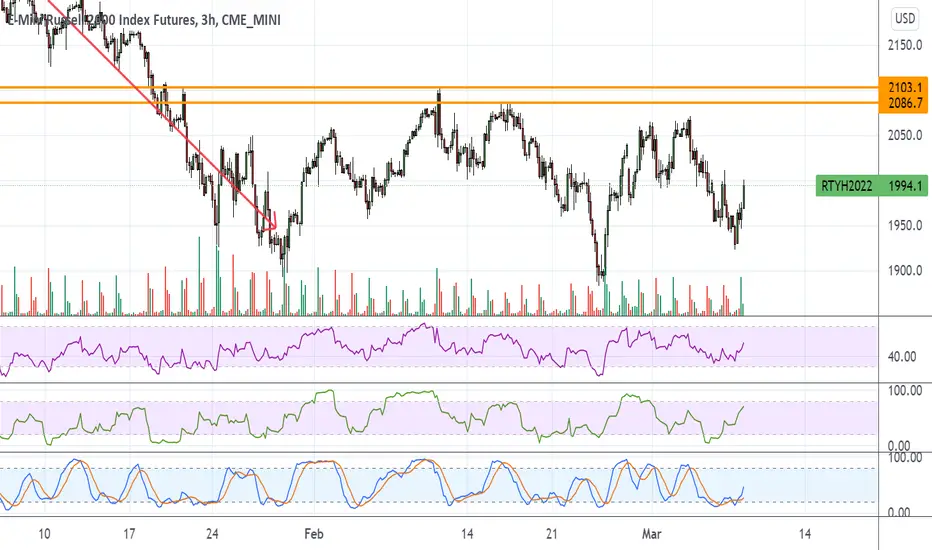
RTY UpdateRSI overbought with MFI divergence, yields and oil rising. I don;t think this is sustainable.
Took a small short position, but I think the reversal is tomorrow.
Russell2000: H&SThe main figure's target, the monthly rectangle, was 80% completed.
Now there seems to be a sufficient Bullish Reversal Pattern, completed yesterday, a Head and Shoulders with final target at 2300.

Russell Monthly Range Resistance FadeInt his update we review the recent price action in the Russell 2000 (futures contract) and identify the next high probability trading opportunity and price objectives to target.

Small Caps look Very BullishThe SPY and QQQ look like they need a rest. However, the RTY looks ready for bullish continuation.

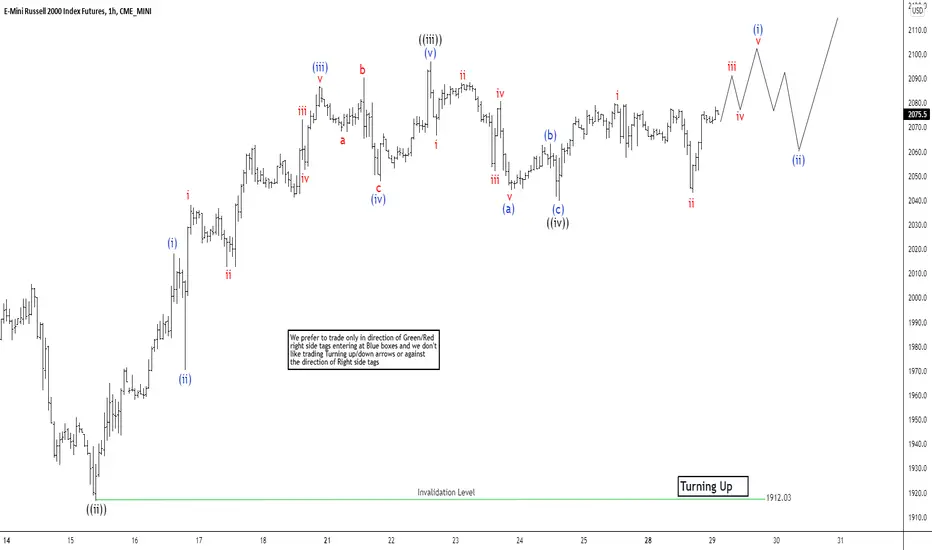
Elliott Wave View: Russell Futures (RTY) Looking to End 5 WavesShort Term Outlook in Russell Futures (RTY) suggests the rally from February 24, 2022 low is in progress as a 5 waves diagonal Elliott Wave structure. Up from February 24 low, wave ((i)) ended at 2071.30 and dips in wave ((ii)) ended at 1911.80. From there, Index resumed higher in wave ((iii)) which ended at 2097. Internal subdivision of wave ((iii)) unfolded as a 5 waves impulse in lesser degree. Up from wave ((ii)), wave (i) ended at 2018.30 and pullback in wave (ii) ended at 1970.30. Index continued higher in wave (iii) towards 2086.90, dips in wave (iv) completed at 2047.90. Final leg higher wave (v) ended at 2097 which also completed wave ((iii)) in higher degree.
Pullback in wave ((iv)) ended at 2039.80 with internal subdivision as a zigzag Elliott Wave structure. Down from wave ((iii)), wave (a) ended at 2044.20, rally in wave (b) ended at 2063.40, and wave (c) lower ended at 2039.80. This completed wave ((iv)) in higher degree. Wave ((v)) is now in progress in 5 waves. Up from wave ((iv)), wave i ended at 2079.90 and pullback in wave ii ended at 2043. Near term, while Index stays above 2039.80, and more importantly above 1912, expect Index to extend higher in wave ((v)). As far as pivot at 1912.03 low stays intact, expect dips to find support in 3, 7, or 11 swing for more upside.
RTY1! Weekly Market Update, 3/28Indicated areas of support (green) and areas of resistance (red) are ascending (rising) and descending (falling).
These areas indicated suggest support / resistance for the week of March 28 and either rise or fall based on their channel structure ascending or descending.
Please check back for any mid-week updates. You can also follow me on my social networks and my website, all links are located below.
Wishing you a profitable week ahead! Anthony Speciale

RTY MFI oversoldJust noticed this, probably means garbage stocks get a pump tomorrow.
ES MFI almost went oversold as well, I think I was too focused on NQ premarket. All indications are a pump tomorrow for Ponzi Friday

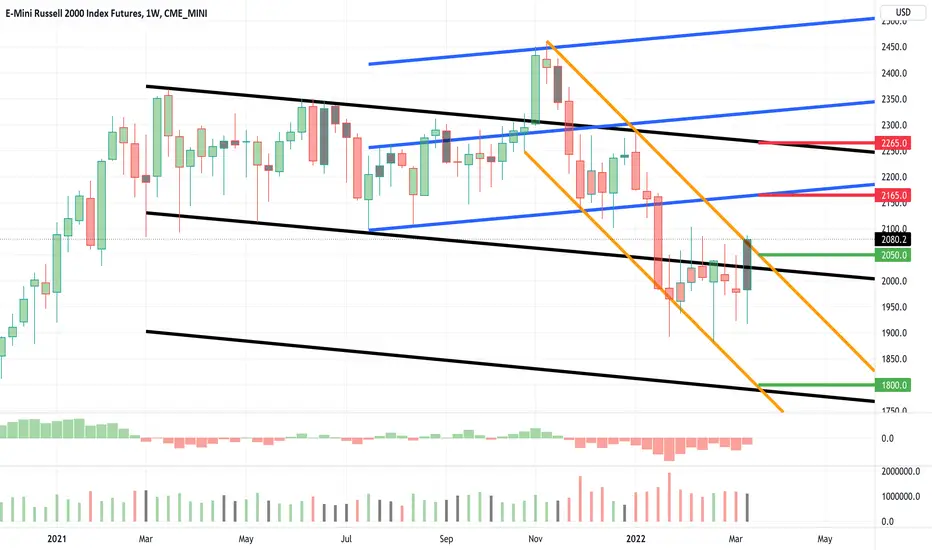
Russell 2000 Futures -20% More$RTY1! lost 50 EMA support and racing to 100 EMA quickly on weekly, looks even uglier on daily as the pullback looks to be gaining momentum.
Next level of interest would be another -20% decline.
Last time this severe of a retreat was realized was March to May of 2020. The recovery was rapid given unprecedented amount of federal stimulus to prop the economy up.
Stimulus is not an option in the face of sharply rising prices with persistent inflation starting to rip across all sectors.
Markets shrugged off initial Fed communications and FOMC 25 bps rate hike, clearly reflecting lack of belief in Central Banks' conviction.
More volatility ahead as recession lurks in the wings and stagflation appears likely without regime change.

RTY UpdateLooks to me like the market just wants to bounce sideways, I hope that's the case because sideways rangebound trading is just about the easiest way to make money.
In any case, if you're still bullish, wait until MFI goes oversold before buying the dip. I woke up late today and missed the morning drop so staying out for now. Garbage stocks are tempting but I'll probably have to wait to see what happens tomorrow.
Might buy a few CHWY puts or something EOD if there's no afternoon rebound.
I told you guys short squeezes always run 3 or 4 days, looks like that's over. Could just go sideways though.
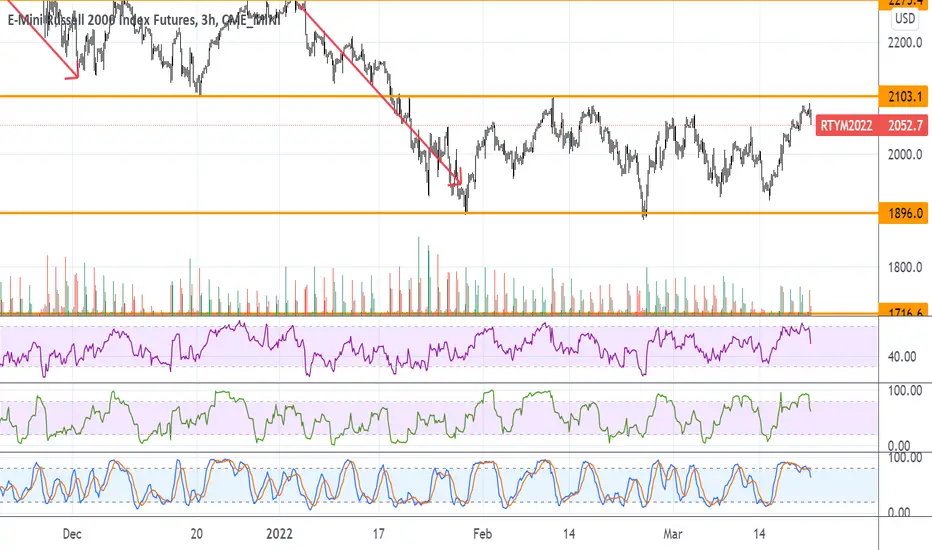
RTY1! - Weekly Update, 3/21Indicated areas of support (green) and areas of resistance (red) are ascending (rising) and descending (falling).
These areas indicated suggest support / resistance for the week of March 21 and either rise or fall based on their channel structure ascending or descending.
Please check back for any mid-week updates. You can also follow me on my social networks and my website, all links are located below.
Wishing you a profitable week ahead! Anthony Speciale
Russell 2k Can't Get Traction TodayNice bull moves in S&P and Nasdaq today, but Russell not joining in the party. Last few hourly bars here showing bulls trying to defend support but bears keep pushing down. I like this for an afternoon short play if market sells off.

RTY1! - Weekly Market Update, 3/14Indicated areas of support (green) and areas of resistance (red) are ascending (rising) and descending (falling).
These areas indicated suggested support / resistance for Monday, 3/13/22 and either rise or fall based on their channel structure ascending or descending.
Please check back for any mid-week updates. You can also follow me on my social networks and my website, all links are located below.
Wishing you a profitable week ahead! Anthony Speciale
RTY ProjectionI thought this crap looked really familiar, here's the COVID rebound upside down.
COVID stocks now tanking much like the way they rose off the bottom, every earnings just gets worse and worse.
I maintain bearishness but watch out for the Fed next week. Also, just because garbage stocks are tanking doesn't mean they tank every day, you can't expect stocks to drop 10% 2 days in a row, which is why I dumped CHWY puts yesterday.
All foreign markets are already at pre-COVID levels which is why they bounced and pumped US futures. US market isn't there yet. NQ might not reach preCOVID levels because FAANG stocks (minus FB) are doing well, but small caps should all return back to pre COVID levels eventually. Some already have....
I no longer care if the weekly goes oversold, there's no appetite for garbage stocks. The weekly indicators stayed overbought for an extended time during the pump. Now everything is inverted.
Gonna be tough trading because the market will gap up more often than not since Europe already hit bottom.

RTY UpdateIt appears the market has lost all appetite for money losing "growth" stocks that aren't growing. My trade strategy is still valid, short garbage on any pops, they can pump futures but they can't make people buy. Let the algos hold the bag.
I think every garbage stock is going to SFIX it's way to single digits, just gotta avoid the pumps, remember the 3 day short squeeze rule (today was the 4th day, lol)
Euros are bullish and could pump futures, but I don't think gap direction matters if today is any indication. I think the market will be oversold for the Fed press conf Wed, so avoid holding a position Wed afternoon regardless of trend pattern.
This drop has nothing to do with Russia, it was DOCU that caused it. I expect a follow through Monday, though it might reverse in the afternoon. Liquidity for crap stocks disappearing quick, look at AFRM, SMSI, DOCU, etc

RTY UpdateRTY MFI overbought again....
It's like they're trying to melt it up for some reason. Really odd considering retail tanked today. Could just be a gap fill attempt.
Whatever, probably best to stay out for a day, most garbage stocks are small cap

AB=CD patternBullish AB=CD pattern developed in the Russel.
Momentum is being bulit.
Still high risk as bearish sentiment still dominates the markets

RTY UpdateMFI overbought but RSI isn;t.
My short squeeze rule is 3 days but lots of stocks that normally fill gaps are just hovering around wondering which wa to go, lol

RTY UpdateRTY MFI almost overbought
My general rule is 3 days for a short squeeze, but I may be looking at puts if RTY MFI gets overbought tomorrow. Might do next week's puts to be safe, Fed meeting and what not. Not to mention I doubt anyone wants a long position over the weekend.
Messy Open but Russell Futures HoldingWhile S&P and Nasdaq futures have fallen after open, the Russell 2k futures are holding. It's a mess but based on action alone could be a long trade here.

Russell Long Off Hourly SupportNice risk reward here long on hourly chart with morning star pattern on support and price extended from 20 ema.


deadline already confirmed, waterfall unevitablethis is always the same. Russell lead, followed by Nasdaq and Dow. When those EMAs cross in the weekly chart, the waterfall is unevitable
