New trading strategy upgrade - Russell 2000Let's wait for a correction overnight and still potential to buy for a short swing.
RTY1! trade ideas

RTY MFI getting close to overboughtAppears small caps will be the first to hit overbought on MFI. Probably an up day tomorrow either way, but we'll see what happen on quadruple witching Friday.
ALl other indices are in the neutral zone

Markets are weak. I sold RTYI sold Russell at 2248. The markets look real weak, more than I see in just a few years. My friend HK_L61 has real good material on her page. check it out. So smart and has so much information.
My opinion, if RTY and more specific M2KZ2021 break below 2213-2215 then markets headed for real big problems. And big profit for me. Of course use good risk management and stop loss. Inflation still concerning in spite for today's news. See how Fed reacts.
My dynamic MA moving down. I will get a entry trigger this hour, so I decide to get head start, with safety. volatility maybe to get very crazy. Buying VIX maybe not a bad idea either.
support for sell:
dynamic moving average falling.
Price repeated rejecting by 20 MA.
Daily trend down, and I see good reason we will just about make a lower low on daily. If so, watch out below!
yesterday lowest volume on 3 month period on Russell.

RTY: One Hour time frame BullishThe RTY one hour time frame is in an up channel.
The market hit the bottom of the channel and
showing signs of pushing bullish towards the top
of the channel.
Entry: Counter trend line break bullish above
the bottom of the channel.
STOP: 2201.8
LIMIT: 2325.00
As long as the market stays above the bottom of
the channel. It will be a good idea to turn to the
five minute time frame and to look for tunnel
trader long / destination trader long opportunities.

Russell20009.12.21 Russell2000 Strategy......................................................................

RTY OversoldES and NQ aren;t quite there yet so a little bit more room down, but I'd expect the market to turn around tomorrow to set up for Ponzi Friday.

Long RUSSELL with Short Term UPTRENDTrend is up on the 4h chart and we are looking for entry before close to the swing low at the bottom of the first blue box.
Drumming down to the 15 minute chart it is evident there has been an accumulation close to the pivot before the impulsive move (big green candles) that created the new swing low.
Looking to buy at the BUY AREA with a Stop Loss set below this area should the trade fail, possibly marking a change of trend direction on the 4h chart.
The only concern is that the Daily trend is more sideways and therefore profit potential is limited and probability of success slightly lowered. This said it is still a great short term trade opportunity.

RTY looking a little shortI have decided to go short on RTY here at 2271. Today might be the day for the big drop, but it do not have to be today. I think we are due for the fall. Volume has been low and my dynamic moving average is starting to curl down. This often is a meaning of volatility going to increase which VIX is showing to already. We have been ranging and I have a tight bollinger. My signal hasnt gone off yet but it will soon even if RTY goes up a bit. Good luck to all!
Ms. Bunny

New trading strategy upgrade - Russell 2000see my trading plan and hope it works. Buy for a long term!

RTY - Russell 2000 a consistent Sell @ HighsIndependent Producers are being systematically crushed, slowly being
wiped off the Competition Map.
The Map itself is on a well defined Roll Up.
Wreck them, collect them.
Master of the obvious type stuff I know but many seem to cling to their
hopes.
The RUT has a large composition of Mixed Bags to hold.
Weightings:
Consumer Discretionary @ 13.1%
Financials @ 15.1%
Health Care @ 21..11%
Industrials @ 15.35%
Information Technology @ 14.13%
Communications, Consumer Staples, Energy, Basic Materials, Utilities,
Telecoms and Real Estate make up the balance.
A horizontally opposed group of Sectors... On the surface of it, many
would argue it is a balanced Index.
It is certainly not, it is a place where Wall Street Parks $ during periods
of indecision as it is a "Safe Place" for BlackRock and Vanguard to defend
positions.... there are 2,000, but a very few are needed based upon
the Sector weightings.
Total Volatility is Highest for the RTY relative to the ES YM NQ (NQ Being 2nd in VX).
___________________________________________________________________
We anticipate a run back up to the Top of the Range @ 2335, our last sell for
a great many handles due South.

rty long idea.russell is headed down along with the other major indeces. could be a dip buying opportunity.

Russell Futures The Running GiraffeLook at analysis. The Russell 2000 futures are clearly forming the classic "running Giraffe" Pattern. In all my year of charting, this is certainly the clearest this pattern has formed. Please tell me if you disagree.

RTY oversold on MFIMFI oversold, small caps green already
Closed out my short positions from yesterday afternoon, not going long though. Might take a 2 day break instead.
NQ is still overbought though so typically a sector rotation when this happens

RTY and what I learn from my brotherI have not posted in few weeks and why is because I have working on new strategy. Everything I know of trading I learn from my brother honestly. He is the best trader I know and smartest person I know. He mentors me with trading. Much more in the past than now because I am a much better trader now. But he still helps me. He bankrolled my first trading account with 25000 USD and when I make this back I try and pay him back but he said keep it. Wow! I'm lucky. He is incredible with computers and he is a person that big companies hire to try and break in to their computers system and he finds the holes and weakness. (He got into a bit of teenage trouble for this, but he is very good man, now especially). He is also on tradingview but that is where I will leave it. Then he builds algorhythms that seal up the flaws. I don't pretend to understand. He also codes for trading strategies and I have the advantage of getting them no cost. but I digress. LOL
So I notice that after 6 months that my returns start to fade some. This is despite me not changing anything about my strategy. So I seek my brothers advice. I ask him if this is statistically significant or not. He did some analysis and said yes this is real and significant. When your strategy becomes less profitable the market has adjusted to your strategy and it is time to make some adjustments. He said he would give me the strategy he is using now, but I said nope let me figure this out. So I get to work and I come up with a strategy that uses a moving average, RSI and ADX/DI. No shapes or wedges, support or drawing. I like this.
I played around with my new strategy and use backtester that my brother uses. I find I can win almost 80% of trades with a risk reward of well over 3:!. I go to him and I say this can't be right. So he analyzed it too and came up with similar numbers. He said now for to forward test it for the real test. So over the past few weeks I did this and so did my brother. These are the results.
PuckBunny
total trades 72
wins 55
losses 17
win percentage 76%
reward to risk ratio: 3.53:1
Sortino ratio of 2.03
Brother Puckbunny
total trades 84
wins 69
losses 15
win percentage 82%
Reward to risk: 3.22:1
Sortino ratio 2.41
So of course he always beats me and I ask him how. he said he adjusted my moving average to change to longer or shorter depending on volatility. Thus more trades, more win percentage and more money. He gave me the indicator he built for this and make it dummy (me) proof by showing the sells and buys on chart.
An interesting part of this strategy is that the risk is quite large. In fact, in some trades the risk is 4 times more than potential reward. The thinking is that based on chance alone the price is much more likely to hit target than be stopped out. Add to this a directional bias and you have a winning strategy. the big risk is the opposite of what most of us were teach. However, he has built a safety being that he adjusts the stop in kind of a reverse trailing stop loss, based on how much below entry price is and volatility. So this big risk is rarely realized.
So I have been using this strategy for 1 week and I take 7 trades and win them all. Now this is my first one to post. You can see details on chart.
RTY long 2272 (you can see buy signal on chart)
stop loss 2166 (I know right?)
Let's see how this goes.

Tutorial | How To Use RSI To Find Turning Points ... or NOT!Hey Speculators - Happy Friday - welcome to another video tutorial, and thanks again to the @TradingView Editors for featuring my last post, which I've linked here, and is related to the topic on hand for today. That topic is how, and when, to not fight a trend.
I'd suspect many traders are familiar with the Relative Strength Indicator (RSI), used to measure overbought and oversold conditions. In this video, I discuss what I look for when using RSI to filter trade signals and identify when strong is REALLY strong. The inverse would hold true as well (you know, weak, or really WEAK), but we all know markets never go down. :)
RSI Settings for this video
5 Period
Upper 88
Lower 12

RTY +479 Ticks BullishThe RTY one hour time frame is in a large side
ways movement. The market hit the bottom of
the sideways range and broke the short term
down trend line. The market is now in the buy
zone at a high price.
Entry: Counter trend line break bullish in the
buy zone.
STOP: 2085.1
LIMIT: 2325.00
As long as the market stays above the bottom of
the range. It will be a good idea to turn to the
five minute time frame and to look for tunnel
trader long / destination trader long opportunities.

Small Caps Catching up to Market?!RTY not yet overbought, room to run, the TL intersects at 2311 on 31 Aug. Expect ATH prices next week in major indices, small caps have struggled.
Might turn back from resistance after the megacaps top out. Taking a small position in October 225 put spreads vs weekly 220s. GLTA!

rty. trying to break resistance, but may stay in range.rty could break resistance and look for an extended bullish move, or it could fail to break resistance, stay in a range, and open the possibility to newer lows down the line.

emini russel friday projectionthis still has some downside to it
we look to a move to 2200 and then a consolidation

rty tuesday projectionprojection for the russel tuesday.
we expect a decline ( a shallow one ) after today's meme short squeeze

RTY One hour breaking into buy zone.The RTY one hour time frame is in a large side
ways movement. The market hit the bottom of
the sideways range and broke the short term
down trend line. The market is now in the buy
zone at a high price.
Entry: Counter trend line break bullish in the
buy zone.
STOP: 2085.1
LIMIT: 2325.00
As long as the market stays above the bottom of
the range. It will be a good idea to turn to the
five minute time frame and to look for tunnel
trader long / destination trader long opportunities.

Russell20008.23.21 Russell : This is my way of thinking in terms of probability in a crude and less than perfect way. It is my way of comparing risk and reward as a buyer and the seller, and then tell you my reasons for wanting to be the buyer even if the odds slightly favored the sellers. It is not hard to do, it does not take much time, and I accept there may be a degree of bias, but I think that it is to my advantage to at least think it through for a few moments which is all it takes. What I didn't clarify well enough is that I really need to be watching the market to take the entry, however, once I'm in the market I can place my stop, and I have options as to where the initial target should be, and I can use alerts if the market moves in the direction of my targets if I need to go back and modify my initial target, but I don't have to be at the monitor once I enter the market. THAT IS IMPORTANT TO ME. I botched the end of the video because I didn't place the retracement tool correctly, sorry about that.

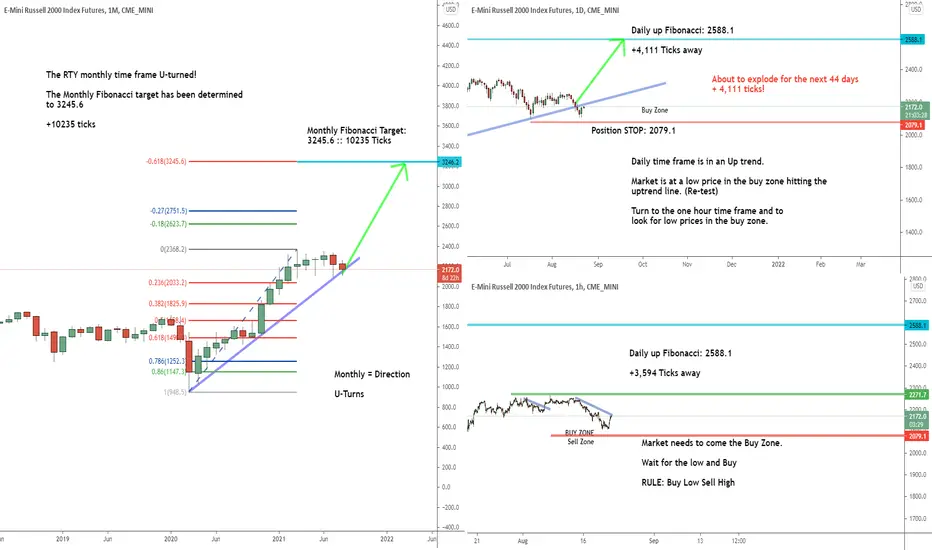
Major U-turn on Russel 2000RTY is U-turning on Monthly.
Daily is on the lowest (if the trend continues).
1H broke the Down Gartly.