RTY1! trade ideas


RTY: E-Mini RussellAt the close of last week, we saw a bounce in major indexes. After creating a downward channel, the price broke out on the Russell 60 min chart. We can now predict the next movement.
Targets:
2288
2315
Thank you and Good Luck!
🛑Disclaimer🛑
The content of this analysis is subject to change at any time without notice. Trading leveraged products carry a high level of risk and may result in you losing substantially more than your initial investment. This is not financial advice.

Russell 2000 is getting ready to make new high soonHere are support and resistance levels. Close above 2292 would confirm it's intention to move higher. Initial target is overhead resistance trend line and then 2500. Close below 2161 could indicate short term trend change.


$RTY. Seeing shapes on the 4 Hour.Looks like it could be trying to finish the week higher. These are some shapes I am seeing. I don't like to trade the higher time frames, but this gives me some ideas for when I go lower.

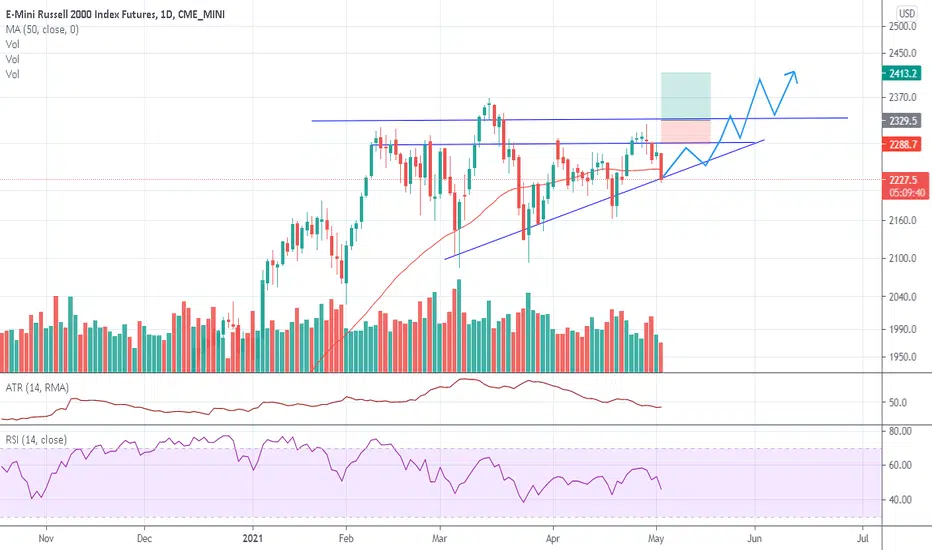
Ascending Triangle BreakoutTodays drop, as expected is to the bottom support line of the ascending triangle that has been building up. I think this is a great time to get in early on the breakout. If not you could go with the flow, and wait for the market to top the resistance on high volume and break through the highs. I see a big market move coming later this month or early next month. I advice investers set their buy limit orders right above the previous highs.
RTY. How it compares at the moment.Here is my math:
3/4 are wrapping upper trendline = buyers are coming out.
1/4 (RTY) isn't testing upper trendline, but did not create new swing low.
Add it together, and I think there is a bullish case for the afternoon.
I really want to go long on all four, but I have a history of freestyling more than absolutely necessary, and the MA's (which are meant to help me) are still down. For the sake of long term growth I think I have to resign to an observatory role. Maybe I'll check back in for the afternoon session and see how we close.
This would be one of those times I take all the trades on my sim account and turn over a couple grand. I really hate to do that. It gives me a big head with nothing to show for it, but I think that's my safest and best positive action at the moment.
----
In the end this is just a big bet that the markets are going to buy back what they sold off this morning. I have a tendency to think I can predict the future through these stories I tell myself. And, I know that's not the proven path. They did sell pretty stinking hard meaning there is now a lot to be made on the way back up.
My following thoughts are... It's only Tuesday, meaning this could go on all week... followed by... If I bought now without a stop loss, or a super low stop loss, and held on tight, I could probably capture at least 100-200 points on the NQ. probably more.


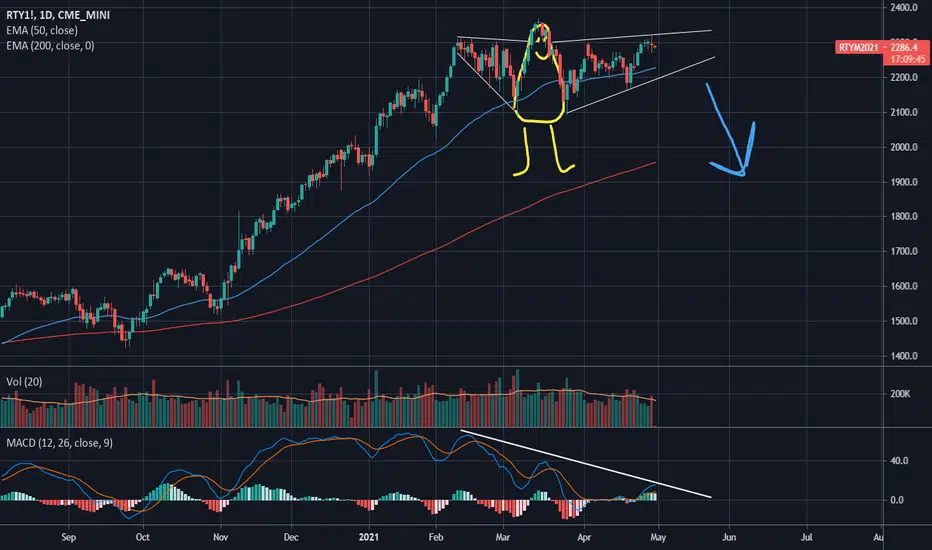
It's been a good runBut the bearish bird is hinting towards a breakdown.
bearish divergence in MACD
Waiting for a sell signal of breakdown and back test
RUSSEL 2000 Market Breakdown Analysis!!Hi ,
Indexes are clearly bullish . Untill market shows the opposite reaction we should take consider the current momentum.
Now, we have to find a proper palce to get in the trend. If price tousch the key levels which referred in the charts, hopefully it will be great opportunity to take consider!!
In case of, H&S neckline will be broken, deeper correction can be considered!!
Note: the posts are not investment idea

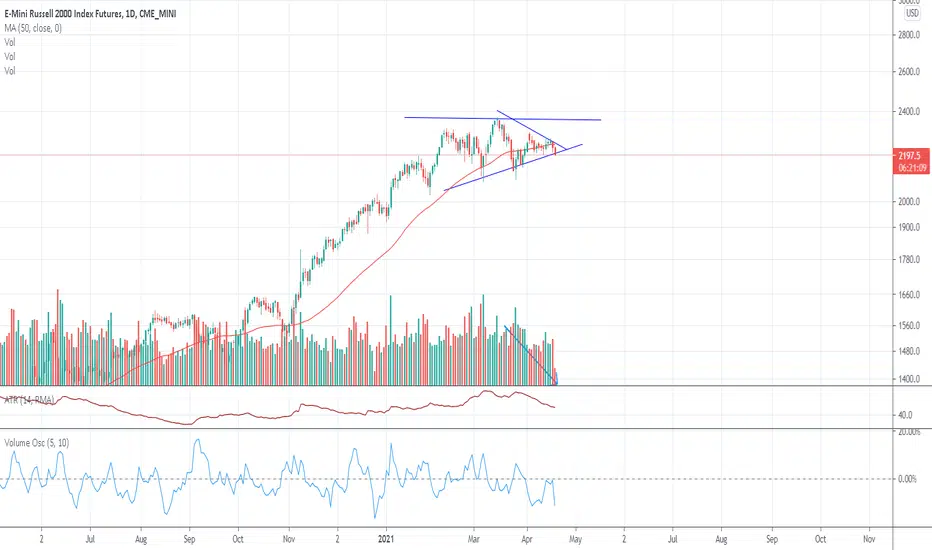
Bearish flow and patterns negated... Ready for new highsWe have broken out of the bearish trend and found real strength this week.

RTY Update from previous post Cypher Pattern Posted real time here on trading-view (search my plays) way b4 entry in pre market, traded live in private

RTY2021. Diving into Russel. Haven't really looked at RTY under the microscope in a while.
It's not a very tradeable market for me. I like to see really obvious and simple price action where both sides have an understanding of when the other side is going to take the lead.
In the RTY I see a lot of range bound activity. Every buy sign I see is met by a sell sign, and even though I do think the trajectory is up, the rising wedge structure that has recently formed makes me think a selloff could be in the cards.
-----
Again this is my first look at Russel in a while, a market I don't typically follow closely, so I am not as confident trading what I see. But you do have to start somewhere.
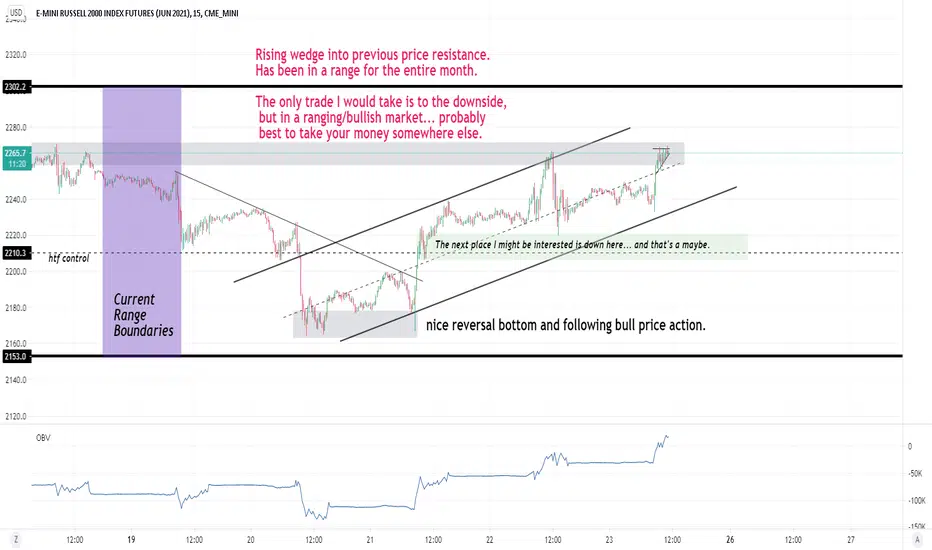
Trade what you see, not what you think..A rare triangle pattern.. Leaning to a bullish approach if we could reclaim 2265 area.. Bearish if it breaks below 2210 area.. All in between = noise..


$RTY Cypher Pls see chart for detailed, set up, all tp's (green tabs) labeled & stop (red line & tab) Cheers guys, wish everyone great success today!

Breakout out this consolidation wedgeAfter a few months massive market moment the russell 2000 hit a wall and went into consolidation.
I think its setting up for a break out any time these next 2 weeks, which should push up towards all time highs.
From the technical perspective it seem volume is trending down, which is bullish if the market is consolidating.
Once we see it push out of this wedge we should see it push ATH.
I recommend only buying once it breaks out, and if there is plenty of volume relative to historical averages.
As predicted M2KM21 downAs it was earlier predicted to downward side on M2KM21 chart, it is almost completed. Now the next movement depends on whether daily chart H&S formation will work or not. If daily chart H&S works then price will be pulled down to level below 2000 if not 2100-2150 range is a good buying opportunity imo.

Evidence Base Tradingon April 15, I did a thorough analysis of the market for my private subscribers, asked them to close all their positions, and predicted the market will be challenged in the next week and small-caps in particular. I offered them to buy inverse ETFs to benefitted from the negative market ahead.
Today, I asked them to buy TWM..! so far +5.4% gain in a single day..!
for evidence, check the related link below..!

Nice setupCan go either way from here. No preference on which way, either market will rotate back into IWM and push higher or IWM will cool off with market. Either way there is a trade, just follow it.

NQ TargetNAZ, DJIA and SP500 are at all time highs, may need to test lower levels in order to go higher. Russell may be the key, needs to get going. NQ may retest 13550. Russell appears to be targeting 2180. Again with NAZ, much action in overnight and not much follow through in Open, only in final 30 minutes of past 4 days. Watch for weak close and expected negative follow through in overnight. For now the direction is UP.
