Good R:R opportunity on RTYPlenty of room up to 2271 still. If we see a break above 2231 on the hourly and then form a HL we will likely see an uptrend continuation to 2271.
RTY1! trade ideas

Russell may rock n’ roll on rate cut and soft landing hopesRussell 2000 futures sit on uptrend support, making Friday’s close important following Jerome Powell’s speech at Jackson Hole.
To get excited about US small caps, you need a soft economic landing and lower borrowing costs given many of its constituents are unprofitable and reliant on capital markets. Given Powell will discuss rate cuts and flag confidence in the Fed’s ability to stick a soft landing, it comes across as recipe for upside.
With the uptrend nearby, traders could initiate longs around these levels or even a touch lower with a stop loss below the level for protection. Should the price break 2186.4, there’s little in the way of visible resistance until the record highs.
If the trade works in your favour, consider raising you stop to entry level or higher, providing a free hit on upside. Good luck!
DS

RTY Bear FlagI posted a bullish idea for RTY earlier based on a horizontal support level, but after reviewing more I think this might actually end up bearish. Nice bear flag here on the 4hr, so I'd say that makes it more likely to break. I have demand near 2100 I'd use as a first target for shorts.

RTY Support Test Long IdeaRTY is an interesting spot here, I'd expect bulls to hold the area on at least one retest. If not, I think it could be a great short if it breaks below and retests.
First upside target for me is 2175, downside is 2100 if it can break below 2130ish.

Determining Which Equity Index Futures to Trade: ES, NQ, YM, RTYWhen it comes to trading equity index futures, traders have a variety of options, each with its own unique characteristics. The four major players in this space—E-mini S&P 500 (ES), E-mini Nasdaq-100 (NQ), E-mini Dow Jones (YM), and E-mini Russell 2000 (RTY)—offer different advantages depending on your trading goals and risk tolerance. In this article, we’ll dive deep into the contract specifications of each index, explore their volatility using the Average True Range (ATR) on a daily timeframe, and discuss how these factors influence trading strategies.
1. Contract Specifications: Understanding the Basics
Each equity index future has specific contract specifications that are crucial for traders to understand. These details affect not only how the contracts are traded but also the potential risks and rewards involved.
E-mini S&P 500 (ES):
Contract Size: $50 times the S&P 500 Index.
Tick Size: 0.25 index points, equivalent to $12.50 per contract.
Trading Hours: Nearly 24 hours with key sessions during the U.S. trading hours.
Margin Requirements: Change through time given volatility conditions and perceived risk. Currently recommended as $13,800 per contract.
E-mini Nasdaq-100 (NQ):
Contract Size: $20 times the Nasdaq-100 Index.
Tick Size: 0.25 index points, worth $5 per contract.
Trading Hours: Similar to ES, with continuous trading almost 24 hours a day.
Margin Requirements: Higher due to its volatility and the tech-heavy nature of the index. Currently recommended as $21,000 per contract.
E-mini Dow Jones (YM):
Contract Size: $5 times the Dow Jones Industrial Average Index.
Tick Size: 1 index point, equating to $5 per contract.
Trading Hours: Nearly 24-hour trading, with peak activity during U.S. market hours.
Margin Requirements: Relatively lower, making it suitable for conservative traders. Currently recommended as $9,800 per contract.
E-mini Russell 2000 (RTY):
Contract Size: $50 times the Russell 2000 Index.
Tick Size: 0.1 index points, valued at $5 per contract.
Trading Hours: Continuous trading available, with key movements during U.S. hours.
Margin Requirements: Moderate, with significant price movements due to its focus on small-cap stocks. Currently recommended as $7,200 per contract.
Understanding these specifications helps traders align their trading strategies with the right market, considering factors such as account size, risk tolerance, and market exposure.
2. Applying ATR to Assess Volatility: A Key to Risk Management
Volatility is a critical factor in futures trading as it directly impacts the potential risk and reward of any trade. The Average True Range (ATR) is a popular technical indicator that measures market volatility by calculating the average range of price movements over a specified period.
In this analysis, we apply the ATR on a daily timeframe for each of the four indices—ES, NQ, YM, and RTY—to compare their volatility levels:
E-mini S&P 500 (ES): Typically exhibits moderate volatility, offering a balanced approach between risk and reward. Ideal for traders who prefer steady market movements.
E-mini Nasdaq-100 (NQ): Known for higher volatility, driven by the tech sector's dynamic nature. Offers larger price swings, which can lead to greater profit potential but also increased risk.
E-mini Dow Jones (YM): Generally shows lower volatility, reflecting the stability of the large-cap stocks in the Dow Jones Industrial Average. Suitable for traders seeking less risky and more predictable price movements.
E-mini Russell 2000 (RTY): Exhibits considerable volatility, as it focuses on small-cap stocks. This makes it attractive for traders looking to capitalize on significant price movements within shorter time frames.
By comparing the changing ATR values, traders can gain insights into which index futures offer the best fit for their trading style—whether they seek aggressive trading opportunities in high-volatility markets like NQ and RTY or more stable conditions in ES and YM.
3. Volatility and Trading Strategy: Matching Markets to Trader Preferences
The relationship between volatility and trading strategy cannot be overstated. High volatility markets like NQ and RTY can provide traders with larger potential profits, but they also require more robust risk management techniques. Conversely, markets like ES and YM may offer lower volatility and, therefore, smaller profit margins but with reduced risk.
Here’s how traders might consider using these indices based on their ATR readings:
Aggressive Traders: Those who thrive on high-risk, high-reward scenarios might prefer NQ or RTY due to their larger price fluctuations. These traders are typically well-versed in managing rapid market movements and can exploit the volatility to achieve significant gains.
Conservative Traders: If stability and consistent returns are more important, ES and YM are likely better suited. These indices provide a more predictable trading environment, allowing for smoother trade execution and potentially fewer surprises in market behavior.
Regardless of your trading style, the key takeaway is to align your strategy with the market conditions. Understanding how each index's volatility affects your potential risk and reward is essential for long-term success in futures trading.
4. Conclusion: Making Informed Trading Decisions
Choosing the right equity index futures to trade goes beyond personal preference. It requires a thorough understanding of contract specifications, an assessment of market volatility, and how these factors align with your trading objectives. Whether you opt for the balanced approach of ES, the tech-driven dynamics of NQ, the stability of YM, or the volatility of RTY, each market presents unique opportunities and challenges.
By leveraging tools like ATR and staying informed about the specific characteristics of each index, traders can make more strategic decisions and optimize their risk-to-reward ratio.
When charting futures, the data provided could be delayed. Traders working with the ticker symbols discussed in this idea may prefer to use CME Group real-time data plan on TradingView: www.tradingview.com This consideration is particularly important for shorter-term traders, whereas it may be less critical for those focused on longer-term trading strategies.
General Disclaimer:
The trade ideas presented herein are solely for illustrative purposes forming a part of a case study intended to demonstrate key principles in risk management within the context of the specific market scenarios discussed. These ideas are not to be interpreted as investment recommendations or financial advice. They do not endorse or promote any specific trading strategies, financial products, or services. The information provided is based on data believed to be reliable; however, its accuracy or completeness cannot be guaranteed. Trading in financial markets involves risks, including the potential loss of principal. Each individual should conduct their own research and consult with professional financial advisors before making any investment decisions. The author or publisher of this content bears no responsibility for any actions taken based on the information provided or for any resultant financial or other losses.

US small cap bounce unconvincing despite risk revival The recovery in US small caps has been unconvincing over the past fortnight, struggling for upside unlike mega-cap rivals. Russell 2000 futures have been capped below the 50-day moving average for much of this period, running into sellers constantly above this level. Wednesday’s rejection above 2132.6 warns of building reversal risk, putting a potential break of uptrend support on the cards should US slowdown fears return.
If the price were to break the uptrend, traders could enter shorts with a tight stop either above the level or the 50-day moving average for protection, depending on your target. On that subject, the 200-day moving average or 1920 are levels to consider. If the price were to hold the uptrend, a close above the 50-day moving average would negate the bearish setup.
MACD and RSI continue to generate bearish signals on momentum, making selling rallies the preferred strategy near-term. Good luck!
DS

RTY Short IdeaRTY hard rejected after its breakout above the 2100 area. Now it is almost back down to the bottom end of the wedge. I'd expect a break to the downside and a test of demand around 2k relatively soon unless it does end up breaking out above 2100 again and sustains.
I see that fakeout as highly bearish and I'm already bearish on the market anyway so this seems like a good short candidate to me. If either of these paths play out, I'd look for IWM puts on the arrows.

RUSSEL 2000 needs to rise in order for the crypto market to riseEverytime the altcoin market have had a bullrun the Russel 2000 have gone into all time high prior to alt coins popping!
This is one element still missing for altcoins to pop.
80% of the volume stock market is in the top 10 stocks, we need to see a shift from the big companies into smaller stocks and a expansion in the russel 2000
When Russel 2000 are rising, people are willing to risk more in smaller stocks. And a marekt shift from risk off and dividents as we have now to a risk on narrative where people are buying more risky options such as small stocks/crypto havent started yet.
IF we will have a altseason, i promise you that Russel 2000 will make this move before the altcoins starts pumping!
LIKE AND FOLLOW THIS CHART, its crucial to track if you are in crypto

Reversal on the Russell the market for the Russell should be going higher I'm using all the tools including the extensions. the retracement, what it means to have expansion and looking for trade location for buyers and sellers, and looking for ABCD pattern reversals.

What does AI Fatigue look like for Indices? What is moving lately? Tech stocks in Nasdaq and S&P are down, whereas traditional stocks in the Dow Jones and the smaller-cap stocks in the Russell are holding well.
Micro E-Mini Russell Futures and Options
Ticker: M2K
Minimum fluctuation:
0.10 index points = $0.50
Disclaimer:
• What presented here is not a recommendation, please consult your licensed broker.
• Our mission is to create lateral thinking skills for every investor and trader, knowing when to take a calculated risk with market uncertainty and a bolder risk when opportunity arises.
CME Real-time Market Data help identify trading set-ups in real-time and express my market views. If you have futures in your trading portfolio, you can check out on CME Group data plans available that suit your trading needs www.tradingview.com

Russell 2000 (RTY) Looking to Resume Bullish TrendShort Term Elliott Wave in Russell 2000 (RTY) suggests that rally to 2304.90 ended wave 3. Pullback in wave 4 unfolded as a zigzag Elliott Wave structure. Down from wave 3, wave (i) ended at 2246.1 and wave (ii) ended at 2285.50. Index resumed lower in wave (iii) towards 2206.80 and wave (iv) rally ended at 2224.20. Final wave (v) lower ended at 2193.6 which completed wave ((a)). Rally in wave ((b)) ended at 2221.80. Wave ((c)) lower ended at 2188.01 which completed wave 4 in higher degree. The Index still needs to break above wave 3 at 2304.90 to rule out a double correction.
Up from wave 4, wave (i) ended at 2274.50 and pullback in wave (ii) ended at 2202.20. Wave (iii) higher ended at 2288.80 and pullback in wave (iv) ended at 2251.10. Final leg wave (v) ended at 2298.10 which completed wave ((i)) in higher degree. Wave ((ii)) pullback is in progress to correct cycle from 7.22.2024 low before it resumes higher. Near term, as far as pivot at 2188.01 low stays intact, expect pullback to find buyers in 3, 7, or 11 swing before the Index resumes higher.

Getting ready for the FedThe selloff on Tuesday for the S&P 500 implies a market getting ready for the Fed announcement on Wednesday rather than a weak market. How the market will respond on Wednesday is 50-50. Unless the Fed says something unusual, the expectation is for an inside the higher day.

Breaking structure lows - shorts opportunity Really nice R:R below key low that was broken at 2239 - anticipate to fill imbalance next - PT 2212

RTY long opportunity BOS above 2283 will give a nice long opportunity to next level. Hopefully that would give us what we need to go even higher

RTY Bullish MomentumWith the ES and NQ seeing some major weakness there seems to be a market rotation out of the tech sector and into small caps. The reason I like RTY for a continuation of bullish momentum is because price action is setting up in a bullflag with higher swing lows and two strong wicks through the top trend line possibly taking out some sell orders clearing the way for the bulls to push through.
This could also be the formation of the W pattern. There is a triple top at the neck line of the W pattern at 2273.9 which is a key level that if is broken would signal more bulls to enter possibly pushing to test 2304.5. Resistance after the double top would be at 2340 which is the measured move from the neck line down to higher low at 2204 (677 ticks).

Near Term Trade Russell 2000With the view from Tom Lee of Fundstradt he believes the Russell will hit an ATH of 3000 by summers end and I believe he is correct. For the month of August a 15% climb or more is in the cards for August. A near term trade. The technicals are in place for a near term trade.

Russell 2000 I am not trying to go overboard with this one. It is completely cut and straight to the point. We are completely bullish here. Following the trend of course but also getting setup for that minor correction is also great.

Russell 2000I am loving the setup with the Russell 2000. The way it moved this past week is crazy. Looking for some minor corrections to start the first couple of days. Please make sure we are waiting for our setups to develop and not rush them.

RTY Long IdeaRTY has been relatively weak all year, but has been tradable, at least I think so. It just had a big downtrend breakout and failed. It's retesting the trendline now, it's likely we see a bounce here and potentially a move up to supply. If not, demand below is the next target. If that breaks, it could get even more momentum to the downside.

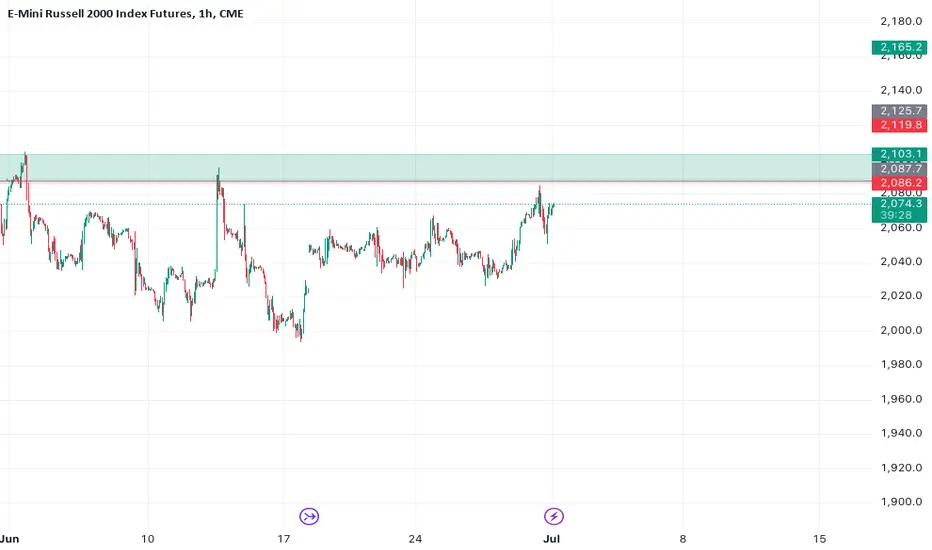
RTY trade of this week break above this area 2090 will provide us with a R:R to next level 2102 area
Best R:R opportunity on RTY upcoming IF we get above 2127 level this week will provide an excellent R:R opportunity up to 2164 area

Super waveycheck out some of my ideas. also I don't take every trade idea that you see here
these are assumptions before price action completes and confirms. The point of my ideas is try to predict price action everyone knows that's next to impossible but I'm having fun.
I am not a professional trader nor am I technical . all ideas are based on what I understand price to be. when I see certain confluences that fits my trading strategy I then look for my opportunity to enter trades.
to many egos here. we are all independent traders navigating the market. happy trading

Oil ES mini Russell June 11th 2024 in this video I spent some time on crude oil where you might consider trading it as a buyer or a seller, I would be a seller if I had to trade the market where it is now---- always with a small stop. The es has a reversal move here to Short so... if I shorted it I would have a very tight stop, and I probably wouldn't short it because the price action is still near the high. the reason I wouldn't go long on the ES is that I'm looking at a 2-bar reversal that would suggest it's going lower it's a conflict. however, on the Russell this Market has a lot more bearish price action leading to where the price sits at this point, and this is why I would prefer the Russell that represents 2000 stocks versus the S&P which is 500 stocks... I believe that the Russell is telling you that the market is in Jeopardy of going lower because of its more bearish price action.
