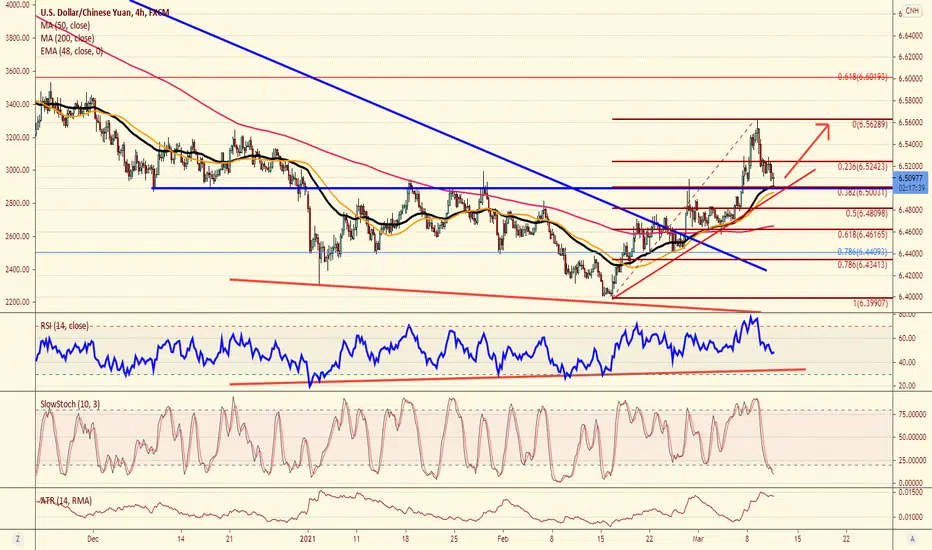
USDCNH at supportUSDCNH hit some key support today and looks like as long as we are above the 6.5000 level (38% retracement) we should head higher.
CNHUSD trade ideas
BEARISH CALL This is my bearish trend idea, now during bearish flag you can see it .Wait for clear breakout to downtrend after you can entry, because the overall bearish trend . Only in my opinion.

USD CNH SELL (US DOLLAR - CHINESE YUAN)Hi there.
Price is forming a continuation pattern to the downside. Watch strong price action at the current levels for sell.

USDCNH uptrend continues after key level penetrated!First of all , my previous idea regarding USDCNH is right. Now, the momentum to the upside is strong with key zone penetrated.
Secondly , after 11% drop since May of last year, 5% rebound is likely to happen(50% fibonacciretracement).
Thirdly, the pair might got issues around 6.67 which happens to be the Flip level.
It is not good news for Chinese assets, e.g. HK stocks, mainland stocks. The hiking US 10Y yield along with a stronger dollar and uprising crude oil price will weigh on the emerging market assets. Outflows might occur and further drop is expected around the corner.
Things aren't bad if we already have expectations for what might happen! Cycles all the time! After the correction, funds will come back given the strong economy growth of China in 2021 and 2022.

USDCNH - LONG; BUY it up!!This is very likely a one-way move (up) here - as all previous examples would illustrate.
Most importantly, this is one of (if not "The") most lopsided FX (and debt, and credit, etc.) positioning currently on the entire Globe! (Everyone and everything is currently Net Short the Dollar vs. the Yuan!)
Ergo, as this move gets going (up) it is only likely to gain considerable speed.

USDCNH is likely to go up after consolidation on dailyWeekly: After a 10% drop, a bullish engulfing candle is formed. This week is key, technically, if weekly candle is not a big bearish candle, then it might be at the very beginning of big rally!
Daily: First time to test my mid-term MA and try to close above it since July of last year. Now, It's approaching control high area which is the key.
Basically, Chinese stock market has performed very well last year due to economic growth and better-than-expected recovery from Covid-19. A lot of foreign investors has entered mainland market.
If dollar goes against CNH, I think it'll weigh on Chinese related assets, e.g. HK stock market. Outflow may occur under such circumstances.
Now, exchange rate still moves in the range area, once the range gets broken, a big rally for USD is expected around the corner against the backdrop of optimistic economic outlook of U.S.


USDCNH on an inversted H&S 🦐USDCNH on the 4h chart after a long downtrend starts a move inside a descending channel.
The market creates an inverted head and shoulder pattern with the opportunity of a break to the upside.
IF the price will break above, according to Plancton's strategy, we will be ready to set a nice long order.
--––
Follow the Shrimp 🦐
Keep in mind.
🟣 Purple structure -> Monthly structure.
🔴 Red structure -> Weekly structure.
🔵 Blue structure -> Daily structure.
🟡 Yellow structure -> 4h structure.
⚫️ Black structure -> <4h structure.
Here is the Plancton0618 technical analysis , please comment below if you have any question.
The ENTRY in the market will be taken only if the condition of the Plancton0618 strategy will trigger.

USDCNH ShortWe currently have a short bias against the USD. And long bias for CNH, NZD, AUS.
With that in mind, USDCNH is currently signalling a good entry.
Technical run-through:
Daily
Price currently being resisted by kumo.
Price resisted by the 50 EMA.
Price at upper BB.
Entry
Both senkou span A & B flat for 1H & 30 mins
Chikou span still at price wait (confirmation when chikou below price for 1H & 30 mins)
Target
Price target 6.23579 (March 2018 lows)
Stop-loss: 6.53902
RR ratio: 4
Powered by: WickedTicks

USDCNH ShortWe currently have a short bias against the USD. And long bias for CNH, NZD, AUS.
With that in mind, USDCNH is currently signalling a good entry.
Technical run-through:
Daily
Price currently being resisted by kumo.
Price resisted by the 50 EMA.
Price at upper BB.
Entry
Both senkou span A & B flat for 1H & 30 mins
Chikou span still at price wait (confirmation when chikou below price for 1H & 30 mins)
Target
Price target 6.23579 (March 2018 lows)
Stop-loss: 6.53902
RR ratio: 4

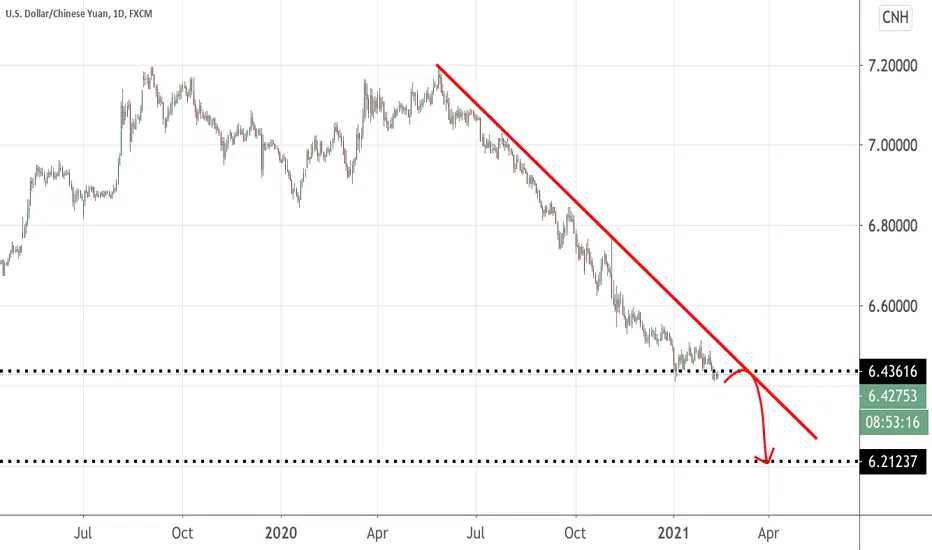
USDCNH | Perspective for the new week | Follow-upWe saw the price decline and move over 1,000pips in our direction since my last publication before the rally began during last week trading session (see link below for reference purposes). Despite the general perception that the USD is on the verge of a rally due to the sudden & rapid rise that appears to be running ahead of itself during last week trading session, I am of the opinion that we are at a juncture in the market where the structure/pattern is "screaming" risk of further decline for the Greenback in the coming week(s). Even though there is room for a possible rally into the major Supply area @ Y6.5100 area, my bias still remains Bearish!
Tendency: Downtrend ( Bearish )
Structure: Harmonic Pattern (AB = CD) | Breakdown | Supply & Demand
Observation: i. Since the beginning of the year (2021), Buyers have found it difficult to break the Y6.51000 barrier thereby leaving clues of strong selling pressure at this zone.
ii. Continuous rejection of the Y6.51000 area followed by a complete Breakdown of Key level (Y6.4600/6.4400) at the beginning of the month (Feb 2021) is a sign emphasizing the strength of sellers.
iii. I am of the opinion that the rally that began on the 15th Feb 2021 is a Correction of the Impulse leg AB (expressed on the chart).
iv. Last week trading session saw price close at Y6.4600 area - exactly 61.8% retracement of AB with the possibility of extending into the Major Supply zone @ 78.6% retracement (appearing to be a rejection of key level) before the decline begins.
v. The setup evolving at this juncture might transpose into ABCD pattern parameters explained below;
a. Leg A-to-B is expected to be in harmony with the potential C-to-D leg.
b. The B- to-C leg is currently hovering at 61.8% (with a possible 78.6% in the future) Fibonacci retracement of the A-to-B leg.
c. The C-to-D leg is expected to fall within 127.2 - 1.414% Fib. ext. of the A-to-B move.
vi. It is hereby required that we become patient and wait for a strong Reversal pattern on lower time frames for confirmations... Best of luck and Trade consciously! :)
Trading plan: SELL confirmation with a minimum potential profit of 1,000 pips.
Risk/Reward : 1:3
Potential Duration: 7 to 14 days
NB: This speculation can be considered to make decisions on lower timeframes.
Watch this space for updates as price action is been monitored.
Risk Disclaimer:
Margin trading in the foreign exchange market (including foreign exchange trading, CFDs, etc.) has a high risk and is not suitable for all investors. The content of this speculation (including all data) is organized and published by me for the sole purpose of education and assistance in making independent investment decisions. All information herein is for your reference only and I take no responsibility.
You are hereby advised to carefully consider your investment experience, financial situation, investment objective, risk tolerance level, and consult your independent financial adviser as to the suitability of your situation prior to making any investment.
I do not guarantee its accuracy and is not liable for any loss or damage which may result directly or indirectly from such content or the receipt of any instruction or notification therewith.
Past performance is not necessarily indicative of future results.

USDCNH ShortLooking to short USDCNH around 6.48 .
Trend looks decently bearish with a high chance of soon hitting 6.37 - 6.38 .
Plan B would be 6.5 but it's not optimal.


BEARISH CALL This is my bearish trend idea, now during bearish flag you can see it .Wait for clear breakout to downtrend after you can entry, because the overall bearish trend . Only in my opinion.

USDCNH shortOn the daily timeframe market has formed a W formation, after this pattern we expect it to complete at the neckline... on the lower timeframes market has formed a new lower high and this nice head and shoulder pattern we are waiting for a close below support then on the retest we can look to short.

USDCNH downtrend continues with booming demand for RMB assets CNH, or known as the offshore Chinese renminbi achieved significant gains since last June as China is the only major economy with positive GDP growth in 2020, due to the well control of the virus.
The Chinese stock market also benefited from this, with CSI300 and shenzhen component soared 27.216 and 38.73% respectively.
With the strong recovery from the crisis, the CNH also posted strong gains against USD with over 10% from late last May.
From the trend perspective, the new lower low created indicate further drop of USD against CNH. This is benefit both the mainland stock market as well as the Hong Kong market.
Chinese companies listed in HK, e.g. Tencent will be chased by foreign and Chinese institutional investors.


USDCHN AnalyticsA shift sentiment is evident given these current market conditions. It's highly plausible that USDCHN will continue to build upward momentum as price may shape a new bullish Elliot wave. It is paramount to understand that the shaping of this pair is logarithmic in nature.

USD CNH BUY (US DOLLAR - CHINESE YUAN)Hi there. Price is forming a reversal pattern to change its direction.
Wait for the price to form the first impulsive move, then wait for the price to form a continuation pattern and watch strong price action for buy.

More downside for USDCNHI made 2 mistakes in this trade :
1. Trying to outsmart the market by predicting the next move (see trade post here )
While my loss is small, it is NOT a loss that needs to be made in the first place.
2. Emotions run amok - I adjusted once more in my stop loss, furthering my losses instead of letting it go.
So based on these two mistakes, I was wrong. Wrong because I failed to follow my own trend line rules. Wrong because I adjusted the stop loss, hoping (not a strategy) it will reverse sooner than later. I was afraid to have a sore point in my portfolio of greens. Argh, some ego there , huh ?
Fortunately, I wake up to my senses and immediately cut my 2nd losses to contain the damage. I will find an opportunity to short this pair later and obey the trade rules again.
The beauty of writing a journal entry like this is to acknowledge your mistakes, review what went wrong and rectify it immediately. I am sorry if anyone had followed this trade post and made some losses.
USD/CNH Can Plummet FurtherThis has been plummeting for the best part of a year. It recently broke another support and is now retesting it as resistance. If we see MACD turn lower and EMA's do not cross higher then this should continue down to the next supports.
Keep in mind this has been oversold on RSI since September so don't be too overconfident as there is always the chance of a correction.
I have marked out 3 levels where to expect support so these can be the targets.
TP 1 - 6.38367
TP 2 - 6.31515
TP 3 - 6.23602
Once this turns SL can be added just above the resistance.

