A smart money whale made $6 million buying stETH in the past 3 mCoin World reported that according to Lookonchain monitoring, a smart money whale earned US$6 million by purchasing stETH in the past 3 months. He bought 27,606 stETH at a price of US$1,629 from March 13 to March 15. 12,746 stETH were sold at a price of $1,937 on April 21. On June 15, 15,701 stETH were bought at a price of $1,671. 15,125 stETH were sold at a price of $1,724 on June 19.
ETQ2025 trade ideas

Anonymous giant whale address withdraws 10,000 ETH from BinanceCoin World reported that according to Lookonchain monitoring, the anonymous giant whale address withdrew 10,000 ETH from Binance 40 minutes ago, which is about $1.73 million. This follows a total of 86,520 ETH (approximately $150 million) withdrawn from Binance and Kraken by 3 new wallets in the past week. The address starting with 0x5bA3 extracted 35,860 ETH from Binance and transferred it to the contract address; the address starting with 0x7c82 extracted 27,000 ETH from Binance; the address starting with 0x2c74 extracted 23,660 ETH from Kraken.

A giant whale is buying back stETHCoin World reported that according to Twitter user Ember Monitoring, the giant whale wallet 0xBoby1337 sold 3,728 stETH (approximately US$6.71 million) at a price of US$1,802 on June 10. He is gradually repurchasing stETH. At present, he has spent 4 million USDT to buy back 2343 stETH, with an average price of 1707 US dollars.

ETH1! Will Go Down! Short!
Here is our detailed technical review for ETH1!.
Time Frame: 1D
Current Trend: Bearish
Sentiment: Overbought (based on 7-period RSI)
Forecast: Bearish
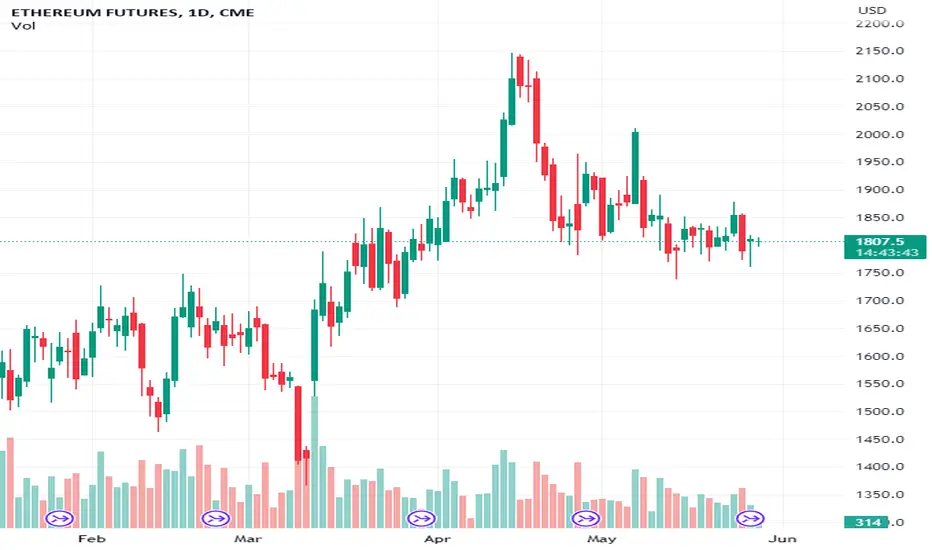
The market is testing a major horizontal structure 1847.5.
Taking into consideration the structure & trend analysis, I believe that the market will reach 1600.0 level soon.
P.S
We determine oversold/overbought condition with RSI indicator.
When it drops below 30 - the market is considered to be oversold.
When it bounces above 70 - the market is considered to be overbought.
Like and subscribe and comment my ideas if you enjoy them!

EthusdtPotential push to the up side to complete a complex correction
Also multiple alt coins looks prime to make one more leg to the up side b4 a very quick and aggressive sell off

ETH New target - 2025+Liq grab at 2020+ with Preliminary Supply on ETH futures
We will set a limit order here and wait
Good luck

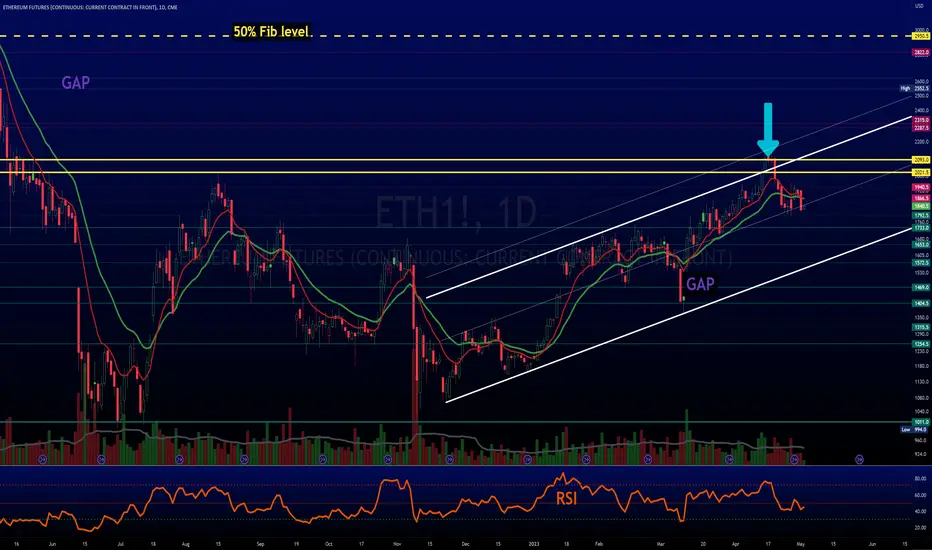
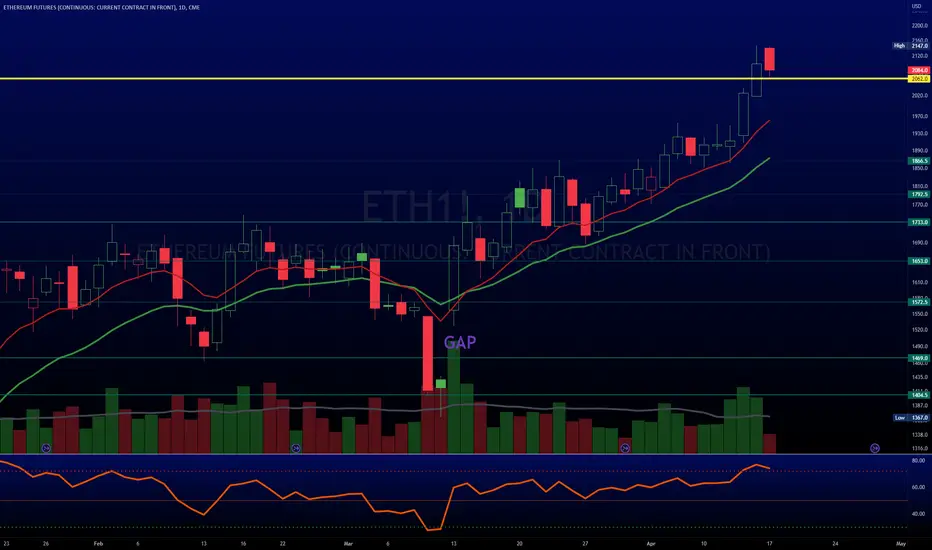
ETH CME GAPSJust be aware of the ETH CME gaps at $1500 and $2600.
I would expect eth to hit $2600 if Bitcoin gains bullish momentum and taps his own $35K CME gap and runs to $37K.

Huang Licheng's 2 addresses spent 1442 ETH to purchase 14.1% of Coin World reported that according to Lookonchain monitoring, the two addresses of "Brother Moji" Huang Licheng spent a total of 1442 ETH (about 2.6 million US dollars) to purchase 9.42 million JIMBO, with an average price of 0.2763 US dollars, accounting for 14.1% of the total supply .
Prepare the demand zone It looks like it's not going to reach the higher highs & prepare myself for longer term demand or am i wrong??...

A bull market will follow ????Hello friends and good night
Ethereum
4 hours analysis
The first possibility: the two impulse patterns can be 1.2 and 1.2, and we are currently correcting the second impulse pattern (1.2), which will be corrected by 50 to 61.8% and the bull market will continue.
The second possibility: It is a flat pattern whose wave (C) has not yet been completed (impulse pattern) which will continue the downward trend until the price of $1000 and then the bull market will continue.
The third possibility: We are correcting the downward trend that a zigzag pattern has been completed and the bear market will continue until the price of $500 to $600, the bull market will begin.
Good luck and be patient in your dealings.
I appreciate your support.
I have considered these possibilities based on my personal experience. If there is a weakness in the analysis, it is because of my lack of experience, and please accept my apologies, guys.

ETHUSD H4 Watching For Bullish Reversal Patterns At the EqualityIn this update we review the recent price action in #ETHUSD and identify the next high probability trading opportunity and price objectives to target

M&Ms March too May CME gaps A higher short entry would be more comfortable on a exit pump rally
Wouldn't bet on it 4hr is bearish control below POC
I hope these parameters and post find you well and searching for opportunity in this ever changing and moving Market

ETH - BreakoutAbout to break out from the consolidation trend.
Wait for the below confirmation
1. MA Cross
2. Super trend becomes green

Bearish on Ethereum Hi guys again....
watch this intriguing Ethereum chart I will sell all crypto currencies on 2500$ of ethereum price .....
look at major resistances in that vicinity around 2500$ ,,,,, keep that in mind . A big sell off in crypto usually occurs after fake bullish breakouts .....
lets discuss with me on that ,...
I am waiting for your comments bellow .

$ETH up on GOOD VOLUMECRYPTOCAP:ETH is umping today.
Over last few days we clearly stated that #crypto started to look better
See the volume? That is looking good, VERY GOOD SIGN!!!
#ETH leads and #altcoins follow.
But I thought #memecoin ripping meant the end?
Patterns & historical data can change.
That is why we've stated >>>>>>>>>>>>>>>>> Previous data NO LONGER valid! Fork, halving, wallet counts, on chain, and what not no longer matter.
Futures and derivatives are dictating moves. This is a very young market and can be moved by whales. Until it gets much larger that kind of data, what was mentioned before, only helps only so much.

ETHUSD H4 Triangle Break To Test EqualityIn this update we review the recent price action in #ETHUSD and identify the next high probability trading opportunity and price objectives to target

Called short term top on $ETH, don't see reason to buy atmWe called the top on CRYPTOCAP:ETH
Left that arrow as a reminder (for the short term at least)
Don't see a reason to force a trade to upside on #ETH here
1Hr #ethereum not showing much either
Going to wait to jump back into #Crypto space
Just A Personal Chart.Lets see how well these magnets can pull.
Down wave into our looming recession.
Recession pump (Its a trap)
New lows for ETH (Probably from low usage)
Start our macro wave 3 move for ETH (Should persist until 2029/2030)
This is just speculation.
ETHs next ATHs (Before wave 4) will be in Q1 2030.
As Always,
Good Luck And Safe Trading.

$ETH outperformed $BTC recently, how does it look now?Look into CRYPTOCAP:ETH
#ETH move looks similar > #BTC, right?
#ethereum tends to outperform #bitcoin after big runs & toward the end.
BUT
Don't see it as the end.
50% Fib roughly 2950
DOESN'T MEAN THIS YEAR or ASAP. It just means that it's a magnet.
Always keeping eye on #crypto #altcoin & especially #memecoins. They help signify cycles.
ETHUSD H4 Set Up To Test 2080In this update we review the recent price action in #ETHUSD and identify the next high probability trading opportunity and price objectives to target

ETH/USD CME Chart Update.Check It Before Trade On ETHETH We Have Two CME Gap Left At 2500$ level & Another One At 1430$ Level. I Expect A Pump Till 2k$ psychological Level Then A Dump Till 1.4$ And Then A Monster Pump Till 2.5K$

ETHUSD H1 Watching A Test of 1760 SupportIN this update we review the recent price action in #ETHUSD futures contract and identify the next high probability trading opportunity and price objective to target

CME GAP ETH MONTHLY VolumeJust pointing out the GAP lower
This rally was a BTC Spot rally and ETH never went to 2k
Just thinking out Loud and showing a GAP that has been printed in the Data
