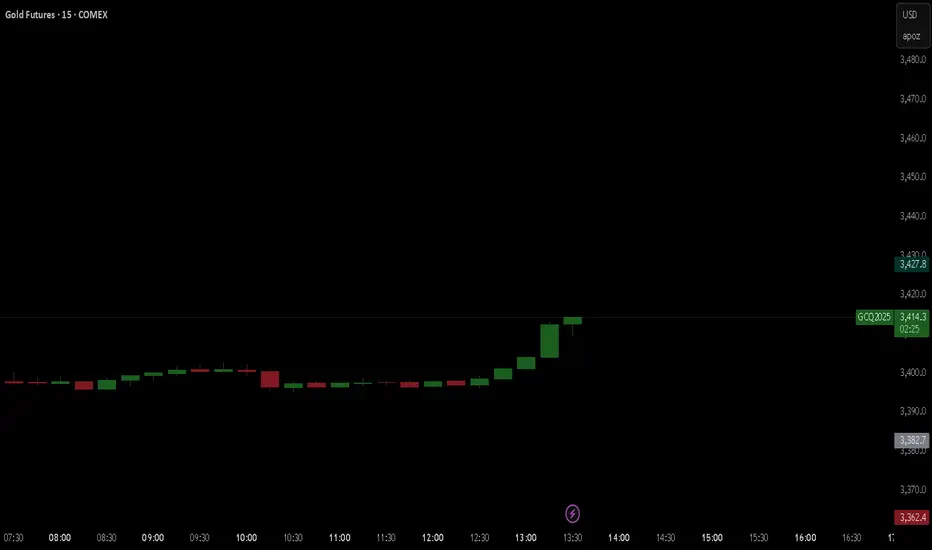
Twitter Speculation sent Gold FLIP Floppin!So yesterday there was a few Tweets that caused chaos in the market. Fed Rumors about Powell getting fired. Im still looking for my long. Waiting for a sweep on levels before getting active.
1OZ1! trade ideas

Gold LongsFollowing last weeks bias. Looking for REQH target.
Want to pair longs with a weekly profile. Ideally Monday or Tuesday creates the low of week. Will look to get onside with longs once theres a clear intraweek reversal. Trade the continuation higher. A close below 3320 is invalidation. Expecting previous week low to be protected and expansion to the upside

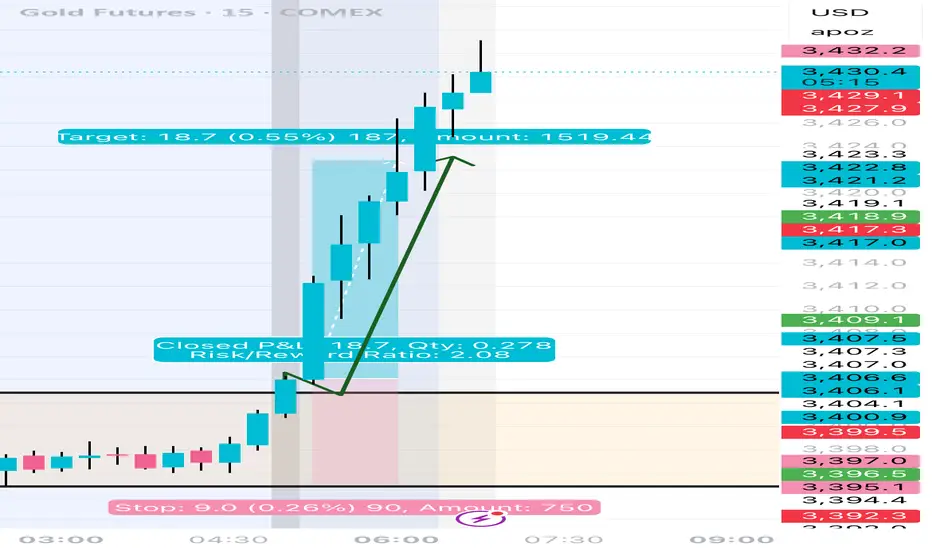
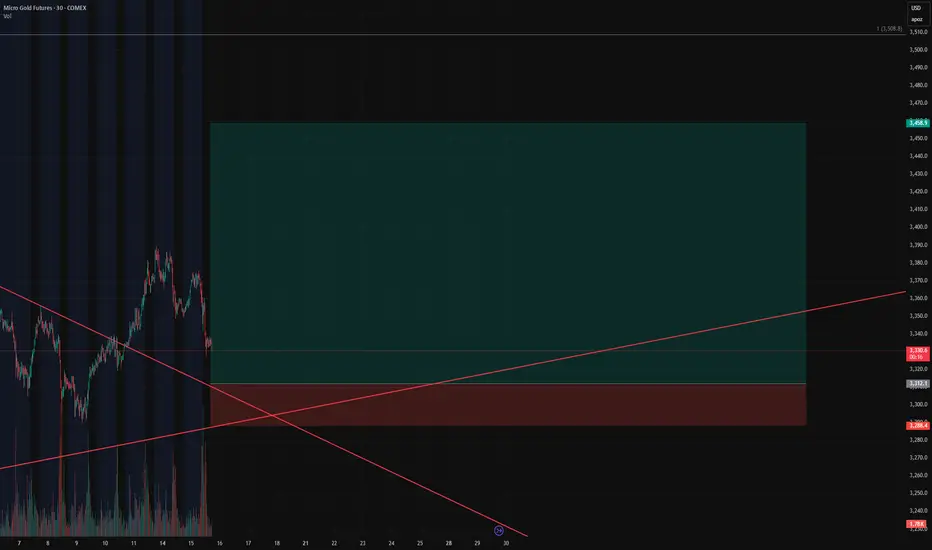
Gold Bulls Loading Up – Our Short Squeeze Trigger is Set!🚨 Gold Bulls Loading Up – Our Short Squeeze Trigger is Set!
We’re flipping the script on COMEX_MINI:MGC1! After a prolonged downtrend and textbook wedge compression, our breakout long is LIVE – but not without trapping the late shorts first.
💥 Entry: $3,312.1
🛑 Stop: $3,288.4
🎯 Target: $3,458.9
🧮 Risk/Reward: 6.19
Price just bounced at the retest of the wedge apex, and volume is confirming the move. If this holds, we’re riding momentum all the way up – and letting short pressure fuel the breakout.
📈 Trendline breached.
⏳ Time compression converging.
⚠️ If you’re still short, watch your stops!
The Gold Retrace for Ultimate Entry!looking for price to continue with its pullback to find where exactly support is. Once we see price establish support we should get some type of signal for entry and price can continue with this bullish price action to make new highs. If we get a full 71.8% pullback that should make for a nice bull run. Just need to wait for the confirmations first before reacting cause we might get a lot of chop until then.

Trapped orderflow. Gold Weekly Outlook. 19.07.2025,SaturdayExpecting a range bound market condition until any one of the VI on the weekly inverse. Trapped Orderflow

Gold and DXY. Day before CPI 14.07.2025, MondayExplaining about the thoughts on CPI. Expect major movements on GOLD

Shorting Gold again and againYep, Iam still thinking that gold should be shorted. Even though that i can see there is some huge liquidity up which should draw the money to it, but still on bigger timeframes, it shows weakness.
So here it is with targets. hopefully it goes through.
Good luck everyone.
XAUUSD, GOLDBullish view on GOLD for New York session, Daily FVG, if price taps in will look for confirmations to go long

This is a good video7.14 . 25 this is a great video because there are so many examples of patterns to look at and there weren't that many markets that I was following and about 3 or 4 of the markets actually had dramatic movement in the direction you would expect and this is an example of setting up your pattern and letting the pattern take care of you as it gives you the probable Direction the market would take and there would have been no significant drawdowns or retest associated with stops... As was seeing in the coffee Market.

Gold is Setting up for another moveLooking for price to make some impulsive moves before we get active. Looking like they are trying to establish a low for the week before they go full on bullish. waiting for them to find that bottom.

Gold.. in the fog of global chaosNotes:
Markets for metals are at a ATH.
Global events are evolving rapidly.
Most of the time, war=raging gold prices
Markets are ripe to retrace and or maybe reverse at all. Taking setups on gold with a grain of salt.
Gold is an event driven market. I expect for now a consolidation until bearish signals show.
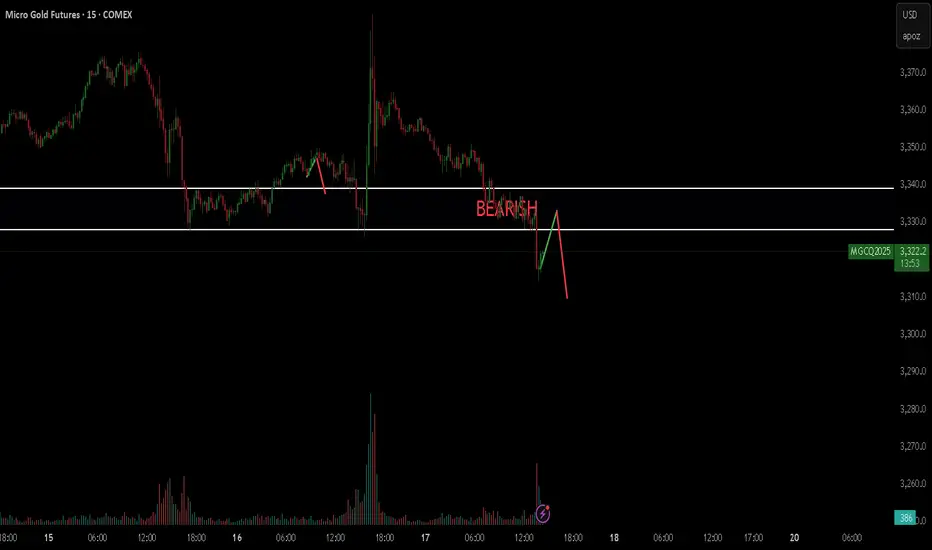
Shoring GoldSo here we go again with gold.
there are two theories at this point, a bullish case and a bearish case.
The bullish case that the price broke a bearish trend and moving upwards.
For a bearish case, the price didn't close that strong above the last swing. Also the whole structure is bearish so this last up move could be very well a trap for buyers.
On the 4h tf, there is an FVG, bearish one that the price so far is reacting to.
So Even though there is a strong up move, i still lean bearish.
Later today once i get a confirmation, i will update the idea.
I might be very wrong on this trade, my confidence in this trade is 4 out of 10. So Use smaller size position.
Also iam expecting the price to revisit 3320 USD

GOLD - GC | Weekly Recap & Plan 13.07.2025🟡 GOLD (GC) Weekly Recap & Outlook
Symbol: GC1!
Date: Week of July 8–12, 2025
Timeframes Used: 4H, Daily, Weekly, HTF structure
🔍 What Happened Last Week?
Gold saw a strong rejection from a confluence of two HTF trendlines, signaling resistance.
But that move was absorbed by:
🟦 Daily Demand (blue zone)
🔵 Daily Swing Liquidity (blue line)
This builds a bullish structure on the daily chart.
🧭 Scenarios I'm Watching
Scenario 1 — Minor Pullback:
🔹 Price may revisit the Daily Gap (pink line) and find support for continuation.
Scenario 2 — Deeper Pullback:
🟣 Price could retrace into the HTF bullish trendline (purple) before resuming upside.
🗞️ Bonus Macro Scenario: Powell Resignation?
There are growing rumors that Fed Chair Powell might resign this week.
📈 If that happens, I expect strong bullish momentum in Gold —
→ very limited retracement, and
→ potential straight breakout into new highs.
🎯 Targets for the Week:
✅ 1st Target:
W C DOL (purple line) → acts as a primary take profit area.
✅ 2nd Target (Expansion):
EQHs / DOL (extended purple levels)
Game Plan:
Watch for LTF confirmation on both retracement zones.
Maintain bullish bias unless Daily Demand fails.
If Powell resigns, be ready for breakout setups.

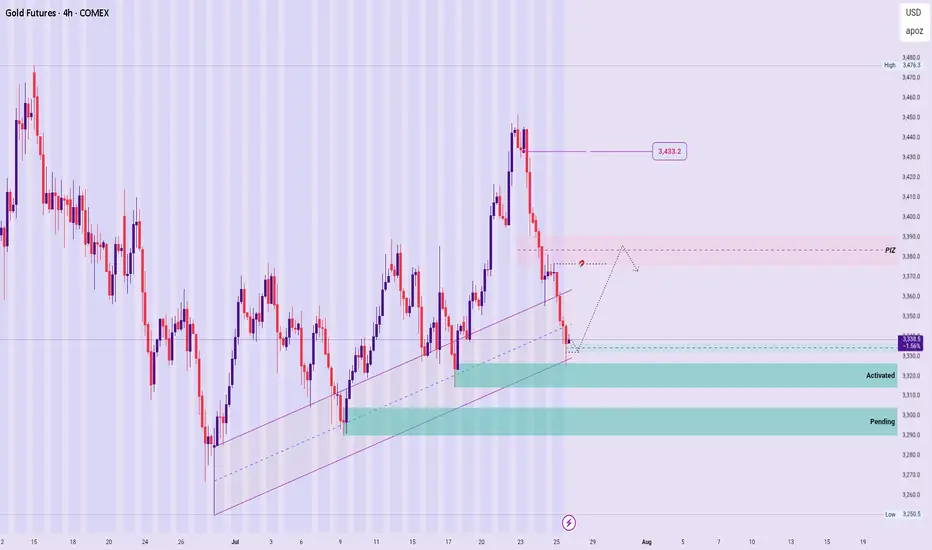
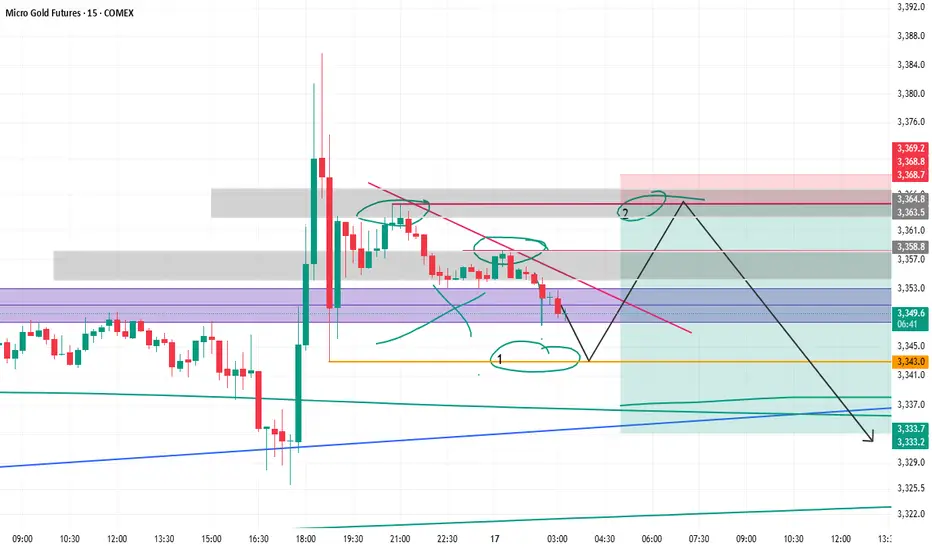
GOLD – New Week Technical Bias (Market Open)
Structural Outlook:
The broader bullish sequence remains valid, with no structural breach confirmed yet.
However, price is currently reacting at a sensitive level, warranting measured caution.
Zone Dynamics :
▪︎ A recently activated Rejection Zone is expected to support a gradual impulse toward the PIZ.
▪︎ From the PIZ, two scenarios unfold:
a. If it becomes a Price Base, we may see a continuation rally toward the 3433.2 region.
b. If the PIZ acts instead as a Price Cap, price may reject lower, targeting the pending Rejection Zone beneath or deeper, should the current zone fail to hold. Thereby presenting a Bearish structural formation.
Summary:
The directional bias remains bullish unless a clear Structure Breach (SB) occurs below key support levels.
Stay adaptive, and observe the PIZ reaction closely for directional confirmation.
🛑 Disclaimer:
This is not a trade signal. These are high-level technical insights meant for educational and analytical purposes. Always validate with your system and trade with discipline and risk awareness.
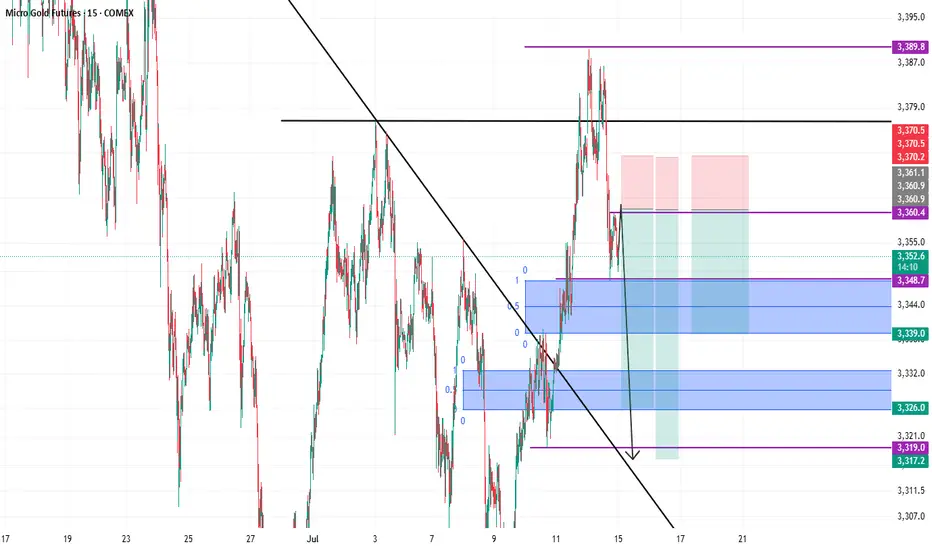
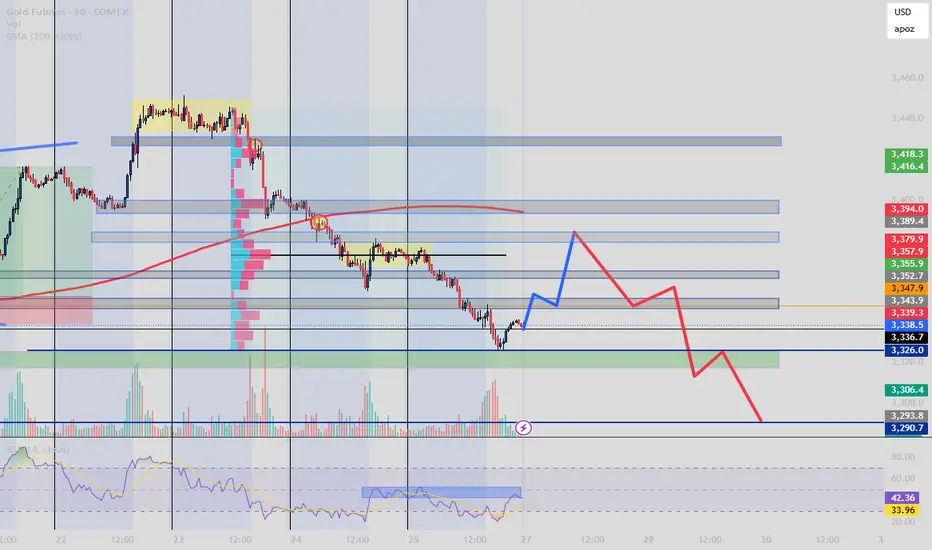
Gold Futures and the BOS Brearish Movement Steps In?After a clear break of structure and consistent rejection below the 209 EMA, price is retracing toward a key zone of confluence between 3347–3379.
This area aligns with:
Former demand turned supply (OB)
Volume cluster (high activity zone)
RSI hidden bearish divergence
Fair Value Gap (inefficiency fill target)
My expectation: a short-term bullish correction (blue) into that zone, followed by a high-probability sell-off (red) toward 3306–3290.
Bias : Bearish unless price reclaims 3394+
Strategy: Smart Money + Volume Profile + RSI Confirmation
Follow @GoldenZoneFX For more content and valuable insights.
Is GC1! GOLD At A Turning Point - Idea On Short DirectionProbably Gold is not going to be cheaper in the near future but we have seen some points that hold in the past break recently...
This is a view on the Gold chart that is explanatory by itself.
Probably tracing some support horizontally under the price at key level with the idea of, if it break follow the trend in short direction side...
GOLD BULLISHHello,
Here's the gold analysis:
Gold will have started an upward trend with a good probability of 80%.

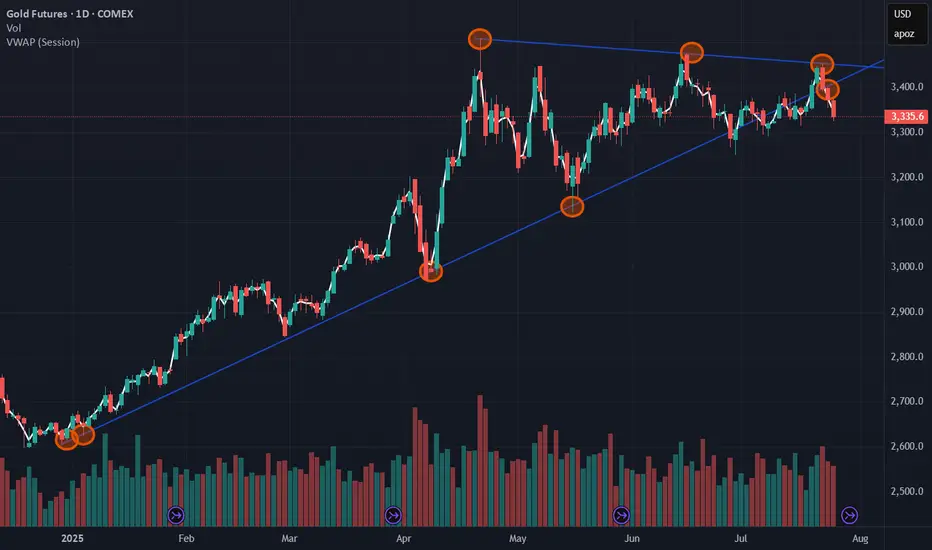
Gold to $3700 - $3800the price of gold has finally broken out of a long standing symmetrical triangle and an established 2 touch point trendline. It is currently consolidating above the broken trendline. If a 4H candle closes above the red dotted trend line we could see a massive pump up. If price closes below green upwards trendline then strategy is invalidated and reassessment needed. This is a long hold trade idea

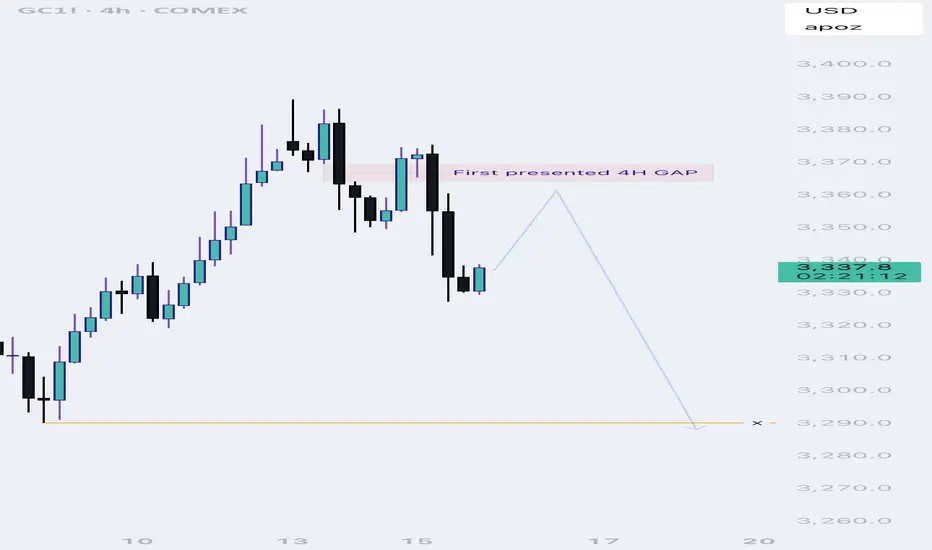
Gold short Read this clearly, my confidence in this trade is 3 out of 10.
Use very small size on this trade, as iam not sure at all that this is even the right thing to do.
The chart is messy, and there is consolidation is going on.
if the price didnt make it to nr 1 circle, dont worry about it. The most important thing is the close below the FVG.
Also confirm on lower time frame to see how the price reacts to the entry levels. If anything is going to happen, is going to happen at those levels.
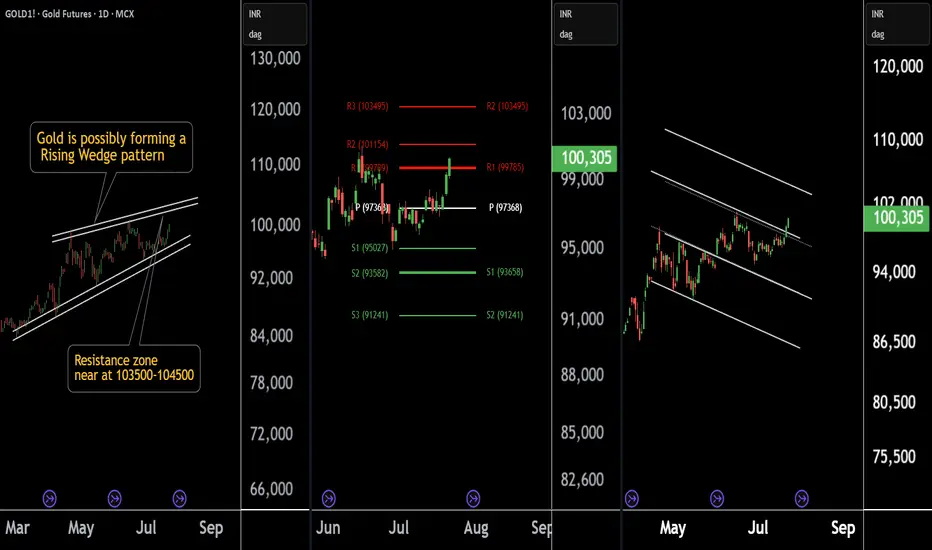
Gold at a Crossroad: Long or Short? Key Levels in FocusThere are three chart of Gold .
Gold1! is forming a Rising Wedge pattern, with resistance positioned between 103500-104000 levels.
Gold1! is facing Pivot Point resistance around the 103500 level, indicating potential supply pressure.
Gold1! is approaching the parallel channel resistance, and the upside move is nearly complete in percentage terms, with resistance around 103800-104000.
if this level sustain then we may see first of all higher prices then again fall in gold1!
Thank You !!
GOLD BULISHHello, I hope you are well today. Gold will likely rise. I advise you to buy into your positions.