GCK2026 trade ideas
Gold: Bullish Pitchfork Holds Despite TurbulenceRecent geopolitical activity has caused turbulence in Gold Markets. News agencies are reporting stabilisation and the Pitchfork remains bullish.

Move\Manipulate/Grab/Consolidate/PushFIrst ever idea on trading view.
Bias: Bullish
I have deveoped a stratagey that uses the Trend indicator (2.3) by dviz
Wont say everything but if you get a candle whos body is completly in the "cloud" of the trend indicator.. this is a signal
candle body
1 must be smaller than the wick
2 wick has to be wick outside the cloud
green candle for reversal
red hold
70 tick stop
+50 tick tp1
+70 tick tp2
+120 tick tp1
when trade hits tp1 = risk free trade

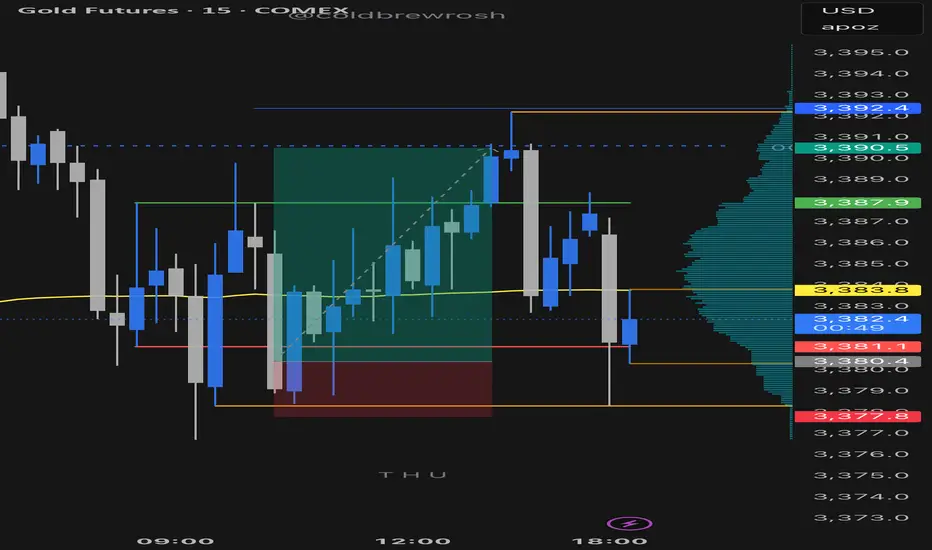
Long & Short Entry Forecast For GoldCooling war tensions seem to be cooling the Gold bullish rally as well.
But we're still in the same range since April 15th and will likely stay in the range until further notice *or the next tweet*
The Sell entry is great now cos we're near the top of the high volume node, so even if we consolidate around that POC this sell entry will still be putting us closest to the top of the node.
Hold your sell and TP at the VAL . We have a very deep low volume area there and its being a point of support since April. So we can place bets with small risk on hoping it holds cos if it doesn't, it wont be pretty. That is still the best place to buy regardless. So manage your risk accordingly
TP 1 for the Buy trade is at the POC , which also happens to be the top of the huge volume node. Totally make sense to take a decent chunk of profit of your position there, then move you stop loss into profit and grab some pop corn. Depending on the news , the best case scenario of for the uptrend is to continue all the way up to TP2 which is at the VAH
Secure the bag :)
Enjoy

Patience has to be the Major Play in waiting on these Set ups! Was waiting for the sweep on gold to happen and they didnt do it till the very end of the day yesterday. Looking for the bullish action to continue. If we can get a breakout tonight then i will look for possible levels of support.

AM gold futures trade. Change in rhe state of delivery with Footprint confirmation for the buy. 3 hours to finish due to market conditions but over 1k booked.
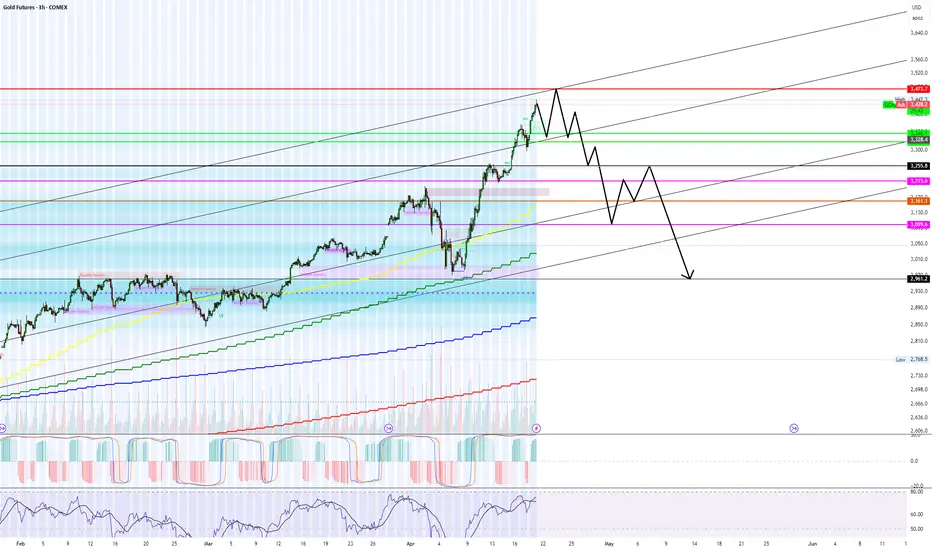
Agree to disagree... Gold is topping right now.My price path seen above is a complete guess but it stems from long term trend lines and more importantly order flow from last week.
On Thursday there was a #1 trade on AMEX:PHYS for $200+ Million at the green levels in my chart above (Equivalent levels). PRICE WILL 100% go to my green lines by end of this week 04/25.
We are over shooting the dark pool sale but a lot, however, this is always to trap retail and create fomo/peak fear.
In the correction/recession cycles, gold ALWAYS TOPS LAST before the crash...
New Week! New Opportunities on GOLD! With the recent activity in the middle east expecting prices to continue bullish. I was looking for this move last week but it seems the holiday delayed the process. If we can get a full breakout above the previous daily High level that will be confidence that we are moving bullish for the rest of the week.

Have we made a Low for the Week yet on Gold???Im looking for price to sweep Monday's low before deciding what it wants to do. I want to see everything line up inside of the killzone to take advantage. Just have to be patient. We still have a lil time so sitting on my hands until it all looks clear to proceed with the move.

Gold Slides as Markets Downplay the Fallout of ME EscalationGold prices are trending lower today after a slight positive open, struggling to hold near $3,365 per ounce, hovering just above the lowest level in over ten days.
This weak performance comes as markets continue to downplay the consequences of the unprecedented U.S. strike on Iran’s nuclear facilities.
Previously, experts had viewed a strike on Iran’s nuclear sites as the line between a limited bilateral conflict with Israel and a full-blown regional war with global economic costs. Fears centered around a potential Iranian—or proxy—attack on the region’s vital oil and gas infrastructure, which supplies over a fifth of global energy needs.
However, those fears have yet to materialize, offering markets some reassurance that the escalation will not trigger a major shock that could reignite concerns over global economic stability. This narrative of containment has stripped gold of the geopolitical risk premium it previously enjoyed.
According to the New York Times , some experts believe Iran is unlikely to disrupt energy flows in the region as long as its own export facilities remain intact. In another word, any Iranian attempt to destabilize energy markets may invite retaliatory strikes on its own vital oil infrastructure—further damaging its already fragile economy. Axios quoted Brookings Institution foreign policy director Suzanne Maloney describing Iran’s parliamentary call to shut the Strait of Hormuz as symbolic, arguing that the Islamic Republic is unlikely to risk its economy or the rapprochements with Gulf neighbors.
That said, the Middle East’s unpredictable trajectory, with near-daily escalations, continues to unsettle markets and sustain elevated risk appetite, which could ultimately benefit gold.
In a New York Times opinion piece , Nicholas Kristof outlined three key risks that could stem from the U.S. strike on Iranian nuclear facilities: the nature of Iran’s response, whether the strike set back or accelerated Iran’s nuclear ambitions, and whether this is a step toward a broader war.
Iran’s response could range from symbolic gestures to reckless escalation, potentially dragging the U.S. deeper into direct involvement.
According to the Wall Street Journal , Tehran may choose to strike at evacuated U.S. bases in the region, as it did in response to the 2020 assassination of Qassem Soleimani, when Iran targeted the Ain al-Asad base in Iraq in what was described as a calculated, non-escalatory response. Alternatively, Iran could intensify missile strikes on Israel—viewed by some as Washington’s largest forward base—thus keeping the conflict somewhat localized for now.
Still, Iranian Supreme Leader Ayatollah Ali Khamenei may ultimately reject a ceasefire, unlike what his predecessor Ayatollah Ruhollah Khomeini did in the late 1980s to preserve the Islamic Republic. This keeps the door open to new and unpredictable rounds of conflict, according to The Times .
On the nuclear front, Washington Post columnist David Ignatius warned in an opinion piece that Iran could pursue a crude radioactive “dirty bomb” using highly enriched near weapons-grade enriched uranium. Such a scenario would also be dangerously uncertain. In my opinion, it is unlikely that the U.S. or Israel would simply stand down after such a development, possibly setting the stage for the most extreme and dangerous escalation yet.
This could align with the protracted duration of the war and reports that Israel’s defensive missile stockpiles are running low, which raising the stakes. Israel may feel compelled to force Iran into surrender, as the U.S. did with Japan, though unlike Japan, Iran could be a nuclear state. Given Prime Minister Netanyahu’s political stance, a settlement that leaves Iran’s nuclear or ballistic program intact is unlikely to be accepted. Iran, for its part, firmly rejects dismantling its programs, adding to the likelihood of prolonged conflict and worst-case scenario.
Despite the market’s muted reaction to the U.S. strike, the surrounding risks remain significant and unresolved. As long as their realization remains uncertain, volatility in gold and oil prices may persist until the conflict is either resolved or definitively contained.
Samer Hasn

Buying the Dip or Catching a Knife? My Gold Setup Explained.Entered a long position on XAU/USD from the 1H demand zone following sharp intraday selling into a key support level. With gold hovering near $3,300 and a significant testimony from Fed Chair Powell on deck, the setup aligns with both technical rebound potential and fundamental uncertainty that could fuel upside.
The goal here is to play the liquidity vacuum left after aggressive positioning was cleared, with tight invalidation and asymmetric reward.
Technicals:
• Entry aligned with prior price inefficiency and confluence of multiple demand zones
• 1H structure shows clear deviation below the range with immediate buy-side response
• EMA channel flattening, indicating potential compression ahead of expansion
• First target: $3,352
• Risk-managed with defined stop-loss below $3,260
Execution Note: This is not a “hold forever” trade. It’s an opportunistic reaction to unwind + sentiment imbalance.
Fundamentals
• Gold saw a 25% surge in 2024 due to safe-haven demand and dovish policy, but enters 2025 under pressure from:
▫️ A strong USD
▫️ Higher cost of carry
▫️ Speculators taking profit
• Fed policy remains the core variable:
▫️ A hawkish tone from Powell could weigh on price
▫️ Rate cuts would likely revive bullish momentum
• Central bank demand remains supportive
• Geopolitical tensions (Russia-Ukraine, Israel-Iran) could trigger safe-haven bids again.
Bearish headwinds:
• Waning bullish momentum per RSI divergence
• Reduced rate cut expectations post-election
• Powell’s testimony could revive volatility either way.
This is a short-term tactical long, not a macro bet. With sentiment temporarily overextended and key support defended intraday, this is a high R/R window to exploit Powell-related volatility.
Let’s see how price reacts into $3,350+. Any sustained strength there would open room toward $3,400, while failure would confirm a retest of $3,260s.
Note: Please remember to adjust this trade idea according to your individual trading conditions, including position size, broker-specific price variations, and any relevant external factors. Every trader’s situation is unique, so it’s crucial to tailor your approach to your own risk tolerance and market environment.

Waiting for Price to Hit the Green Zone for Long in GCAt the moment, I’m patiently waiting for price to pull into the green zone below. If price hits this area, I will look for a high-probability long trade, targeting the upper red zone for a very extended move.
However, my stop-loss will remain very tight — placed just below the green zone — because I will only stay in the trade if buyers react strongly from this level.
If price instead reaches the red zone first, I will be looking for a short opportunity back down toward the green zone.
Important: I do not simply enter based on zones alone — I study how buyers and sellers behave when those zones are touched. I also use order flow to catch any trapped traders or aggressive buyers/sellers inside these areas, which gives me confirmation to take the trade or stay out if the move is weak.
Patience is key here — I am not in a rush. I want a clean entry with strong confirmation, then I will let the market do the work! ✅

Gold Sliver Spread is Pointing Downward - Silver to TrendGold-silver ratio dropped from 107 to current 91. What does this mean? Does it indicate that silver is about to trend higher, or is it a sign that gold will continue its trend?
If you take the gold prices on 'Liberation Day' on 2nd April 2025 - Gold at $3,509 divided by Silver at $35 = 100.25
Today, the gold prices at 3,400 divided by the silver prices at 37.36, you will get the ratio as 91.
Based on this historical development over the last 50 years, gold silver spread has range bound within this range of 40 and 100, and likely it should remain this way.
Studies shown it has just reached 100, forming a potential inverted hammer, and could be on the way down to its lower band. Either the 65 band or 40 band.
If that were to happen, this also means the Silver’s trend is likely to pick-up faster than gold did.
On 05 April 2024 a video analysis I have published, title “Silver is Next to Rally After Gold”, then I presented on its fundamental and its technical reasons.
By the way the cup & handle formation, it is taking a very good shape today.
On that analysis, I suggested in time to come, when Silver to catch-up with gold, it will be fast and furious. And I believe the time is near as the ratio now dip to around 91, and it seems more room for more downside.
This means with so many uncertainties and fear of inflation coming back again, Gold may still trend higher, but this time the rate-of-change for the silver to move higher is faster than that of gold. If the ratio continue to decline, we should see a much firmer silver prices from the current.
Historically, gold and silver have been used as money, and even today, if you take any grams or an ounce of gold or silver to banks with bullion departments, you can exchange it for cash.
As the world searches for the next reserve currency, precious metals have become a safe haven. That’s why gold has been trending upward over the years, especially when inflation hit a high of 9% in 2022. When gold becomes too pricey, investors often look for alternatives like silver. This also explains why, during most financial crises, the gold-silver ratio dips, indicating that silver is catching up with gold.
Micro Silver Futures
Ticker: SIL
Minimum fluctuation:
0.005 per troy ounce = $5.00
Disclaimer:
• What presented here is not a recommendation, please consult your licensed broker.
• Our mission is to create lateral thinking skills for every investor and trader, knowing when to take a calculated risk with market uncertainty and a bolder risk when opportunity arises.
CME Real-time Market Data help identify trading set-ups in real-time and express my market views. If you have futures in your trading portfolio, you can check out on CME Group data plans available that suit your trading needs www.tradingview.com
Trading the Micro: www.cmegroup.com
www.cmegroup.com

Global Activities are looking to Push Gold bullishWaiting to see a full on break out before confirming its going to be bullish for the week but it sure does look like that's what its going to be for the next few days. Just be patient and wait for price to confirm.

when price consolidates, its just setting upLooking for a bigger moving going into mid week. Tues spent the entire day consolidating. Now im thinking we getting ready for a bigger move. Just trying to be patient and wait for it. Price should give us some kinda sign on what it would like to do as we coming into the Asian Killzone.

GOLD- WATCHING IT CLOSELY.🔍 Chart Analysis
🏗️ Structure & Patterns
A perfect Cup & Handle formation is visible.
Price has broken out above the neckline (~₹98,000) but is currently in a pullback phase, forming the handle.
A falling wedge breakout is also seen prior to the breakout — a bullish continuation pattern.
📐 Fibonacci Retracement
0.382 level at ₹96,132
0.5 level at ₹95,132
These retracement levels align well with the handle zone and offer potential re-entry/buy levels.
🛡️ Key Support Levels
Level Description
₹98,000 Former resistance, now short-term support
₹96,132 38.2% Fib retracement
₹95,132 50% Fib retracement (also demand zone)
₹94,200 Major support
🔵 Note: Breakdown below ₹95,132 is bearish confirmation.
📊 RSI Analysis
RSI = 54.59, cooling off from overbought levels.
RSI has crossed below the RSI-based moving average (63.43), indicating temporary loss of momentum.
📈 Projected Path
The handle curve suggests a possible rebound after this pullback, targeting previous high ~₹99,358, and possibly ₹101,317 (height of cup projected upward).
✅ Summary
Category Observation
Pattern Bullish Cup & Handle with falling wedge breakout
Trend Bullish above ₹95,132; Weak only if closes below
Key Levels Support: ₹98,000 / ₹96,132 / ₹95,132 / ₹94,200
Resistance: ₹99,358 / ₹101,317
RSI Cooling down; not overbought; healthy retracement
Bias Bullish with pullback in progress; re-entry near ₹96k–95.1k zone
🧠 Final Thoughts
Pullbacks are healthy in bullish setups like this — watch for reversal signs near ₹96,132 or ₹95,132.
A daily close above ₹99,358 can trigger Cup & Handle target breakout toward ₹101,300+.
Maintain bullish bias unless ₹94,200 is breached.

Holiday yesterday so no play! can we get it today?As we get ready to close out the week we are looking for the reversal to play out. We have been in a casual consolidation all week. Just looking for price to step outside of value one more time so that we can get a entry for it to continue pushing bullish.

Gold Finally Swept the Lows!!!!Waited for this all damn day and it didnt happen till just before the day closed. Now looking for the action to continue. If they give signs before the killzone then its a go going into London session.

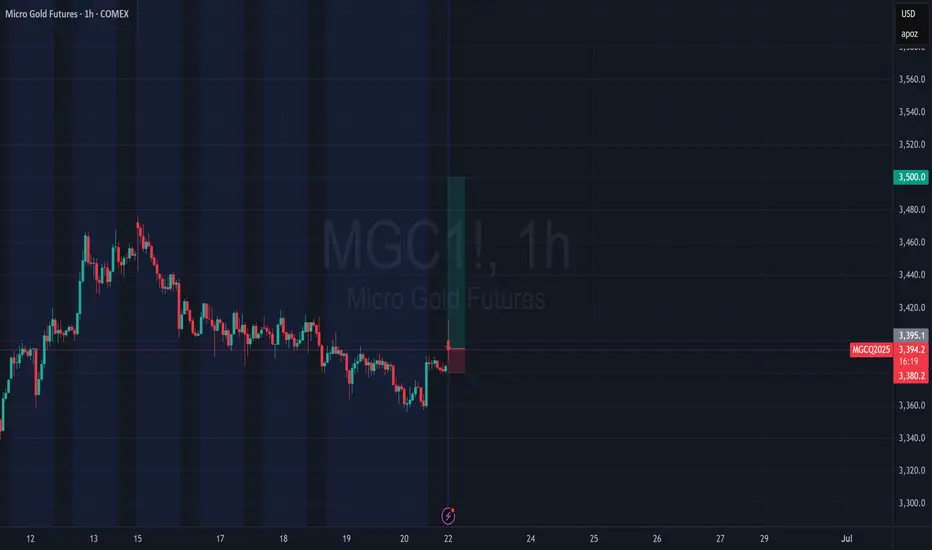
$MGC / $GC / Gold - Pre Market Update - June 16Hello Fellow Gamblers,
This dip on gold is tracking with our Wave 4 dip. If the level hold we're going towards Wave 5 at 3504 and above.
Losing 3416 can trigger price to retrace all the way down towards 3358.
- Levels to Watch: 3504, 3416, 3358, 3283

Gold is giving up a Set up! Been waiting for this set up. But trying to remain disciplined on this one. I Need to see a sweep of lows at this point in order to be interested in the buy. Once we see that its on. Until then we sit on hands and wait.

Seeking new ATHAlready broken through top off pennant after long consolidation so likelihood of big drops are slim... and based on events, likelihood of retesting ATH between now and end of the month...

Gold Trade Suggestion
With a 90% win rate on recent gold trades, I recommend a long position.
Target 1: Around 3290.6
Target 2: Around 3300
Strong buying pressure is present in the market — big buyers are here and pushing with force.

Gold LongsBullish weekly bias for Gold.
Classic Expansion Weekly profile in play. Price opened lower first, Im treating this as the possible manipulation for the week. Tuesday swept key ssl and closed back inside the range.
Drop to a 4h and OB is confirmed. 1h CISD aligned with 4h. Execution off 4h OB with stop at OB Low / Tuesday low. If BSL is the draw, I would like to see Tuesday low be protected.
LRLR is first low hanging fruit objective. 3420 roughly, with equal highs at 3476 being final target.
