How to Trade Double Tops & Bottoms in TradingViewLearn how to identify, validate, and trade double top and double bottom reversal patterns using TradingView's charting tools in this comprehensive tutorial from Optimus Futures. Understanding these classic chart formations can help you spot potential trend reversals and capitalize on contrarian trading opportunities in the futures markets.
What You'll Learn:
• Understanding contrarian vs. continuation trading strategies and when to use each approach
• The psychology behind buying low and selling high through reversal pattern trading
• How to identify double top and double bottom formations on any timeframe
• Key characteristics of valid double tops and bottoms, including volume confirmation
• Using TradingView's XABCD pattern tool to validate potential double top/bottom setups
• Real-world example analysis using crude oil futures charts
• Risk management techniques for trading reversal patterns
• How to calculate appropriate entry points, stop losses, and profit targets
• Setting up 1:1 risk-reward ratios for mathematical trading edge
• Understanding win rate requirements for profitable pattern trading
• How double bottom patterns work as the inverse of double top formations
This tutorial may benefit futures traders, swing traders, and technical analysts interested in contrarian trading strategies and reversal pattern recognition. The concepts covered could help you identify potential turning points in market trends and develop systematic approaches to trading these classic chart formations.
Visit Optimus Futures to learn more about trading futures with TradingView: optimusfutures.com/Platforms/TradingView.php
Disclaimer:
There is a substantial risk of loss in futures trading. Past performance is not indicative of future results. Please trade only with risk capital. We are not responsible for any third-party links, comments, or content shared on TradingView. Any opinions, links, or messages posted by users on TradingView do not represent our views or recommendations. Please exercise your own judgment and due diligence when engaging with any external content or user commentary.
This video represents the opinion of Optimus Futures and is intended for educational purposes only. Chart interpretations are presented solely to illustrate objective technical concepts and should not be viewed as predictive of future market behavior. In our opinion, charts are analytical tools—not forecasting instruments. Market conditions are constantly evolving, and all trading decisions should be made independently, with careful consideration of individual risk tolerance and financial objectives.
GCV2015 trade ideas

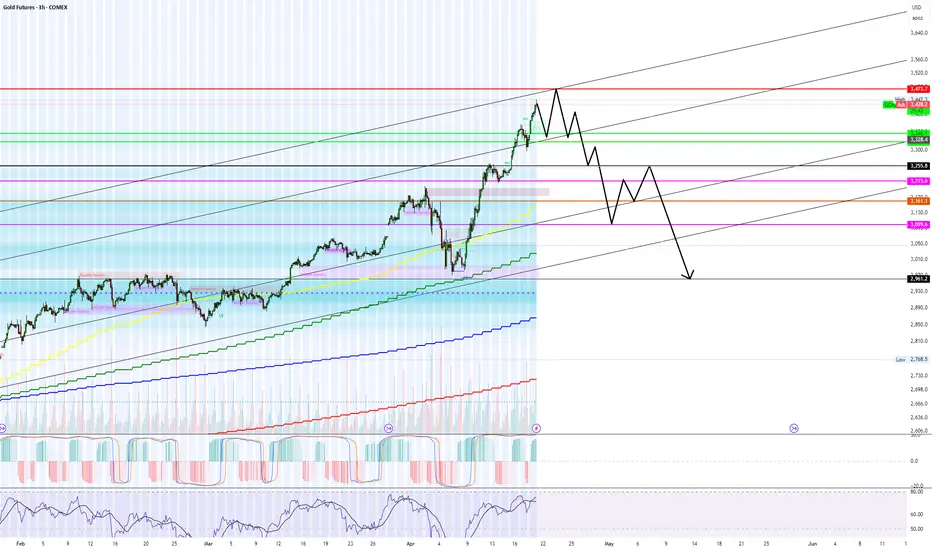
Long & Short Entry Forecast For GoldCooling war tensions seem to be cooling the Gold bullish rally as well.
But we're still in the same range since April 15th and will likely stay in the range until further notice *or the next tweet*
The Sell entry is great now cos we're near the top of the high volume node, so even if we consolidate around that POC this sell entry will still be putting us closest to the top of the node.
Hold your sell and TP at the VAL . We have a very deep low volume area there and its being a point of support since April. So we can place bets with small risk on hoping it holds cos if it doesn't, it wont be pretty. That is still the best place to buy regardless. So manage your risk accordingly
TP 1 for the Buy trade is at the POC , which also happens to be the top of the huge volume node. Totally make sense to take a decent chunk of profit of your position there, then move you stop loss into profit and grab some pop corn. Depending on the news , the best case scenario of for the uptrend is to continue all the way up to TP2 which is at the VAH
Secure the bag :)
Enjoy

Double Top Breakdown at Resistance ZoneThe chart reveals a classic Double Top pattern formation near the 3,360–3,480 resistance zone, followed by a clear bearish rejection (highlighted with red arrows). This confirms the presence of strong supply pressure in that region.
🔍 Key Technical Highlights:
🔺 Double Top Pattern
The price formed two swing highs near the resistance zone, failing to break above.
After the second peak, the price started declining, confirming the reversal pattern.
📉 Bearish Channel
The recent downtrend is contained within a descending channel, with consistent lower highs and lower lows.
Price broke below the neckline of the double top pattern around 3,270.
🎯 Target Projection
Based on the height of the double top pattern, the projected downside target is near 3,207.5, aligning perfectly with the support zone marked below.
🟠 Historical Support Areas
The large orange circles indicate key reaction points, confirming that the 3,207–3,220 area has acted as support in the past.
📊 Outlook:
If the current bearish momentum continues, price is likely to head towards the support target zone at 3,207.5. Any pullback toward 3,320–3,350 could provide a shorting opportunity with stops above the recent highs.
🔧 Bias: Bearish
📍 Resistance: 3,360–3,480
📍 Support: 3,207–3,220
📍 Target: 3,207.5

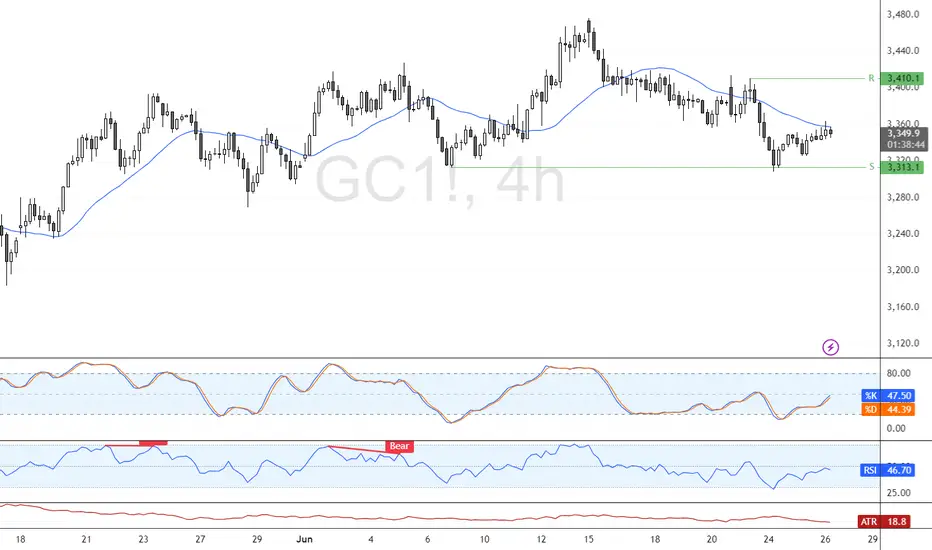
GOLD Can Turn Bearish Now, After Completing a 50% Retracement!GOLD futures analysis for Wed Jun 26th.
Price reached the -FVGand is reacting to it now.
This, after pulling back tothe 50% fib.
Should the FVG fail, Gold is bullish. This is not
supported by fundamentals, though.
As the market environment is more risk on than
off, I expect the -FVG to hold, and the retracement
of the last impulsive move down to end, and a new
bearish leg to begin.
Enjoy!
May profits be upon you.
Leave any questions or comments in the comment section.
I appreciate any feedback from my viewers!
Like and/or subscribe if you want more accurate analysis.
Thank you so much!
Disclaimer:
I do not provide personal investment advice and I am not a qualified licensed investment advisor.
All information found here, including any ideas, opinions, views, predictions, forecasts, commentaries, suggestions, expressed or implied herein, are for informational, entertainment or educational purposes only and should not be construed as personal investment advice. While the information provided is believed to be accurate, it may include errors or inaccuracies.
I will not and cannot be held liable for any actions you take as a result of anything you read here.
Conduct your own due diligence, or consult a licensed financial advisor or broker before making any and all investment decisions. Any investments, trades, speculations, or decisions made on the basis of any information found on this channel, expressed or implied herein, are committed at your own risk, financial or otherwise.

July 4 GOLD FIREWORKS!!!Gold bout to POP!!!! and it could be seriously huge! Im just patiently waiting for a area of entry. I have never traded a July 4th Holiday with this much clarity on what I see so this could get interesting.

STEEL-NERVE SETUP – ARE WE RE-LIVING GOLD’S 2020 BEAR-TRAP?Retail sentiment is ultra-bearish, positioning is cooling, Silver is outperforming and the S&P 500 is screaming risk-on … exactly the cocktail we saw in June 2020, right before Gold & Silver exploded higher.
1️⃣ WHY THIS FEELS LIKE 2020 AGAIN
2025 (now) 2020 (pre-rally) Read-through
> 70 % of TradingView ideas are bearish 💬 > 60 % were bearish Crowd may be offsides again
Managed-money net-longs -18 % from April peak 📉 -25 % from March peak Powder for fresh longs
First monthly ETF outflow (-$1.8 bn) 🚪 Record inflows Capitulation, not euphoria
Gold/Silver ratio down to 94 ⚖️ Fell to 95 Silver leadership = bottoming tell
S&P 500 at new ATH 📈 S&P at new ATH Risk-on backdrop identical
2️⃣ WHAT’S DIFFERENT THIS TIME
Real 10-y TIPS yield +0.7 % (2020: -1 %) → smaller monetary tail-wind.
Gold already at inflation-adjusted ATH → upside could be shorter & sharper, not a fresh super-cycle (yet).
3️⃣ CHECKLIST FOR A REAL BEAR-TRAP
Signal Watch-level
Gold holds $3 200–3 250 (100-d SMA + fib) Daily close above zone
Gold/Silver ratio breaks < 90 Momentum confirmation
CFTC net-longs < 150 k Position flush
ETF flows turn positive Fear → FOMO
S&P stumbles / vols spike Classic risk-bid for Gold
Need 3 of 5 boxes ticked to validate the squeeze thesis.
4️⃣ CATALYST CALENDAR
3 Jul – NFP: sub-75 k print could fire the opening salvo.
9 Jul – Tariff freeze decision: escalation would revive safe-haven demand.
15 Jul – CPI & 30-31 Jul – FOMC: dovish turn + soft data could complete the squeeze.
Disclaimer: This post reflects my personal opinion for educational purposes only; it is not financial advice. Trading futures and commodities involves substantial risk and can lead to total loss of capital—do your own research (DYOR) and consult a qualified professional before acting.

Gold, GC!, Sideway to the Downside (Long Term)06/30/2025, 10:30 PM PT
GC! is currently at its max around 3,500.
On the Weekly MACD, the crossover between MACD lind signal line already happened. There is also a bearish divergence on weekly chart.
On the Daily chart, RSI just crosses below 50 on RSI, and MACD shows weakness on the bull (it still not in the bear's territory just yet).
Reversasl to bear side may happen if price stays below 3,200
Bullish will continues if price break out of all time high
Current range for big timeframe from 3,200 - 3,500
Plan for swing trade:
Bullish Case (short term): break trendline. If hold above 3,360, price could go up to 3,400 -> 3,450
Bearish Case (short term): If price rejects and stays below 3,360, price could go down 3,310 -> 3,280
***Disclaimer: This analysis and trade plan are for educational and informational purposes only and should not be considered as financial or investment advice.

Gold back to $3300 - Week of July 4thPretty clear cut and dry, we have a significant mark down followed by a pump overnight.
Today and into tomorrow I’m looking for a drop back to the $3300 levels.

Possible Heads & Shoulders FormingWhen you see the inverse Heads n Shoulders forming, its hard to unsee it. I love this because it's lining up perfectly with the VAL of the intra day range and LVN ..This long trade is in line with my last week and current week forecast. We already hit TP1, TP2 is looking very likely after the pullback is done.
We are currently sitting at the POC, so expect some condolidation. Especially since we have ADP Non-Farm 2morow & Thurs. The news is the only thing that can throw a wrench into this setup.
Be sure to check out my last tradingview post and also checkout the weekly recap and weekly forecast videos i just posted on our youtube channel breaking down the in-depth analysis of this trade so you can understand my thought process on how it use Trend & Volume to execute this trade. Link is in my bio.
DEFINITIIONS
POC - Point of Control
VAL - Value Area Low
LVN - Low Volume Node
Study up on those.
CHEERS

Gold Update: Possible Triangular Consolidation Before New RallyIt looks like corrective wave 4 is in the making within a large Triangle
3 waves A, B and C already emerged in 3-waves structure
which confirms triangle
Wave D should stay under the top of wave B
Wave E could either touch or break down the support line
It should keep above the valley of wave C
Target area changed higher as this consolidation tends to narrowing within a
contracting triangle.
Lowest target now $3,900
Optimistic target is at $4,300
Breakdown below $3,123 would invalidate the pattern

Gold is Pushing Bullish but is it really ready???This looks like a early move to move full on bullish. I feel like it might need to sweep the low from mid week before they really ready to go bullish. waiting for things to show a bit more clear during the Kill Zone.

Is time to be a Gold Bull?Gold has been steadily repricing lower prices since June 16th after it took out May 16th's High. On Friday, June 27th, Gold moved into the Daily BISI (+FVG) zone and retraced upside. We may see another lower prices to purge the sellside liquidity before reverse upside for the short term. I don't expect another ATH next month, unless we have the right catalyst to do so. I'd anticipate for the price action to remain inside a large consolidation within the current Dealing Range as indicated in the chart. My Bullish case will be if price breaks above the 3500 convincingly, and the Bearish case if it breaks below 3120 convincingly also. In the meantime, we'll have to be satisfied playing tic tac toe inside the range. Don't get married to a strict bias at this time. Stay nimble, and let the price presents itself to you.

Global Gold at the Crossroads of CrisisGold’s response to historic geopolitical crises demonstrates that while “big fear” is rapidly priced in, the durability of rallies—or the depth of corrections—depends on a confluence of monetary policy, dollar valuation, oil prices, and the genuine scale of the threat.
At present, the gold market sits squarely between global “fear of instability” and “hope for de-escalation.” Divergent signals from the Fed, global central banks, and oil markets only deepen volatility, making investor decisions more complex. As previous wars (Iran–Iraq, Ukraine) have shown, gold is prone to both scenarios, but its long-term direction will be shaped by a mix of economic, policy, and psychological factors.

Agree to disagree... Gold is topping right now.My price path seen above is a complete guess but it stems from long term trend lines and more importantly order flow from last week.
On Thursday there was a #1 trade on AMEX:PHYS for $200+ Million at the green levels in my chart above (Equivalent levels). PRICE WILL 100% go to my green lines by end of this week 04/25.
We are over shooting the dark pool sale but a lot, however, this is always to trap retail and create fomo/peak fear.
In the correction/recession cycles, gold ALWAYS TOPS LAST before the crash...
GOLD WATAFALL INCOMINGOkay so this is called a channle and golds not holding it to well so down we go also with war pressues relaxing its a real GOLDKiller anyws use SL be safe and
have fun! XD

Short GC futures at 3,290.Strategy: Short GC futures at 3,290.
Entry: 3,290 (near current price, aligning with resistance).
Target: 3,250 (support level, 1.2% downside).
Stop: 3,310 (above resistance to limit risk).
Rationale: Bearish technicals (RSI divergence, declining open interest) and USD strength support a short-term pullback, with US Retail Sales as a potential catalyst.

Gold Futures BOS does Bearish move might steps in?There is a breakout of the EMA with confirmation of rising Volume, which indicate a strong short position also with NFP shows strong job claims that's why we anticipated a fall in gold, especially for those who want to enter lastly you should consider waiting for a pullback to catch the second move. Follow GoldenZoneFX For more content and valuable insights.

Gold 4H-figment of my imagination. Chart Overview:
Timeframe: 4H (MCX)
Current Price: ₹95,524
Volume: 1.6K
Trend: Short-term bearish
📉 Observations:
1. Break of Support Zones:
Multiple support zones have been drawn on the chart:
Around ₹96,200, ₹94,700, ₹91,800, and finally near ₹86,600–82,200.
Price is now trading below the ₹96,200 support, showing clear weakness.
2. Structure:
This looks like a lower high – lower low formation.
Recent price action has broken previous swing lows, indicating bearish momentum continuation.
3. Next Key Supports:
₹94,700 – could act as the next immediate support (minor bounce possible)
₹91,800 – stronger historical zone
₹86,600 to ₹82,200 – major demand zone (strong support last seen in April)
4. Volume Analysis:
Volume hasn’t spiked significantly on the recent fall, suggesting no panic yet, but also lack of buying interest.
📌 Conclusion:
The trend is weak and corrective, favoring sell on rise until price reclaims ₹96,200 convincingly.
Safe buy zone: Near ₹91,800–₹86,600, if price shows reversal signals.
Watch out: If ₹91,800 breaks, ₹86,600 or even ₹82,200 could be tested.

Navigating Gold Futures: Support, Resistance, and ProjectionsCOMEX:GC1!
The chart appears to depict a clear five-wave pattern: I, II, III, IV, and V.
Waves I to III show strong upward movements, indicating bullish sentiment.
Wave IV looks like it could be a corrective phase, with a potential dip before another upward movement in Wave V.
Support and Resistance Levels:
The horizontal lines around 2,800 and 2,575.3 indicate critical Fibonacci retracement levels (38.20% and 50%).
If the price approaches these levels during the correction, they could serve as support, making it a potential buying opportunity.
RSI Indicator:
From the bottom indicator (RSI), we can see fluctuations in momentum, which can aid in timing trades.
Look for interpretations of the RSI: if it trends towards the extremes (overbought/oversold), that could signal reversal points.
Future Projections:
Should the market respect the outlined support levels, Wave V could potentially push towards a new high above 4,000 as indicated by the upward projection.
Market Sentiment:
Overall, the pattern suggests a bullish outlook long-term, but caution is warranted during corrective phases as prices might retrace towards support levels.

Whats the Play for the week? Are we bullish?Looking for more bullish activity to continue. Just need to see price confirm if it is indeed ready to proceed. if we can find a solid entry we will rock with it. but not trying to force anything.

Gold May Find Support From These Various FactorsGold May Find Support Amid Concerns Over U.S. Debt Sustainability, Economic Weakness, and Renewed Geopolitical Tensions
Gold prices are holding steady today, near $1,353 per ounce in spot trading, in what is expected to be a low-liquidity session due to the early closure of U.S. markets. This follows three consecutive days of gains.
The yellow metal’s subdued movement comes as markets await key labor market data that may offer further insight into the health of the U.S. economy, especially after the recent shock from ADP figures.
Gold continues to find support from several underlying factors that could sustain its upward trend this week. These include rising uncertainty around the long-term sustainability of U.S. public finances and the risk of renewed conflict in the Middle East.
Concerns over U.S. fiscal stability have intensified following the introduction of the “One Big Beautiful Bill Act,” which combines tax cuts with spending reductions. In an opinion article for The New York Times , former Treasury Secretaries Robert Rubin and Lawrence Summers warn of the bill’s potentially severe consequences, including persistently high interest rates, reduced business confidence, falling investment, and the risk of a financial shock that markets may struggle to absorb. This could also leave the economy more vulnerable to economic and geopolitical threats.
Such risks may erode investor confidence in U.S. government debt, potentially boosting gold’s appeal as a safe-haven asset even in an environment of elevated bond yields and prolonged high interest rates.
On the geopolitical front, the specter of renewed escalation in the Middle East looms, and this time, the consequences could be more severe. Amid conflicting reports and statements regarding the extent of the damage to Iran’s nuclear facilities, both sides appear to be preparing for the possibility of renewed hostilities.
Diplomatic efforts remain stalled, and hardline voices continue to call for a return to conflict. In an opinion piece for The New York Times, former National Security Advisor John Bolton described negotiations with Iran as ineffective and dangerous, calling instead for regime change and the use of force.
While previous rounds of conflict have not caused lasting damage to the global economy or energy supply chains, a new round may prove more disruptive. According to Reuters , Iran has reportedly loaded naval mines onto vessels, raising fears that it may attempt to close the Strait of Hormuz.
Such a move would cross a critical threshold and turning a contained conflict into one with global economic implications. The Strait of Hormuz handles over one-fifth of the world’s crude oil and liquefied natural gas exports.
However, Iran may avoid this step as long as its own oil exports continue flowing through the strait, as was the case during the last conflict in June.
On the trade front, there is growing optimism about the potential for new agreements that could ease tensions that have disrupted global supply chains and threatened U.S. and global economic growth. This optimism follows President Trump’s announcement of a trade deal with Vietnam.
There is also hope that progress can be made with China. Recent reciprocal steps, that involve the easing of restrictions on rare earth exports by China and some relaxation of U.S. technology export controls, suggest that the de-escalation agreed upon earlier in Switzerland could hold, potentially laying the groundwork for a broader trade agreement.
Samer Hasn

Gold Builds Bullish Momentum After $3,294.0 ReboundGold bounced from $3,294.0, forming a double bottom pattern as XAU/USD consolidates near $3,330.0. Stochastic has exited oversold territory, signaling strengthening bullish momentum.
If $3,294.0 holds as support, the uptrend may continue toward the $3,393.0 target.
$MGC / $GC / Gold - Target acquired! Where are we going next.Hello fellow gamblers,
Price did not go all the way inside the target range, but it is close enough for me to be satisfied with the play and take profits. Now it is the time to be looking for where we are going next.
- I am already seeing some reversal signals in the 15min TF but no signals in the higher TFs.
- For now, we will continue going lower as long as the blue trendline is not broken, but it is possible for price to have a bounce before continuing lower. If price breaks above 3357, I am looking at that FVG gap as a possible target for the bounce.
- It is possible for price to touch that yellow trendline in the bounce, so I'll be paying attention to it.
- If we get a rejection of 3357, I can see price filling our W2 Target range and finding support at 3283. A break of that level could take us all the way down to 3222.8 - 3174.4 range shown in the chart.
- For bullish scenario, I'd want a break above 3418, but i do believe that it is still early to talk bullish scenarios, so I'll leave it for next time.
- Levels to watch: 3418 - 3357 - 3283 - 3207
