Copper Futures (HG1!), H4 Potential for Bullish RiseTitle: Copper Futures (HG1!), H4 Potential for Bullish Rise
Type: Bullish Rise
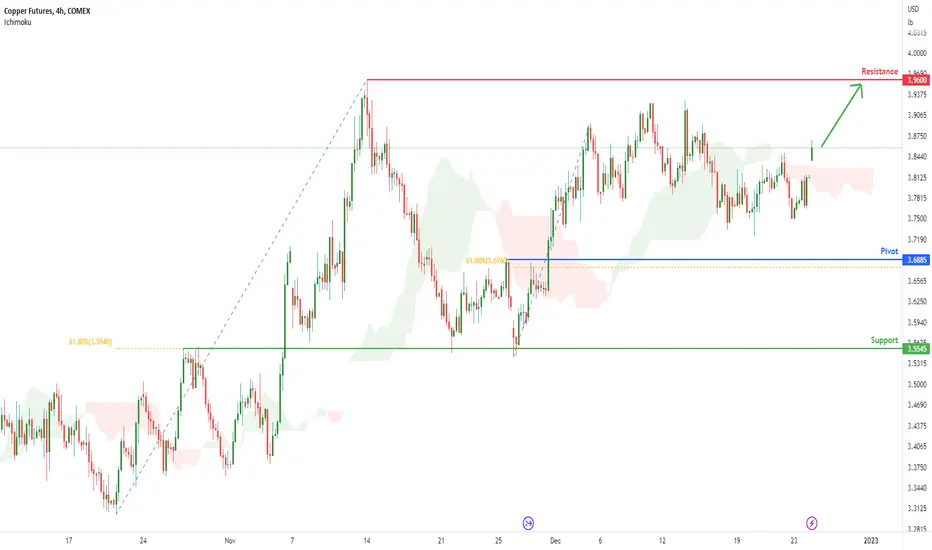
Resistance: 3.9600
Pivot: 3.6885
Support: 3.5545
Preferred case: Looking at the H4 chart, my overall bias for HG1! is bullish due to the current price being above the Ichimoku cloud, indicating a bullish market. If this bullish momentum continues, expect price to possibly head towards the resistance at 3.9600, where the previous swing high is.
Alternative scenario: Price may head back down towards the pivot at 3.6885 where the 61.8% Fibonacci line is.
Fundamentals: There are no major news.
HG1! trade ideas
Copper Futures (HG1!), H4 Potential for Bearish DropTitle: Copper Futures (HG1!), H4 Potential for Bearish Drop
Type: Bearish Drop
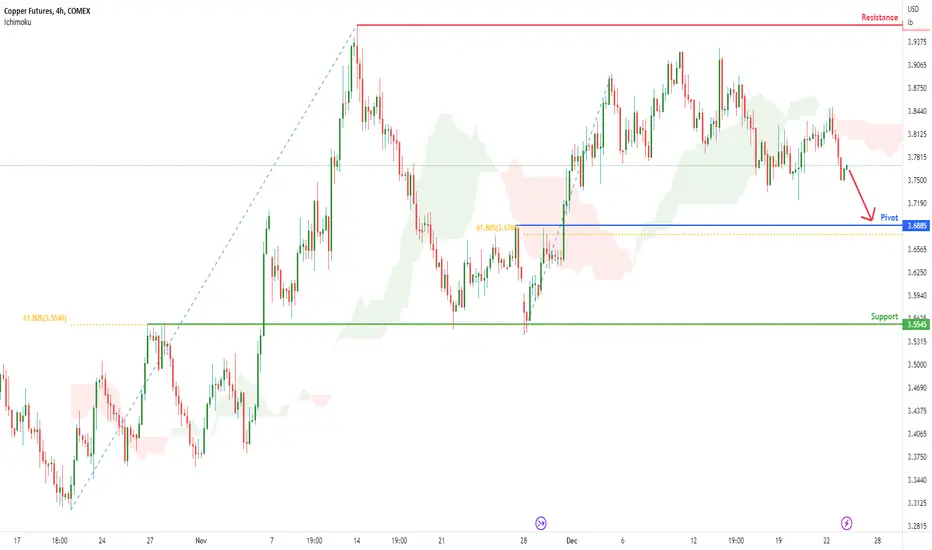
Resistance: 3.9600
Pivot: 3.6885
Support: 3.5545
Preferred case: Looking at the H4 chart, my overall bias for HG1! is bearish due to the current price crossing above the Ichimoku cloud , indicating a bearish market. If this bearish momentum continues, expect price to possibly head back down towards the pivot at 3.6885 where the 61.8% Fibonacci line is.
Alternative scenario: Price may head towards the resistance at 3.9600, where the previous swing high is.
Fundamentals: There are no major news.

Copper Futures (HG1!), H4 Potential for Bearish DropTitle: Copper Futures (HG1!), H4 Potential for Bearish Drop
Type: Bearish Drop
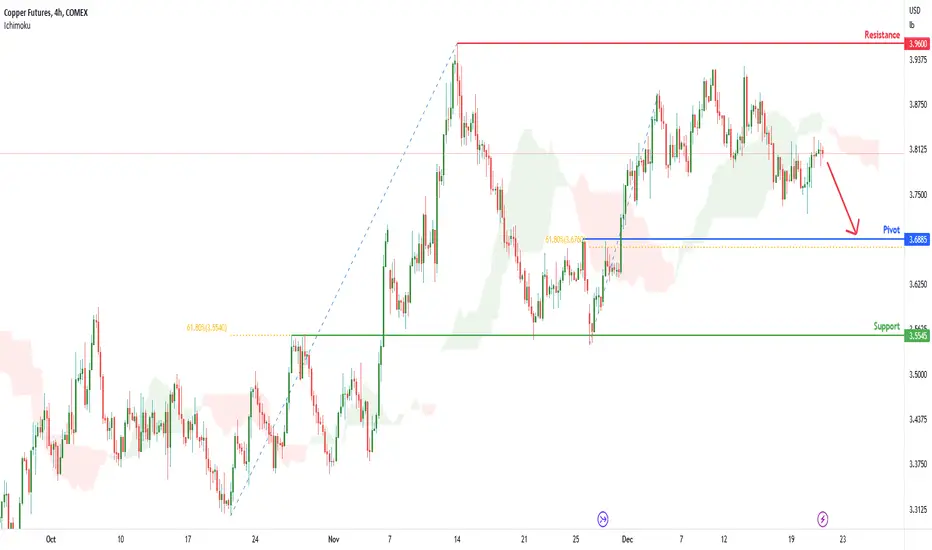
Resistance: 3.9600
Pivot: 3.6885
Support: 3.5545
Preferred case: Looking at the H4 chart, my overall bias for HG1! is bearish due to the current price crossing above the Ichimoku cloud , indicating a bearish market. If this bearish momentum continues, expect price to possibly head back down towards the pivot at 3.6885 where the 61.8% Fibonacci line is.
Alternative scenario: Price may head towards the resistance at 3.9600, where the previous swing high is.
Fundamentals: There are no major news.
Copper Futures (HG1!), H4 Potential for Bearish DropTitle: Copper Futures (HG1!), H4 Potential for Bearish Drop
Type: Bearish Drop
Resistance: 3.9600
Pivot: 3.6885
Support: 3.5545
Preferred case: Looking at the H4 chart, my overall bias for HG1! is bearish due to the current price crossing above the Ichimoku cloud , indicating a bearish market. If this bearish momentum continues, expect price to possibly head back down towards the pivot at 3.6885 where the 61.8% Fibonacci line is.
Alternative scenario: Price may head towards the resistance at 3.9600, where the previous swing high is.
Fundamentals: There are no major news.
HG1! IDEA 4HOURS TIME FRAME Hello guys this is my trading idea about HG1! .
We have head and shoulder pattern + we get rejected from the resistance at this time we just looking for short trade
Thank you .
Likes and Follow for more ideas Thank you .

Short copper futures ( Mar 2023 )Short at price 3.8430; 3.8635 and 3.8890
Stoploss at 3.9410
Take profit at 3.6475

Copper Futures (HG1!), H4 Potential for Bullish ContinuationTitle: Copper Futures (HG1!), H4 Potential for Bullish Continuation
Type: Bullish Continuation
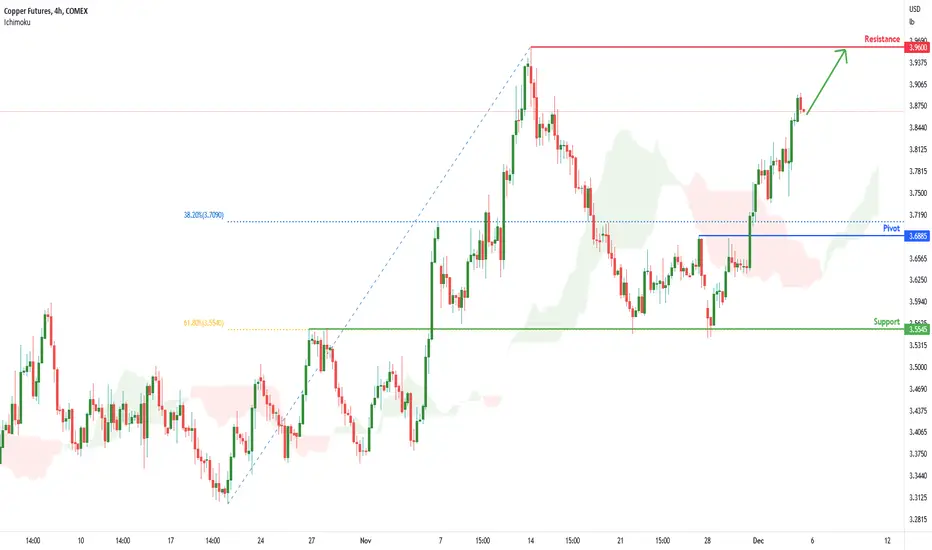
Resistance: 3.9600
Pivot: 3.6885
Support: 3.5545
Preferred case: Looking at the H4 chart, my overall bias for HG1! is bullish due to the current price being above the Ichimoku cloud , indicating a bullish market. If this bullish momentum continues, expect price to possibly continue heading towards the resistance at 3.9600, where the previous swing high is.
Alternative scenario: Price may head back down towards the pivot at 3.6885 where the 61.8% Fibonacci line is.
Fundamentals: There are no major news.

Copper Futures (HG1!), H4 Potential for Bullish ContinuationTitle: Copper Futures (HG1!), H4 Potential for Bullish Continuation
Type: Bullish Continuation
Resistance: 3.9600
Pivot: 3.6885
Support: 3.5545
Preferred case: Looking at the H4 chart, my overall bias for HG1! is bullish due to the current price being above the Ichimoku cloud , indicating a bullish market. If this bullish momentum continues, expect price to possibly continue heading towards the resistance at 3.9600, where the previous swing high is.
Alternative scenario: Price may head back down towards the pivot at 3.6885 where the 28.2% Fibonacci lien is.
Fundamentals: There are no major news.
HG1 Copper longLong term target here for copper. Spent a few hours running fibs across the chart to find confluence. Likely suspect here just above $6

Copper Futures (HG1!), H4 Potential for Bullish ContinuationTitle: Copper Futures (HG1!), H4 Potential for Bullish Continuation
Type: Bullish Continuation
Resistance: 3.9600
Pivot: 3.6885
Support: 3.5545
Preferred case: Looking at the H4 chart, my overall bias for HG1! is bullish due to the current price being above the Ichimoku cloud , indicating a bullish market. If this bullish momentum continues, expect price to possibly continue heading towards the resistance at 3.9600, where the previous swing high is.
Alternative scenario: Price may head back down towards the pivot at 3.6885 where the 28.2% Fibonacci lien is.
Fundamentals: There are no major news.

Copper Futures (HG1!), H4 Potential for Bullish ContinuationTitle: Copper Futures (HG1!), H4 Potential for Bullish Continuation
Type: Bullish Continuation
Resistance: 3.9600
Pivot: 3.6885
Support: 3.5545
Preferred case: Looking at the H4 chart, my overall bias for HG1! is bullish due to the current price being above the Ichimoku cloud, indicating a bullish market. If this bullish momentum continues, expect price to possibly continue heading towards the resistance at 3.9600, where the previous swing high is.
Alternative scenario: Price may head back down towards the pivot at 3.6885 where the 28.2% Fibonacci lien is.
Fundamentals: There are no major news.

Short CopperWe are short Copper. Take profit 3.40 and Stop Loss at 3.70 - a 1.9 Risk to reward ratio. There is a 50% profitability rate for this trade, however considering the prior signal for copper was profitable, the odds of 2 short signals producing a profit in a row is 25%. This trading signal also aligns with our seasonal sentiment of copper over the coming weeks.

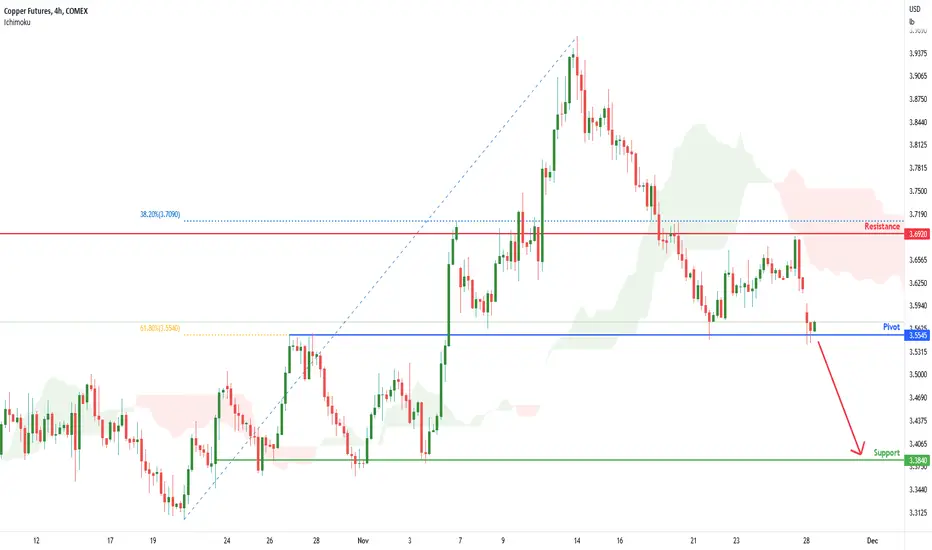
Copper Futures (HG1!), H4 Potential for Bearish DropTitle: Copper Futures (HG1!), H4 Potential for Bearish Drop
Type: Bearish Drop
Resistance: 3.6920
Pivot: 3.5545
Support: 3.3840
Preferred case: On the H4 chart, we have a bearish bias. To add confluence to this, price is under the Ichimoku cloud which indicates a bearish market. If this bearish momentum continues, expect price to possibly break the Pivot at 3.5545, where the 61.8% Fibonacci line is, before heading towards the support level at 3.3840, where the previous swing low is.
Alternative scenario: Price may go back up towards the resistance line at 3.6920, where the 38.2% Fibonacci line is.
Fundamentals: There are no major news.
HG1 Daily Gartley - Played outHG1 daily gartley played out perfectly,
Fibonacci cluster also triggered sells... so played out...
A lot of noise around copper supply constraints now, so possibly more basing may happen before trending much higher, but no clear signal to me yet

COPPER looks doomed on the long-term. Sell the rallies.Copper (HG1!) on the 1W time-frame appears to be repeating the previous major Bear Cycle that started in 2011/12. Based on this fractal analysis, the recent 1W rejection just below the 1W MA50 (blue trend-line) puts us at a proportionate level as on the February 06 2012 1W candle. Having rebounded on the 1W MA100 (green trend-line) both on the July 11 and September 26 candles, we expect initially to reach it again and then rebound to make a Lower High and form a trend-line similar to that of 2012 - 2014 that made structured Highs to sell that took Copper to the 2.000 - 1.9360 Support Zone.
This long-term bearish pattern will get invalidated if the price breaks above the 0.618 Fibonacci extension, which was where (slightly below) the price was rejected on the February 06 2012 1W candle.
-------------------------------------------------------------------------------
** Please LIKE 👍, SUBSCRIBE ✅, SHARE 🙌 and COMMENT ✍ if you enjoy this idea! Also share your ideas and charts in the comments section below! This is best way to keep it relevant, support me, keep the content here free and allow the idea to reach as many people as possible. **
-------------------------------------------------------------------------------
You may also TELL ME 🙋♀️🙋♂️ in the comments section which symbol you want me to analyze next and on which time-frame. The one with the most posts will be published tomorrow! 👏🎁
-------------------------------------------------------------------------------
👇 👇 👇 👇 👇 👇
💸💸💸💸💸💸
👇 👇 👇 👇 👇 👇

Copper Futures patternCopper futures HG2 chart on the daily time frame (no wicks).
Appears to be forming an adam and eve pattern. looking for it to break upwards soon. Dollar dropping helps.
None of this should be interpreted as financial advice, I am not a professional or certified financial adviser! all charts, and or analysis' are my personal opinions and observations only!

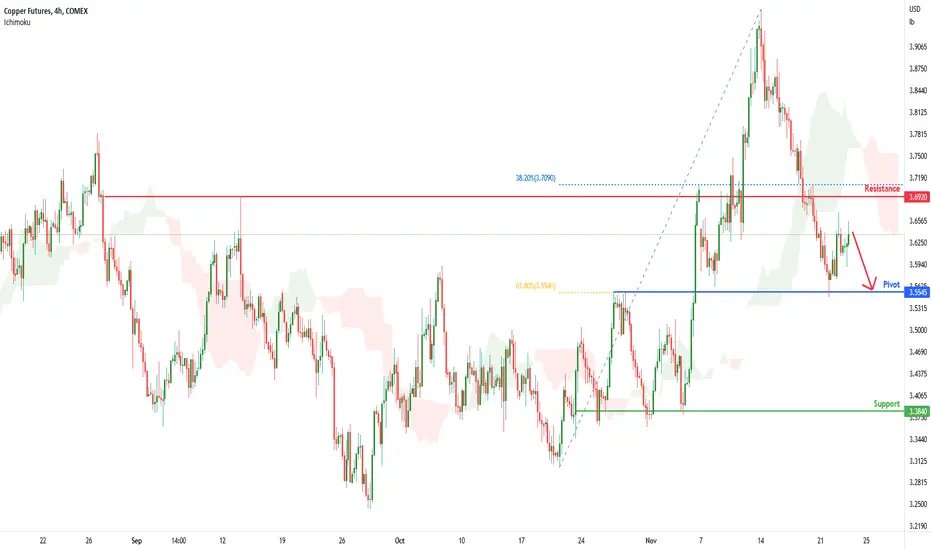
Copper Futures (HG1!), H4 Potential for Bearish DropTitle: Copper Futures (HG1!), H4 Potential for Bearish Drop
Type: Bearish Drop
Resistance: 3.6920
Pivot: 3.5545
Support: 3.3840
Preferred case: On the H4 chart, we have a bearish bias. To add confluence to this, price is under the Ichimoku cloud which indicates a bearish market. If this bearish momentum continues, expect price to possibly head towards the Pivot at 3.5545, where the 61.8% Fibonacci line is.
Alternative scenario: Price may go back up towards the resistance line at 3.6920, where the 38.2% Fibonacci line is.
Fundamentals: There are no major news.
Copper down 5 days in a row; 3.5545 is keyThe industrial metal topped on March 7th at 5.0395. However, for the next 3 months, HG sold off aggressively and made a July 15th low at 3.1315! Fears of increased inflation, increased interest rates, and increased Covid cases in China led to a fear of lack of future demand. Copper traded between 3.2430 and 3.7830 from mid-July and November 10th, when it gapped higher the day after a lower-than-expected US CPI reading. However, Copper was stopped just short of the 200-Day Moving Average near 3.9600 on November 14th, and it hasn’t looked back since. After a 5-day selloff, is copper ready to bounce?
News of additional lockdowns and the “take-back” of a loosening of restrictions caused Copper to continue lower. Copper traded to horizontal support on Monday near 3.5545. If this price breaks, copper may easily fall to 3.3625. The next horizontal support levels are at the lows from September 28th at 3.2430, then the lows from July 15th at 3.1315.
However, don’t be surprised if there is some profit-taking ahead of the long US holiday at the end of the week. Sellers will be looking to add to shorts if price does bounce. The first resistance level is at the August 26th highs of 3.893, then a confluence of resistance at:
1. the highs of November 14th
2. the 200 Day Moving Average,
3. the 61.8% Fibonacci retracement level from the highs of June 3rd to the lows of July15th.
This resistance zone is between 3.9600 and 4.0250.
However, 3.5545 seems to be the “make or break” level for copper. If it breaks, copper could be on its way to the next support at 3.3625. But if it holds, it could bounce to the 4.000 area!

Copper (COPPER/INR) Commodity Analysis 18/07/2021 Technical Analysis:
As you can see, there exist a hidden Bullish Divergence with MACD which is the sign of bullish trend continuation as Copper has started its bullish wave since March 2020. It is moving in an ascending channel. We draw Fibonacci retracement from the low to the top of last impulsive wave which are defined as the Fib levels on chart. The commodity fell to 78% Fibonacci Retracement and it is consolidating and accumulating on Fibonacci Golden Zone currently. we believe this commodity is getting ready to shoot to the higher targets which are defined by Fibonacci Projection tool of the past wave.
