Dr Copper is telling us deflation is comingAt the beginning of June I put out an idea about shorting Copper . The market didn't do me the favor to get up to my entry, as I ignored past resistance. Probably got a little greedy too. Currently copper is sitting at support and could bounce up to 4$, maybe even up to 4.25$.
However in the long term, I see it go much much lower. In my opinion we are in a global recession, and probably even in a global depression. As interest rates and energy costs have risen rapidly, the demand for many things has gone down. We haven't seen the full effects of too much debt + lockdowns + WW3 + not enough energy production yet, but we are getting there. Copper going down is just the first step, and this could turn really really ugly.
The 2006-2008 top on Copper looks pretty similar to this one. Huge rally up, consolidation, attempt to breakout, failure, massive collapse. This time around we had a shorter cycle due to the lockdowns + stimulus + low rates + ESG , but this situation is truly reversing. We have no lockdowns, no stimulus, high rates and the ESG movement is clearly losing steam. Overall volume is low and that's a sign that demand for Copper isn't all that high. It was mostly supply being low, and not demand being high.
So how low could we go? The truth is that for some time this could be a bottomless pit. However, I believe the bottom will come in the 1.5-1.9 area, as the market needs to sweep the double bottom at 1.9. In terms of technical analysis this is the area anyone should be targeting. Once we get there, we could see a swift reversal as the Fed and all central banks are forced to cut rates and print money once again, in order to save the system from collapsing. They are stuck between a rock and hard place, and although they are doing their best to fight inflation now, they will soon be trying to fight deflation.
HG1! trade ideas

LONG ON COPPER - Will This Chart Save us From Recession Worries?It probably won't but a relief rally could be in play.
Watch Our Bronze Age Bitcoin Video today:
The Bronze Age followed the Stone Age and began around 4000 years ago. The Iron Age followed the Bronze Age and began around 3000 years ago. That's some time ago, yes.
Could Bitcoin play a role as the beginning of a 'new age'? Sure.. it's a trustless system in a stupid planet with no trust between it's 'nations'.
Funnily enough, I come from the island of Cyprus. 🏖️🌴🐬
Cyprus was famous in antiquity for its copper resources. In fact the very word copper is derived from the Greek name for the island, Kupros.
Watch this if you like history: www.youtube.com
Copper Price as an indication of what happens next:
The price of copper is largely influenced by the health of the global economy. This is due to its widespread applications in all sectors of the economy, such as power generation and transmission, construction, factory equipment and electronics. Sometimes referred to as Doctor Copper , the base metal is seen as a reliable leading indicator. A rising market price suggests strong economic health, while a decline suggests the opposite.
So we keep having many Copper related articles lately: Copper has entered a bear market , which may indicate a stronger chance that recession is coming.
OUR ANALYSIS:
We had shared with YOU, HERE a perfect short on Copper last summer:
COPPER- Poised for a Correction
At this stage we see Copper on MAJOR SUPPORT and this is only Good news:
snapshot
Hope it all makes some sense.
If you Like the idea, we Like to see you Liking our post.
One Love,
the FXPROFESSOR

HG1!6.28.22 hg1! On this video I am showing you how to set up copper for a possible long trade. The market had to move a little bit higher before I could go along, assuming that I didn't get in at the beginning of the reversal higher. I believe many Traders work hard, but they're not working smart. This concept was absolutely not developed by me, it's something that I learned. And in my own transitions, it became apparent to me when I was working hard but not smart. That will burn you out and use up a lot of time. What are the best things you can do if you want to avoid your fear of trading is 2 choose markets That are not ready to be traded, and therefore you won't be pressured to make a trade decision. In other words, it's a safe market because you're not going to make a trade decision. I opened the video, cleaned up my chart, and then went to a time frame where I could judge a market, and what was needed to make a trade decision... In the near future.

Copper Responding to SupportThere is a lot to like from a technical perspective regarding copper. Price carved a doji on Friday and price has reacted to a level defined by VWAP from the March 2020 low and former resistance (January 2021 high). Also, the decline from March consists of 2 equal legs. I'm thinking higher as long as last week's low holds. The May low at 4.0370 is a soft target.
-Jamie

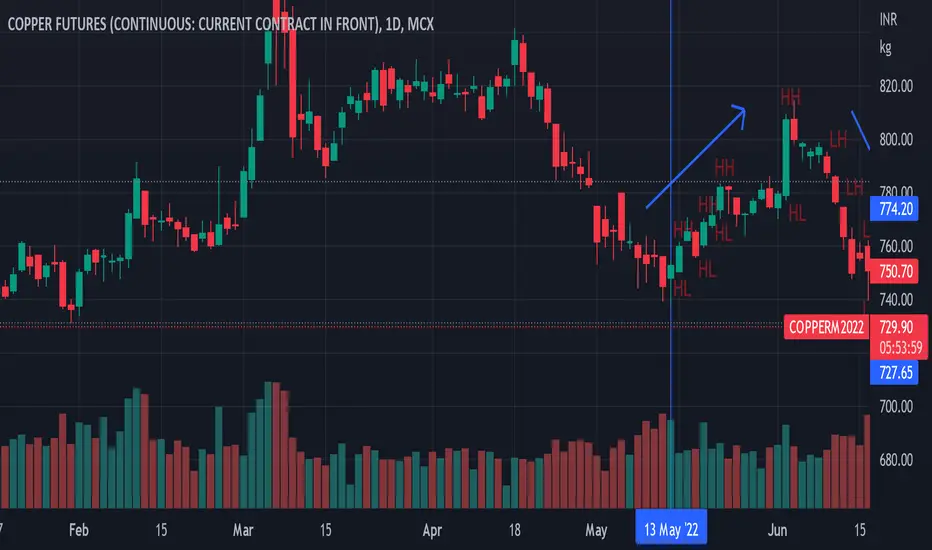
Copper CMP 709, looks like going towards 750 tgtCopper CMP 709, looks like going towards 750 tgt
copper looks like completing a 5 wave down move and should give a good retracement till wave 4 of smaller degree


Copper looks weak! Copper’s ability to predict turning points in economic cycles and gauge the overall health of the global economy is so strong that the base metal has earned the nickname “Dr. Copper” among insiders in the commodities markets.
Falling copper prices are often viewed as a leading indicator of an impending economic downturn owing to the metals’ wide variety of use cases in electrical, industrial, and transportation applications. And over the past few months, “Dr. Copper” has been sounding the alarm loud and clear.
Copper futures on the benchmark London Metal Exchange have fallen from highs of $10,730 per tonne in March to just $8,575 as of Thursday’s close, a more than 20% drop, which officially puts the metal into a bear market.
Using Nasdaq’s measure of copper prices, the metal has fallen over 17% in just two weeks and is now trading at just $3.74 per pound, after hitting a high in March of over $4.94.

Copper gold price ratioCopper gold price ratio, breaking down, good indicator of slowdown and potential headwinds

COPPER FUTURES (SELL)RSI divergence + break of a triple top + pull-back and we fall for a few days or a few weeks.
The targets are on the chart.

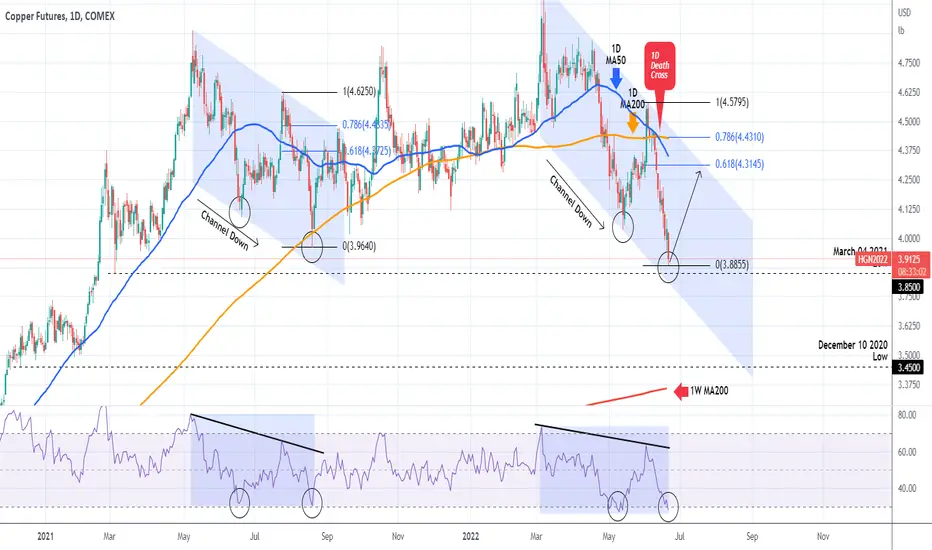
COPPER High probability for a reboundCOPPER (HG1!) has been trading within a Channel Down ever since the March 07 High caused of the Russia - Ukraine war escalation. Right now the price isn't just approaching the Channel's Lower Lows trend-line (bottom) but also the March 04 2021 Low of 3.8500. With the RSI dropping below the oversold 30.00 barrier on the 1D time-frame and making a Double Bottom. the market may soon reverse towards the Channel's top again.
The last time we saw all these parameters aligned in the same order was during the May - August 2021 Channel Down, where the price after the RSI Double Bottom on the 30.00 mark, it rebounded above the 0.618 Fibonacci to the top (Lower Highs trend-line) of the Channel.
Our strategy is to initially settle for a short-term target just below the 0.618 Fib extension at 4.3000 and then re-evaluate as a break above the 1D MA200 (orange trend-line) is most likely needed in order to reverse the trend completely.
If on the other hand 3.8100 breaks, we expect a sharp sell-off towards the 3.4500 Low of December 10 2020, where the price can also make contact with the 1W MA200 (red trend-line).
--------------------------------------------------------------------------------------------------------
Please like, subscribe and share your ideas and charts with the community!
--------------------------------------------------------------------------------------------------------
Copper Futures in Bearish TrendCopper futures are continuing it's bearish trend. It has broken the LL of 16th May and 31st Jan as well.
Copper Futures setting up for a potential long tradeCopper / HG Futures market may be setting up for a move back to the upside.
After a huge expanding bullish candle in the beginning of June that saw price blast through the volume Point of Control (POC) which goes back to October last year the price then immediately reversed and we have seen a sell off for the majority of this month. However yesterday we saw a spinning top candle form at a critical point which had been a support level, this has also painted bullish divergence on the RSI indicator.
Further to the above technical analysis we have also seen net buying activity from commercial operators which indicates a slight under supply : demand imbalance. On many occasions large commercial buying can lead to a price hike as supply squeeze takes hold. Lastly commodity seasonal reports also show that copper does have a tendency to sell off in the beginning of June but then turns around at the end June and price upwards again through until end of July before dipping again coming into August.
I would like to see price close above yesterdays close and hold above ~$4.05 which is roughly a support zone. Ideal entries could be above yesterdays high with price targets at ~$4.25 and / or ~$4.40, which are both just below previous support and resistance levels and large volume clusters. However if price cannot break above and hold $4.05 and instead falls and closes under $4.00 then I would not be looking at any long trades.

Copper ShortCopper is in decline.
The 50 MAV has provided dynamic trendline resistance.
Price has rallied from the recent swing low to now be at Fibonacci 61.8 level . A short in line with the present intraday trend is suggested
1. Enter - 748
2. Stop - 753 ( Above 100 MAV and Kumo )
3. Target - 718 ( .618 extension)
RR = 6+

Playing Dr.Copper DownsideIn this update we review the recent price action in the Copper futures contract and identify the next high probability trading patterns and price objectives to target

Copper HG In Super CycleCopper just confirmed a super cycle and to say this is the top price it will reach is a huge mistake. This super cycle could last for a long time. Short beware.

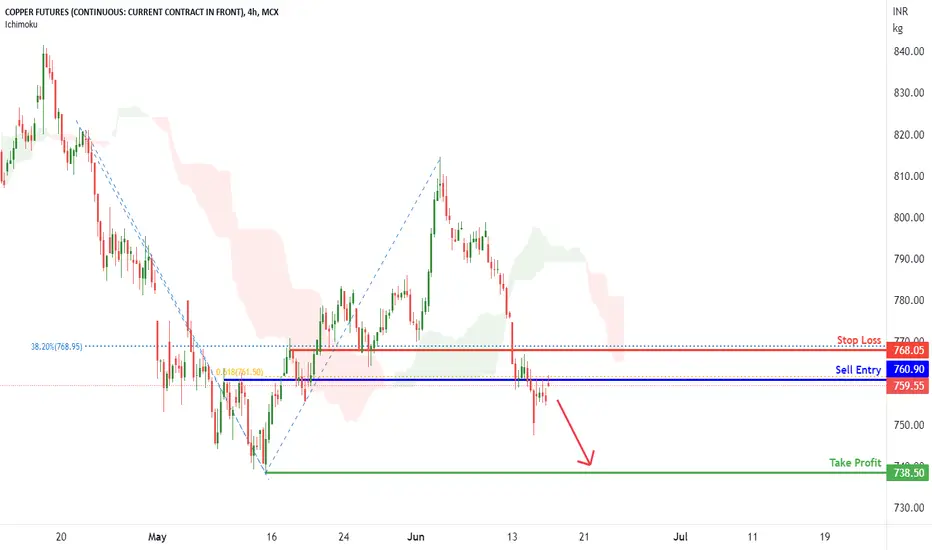
Potential Bearish ContinuationOn the H4, with price moving below the ichimoku cloud, we have a bearish bias that price will drop from the pivot at 760.90 in line with the overlap resistance and 61.8% fibonacci projection to the 1st support at 738.5 in line with the horizontal swing low. Alternatively, price may rise from the pivot to the overlap resistance at 768.05 in line with the 38.2% fibonacci retracement.
Any opinions, news, research, analyses, prices, other information, or links to third-party sites contained on this website are provided on an "as-is" basis, as general market commentary, and do not constitute investment advice. The market commentary has not been prepared in accordance with legal requirements designed to promote the independence of investment research, and it is therefore not subject to any prohibition on dealing ahead of dissemination. Although this commentary is not produced by an independent source, FXCM takes all sufficient steps to eliminate or prevent any conflicts of interest arising out of the production and dissemination of this communication. The employees of FXCM commit to acting in the clients' best interests and represent their views without misleading, deceiving, or otherwise impairing the clients' ability to make informed investment decisions. For more information about the FXCM's internal organizational and administrative arrangements for the prevention of conflicts, please refer to the Firms' Managing Conflicts Policy. Please ensure that you read and understand our Full Disclaimer and Liability provision concerning the foregoing Information, which can be accessed on the website.
Potential for Bullish ContinuationOn the H4, with price moving above the ichimoku cloud, we have a bullish bias that price will rise from the pivot at 783.5 in line with the 61.8% fibonacci projection and pullback support and multiple swing high to the 1st resistance at 813.35 in line with the 100% fibonacci projection and overlap resistance. Alternatively, price may break the support structure at the pivot and drop to the 1st support at 770.55 at the swing low.
Any opinions, news, research, analyses, prices, other information, or links to third-party sites contained on this website are provided on an "as-is" basis, as general market commentary, and do not constitute investment advice. The market commentary has not been prepared in accordance with legal requirements designed to promote the independence of investment research, and it is therefore not subject to any prohibition on dealing ahead of dissemination. Although this commentary is not produced by an independent source, FXCM takes all sufficient steps to eliminate or prevent any conflicts of interest arising out of the production and dissemination of this communication. The employees of FXCM commit to acting in the clients' best interests and represent their views without misleading, deceiving, or otherwise impairing the clients' ability to make informed investment decisions. For more information about the FXCM's internal organizational and administrative arrangements for the prevention of conflicts, please refer to the Firms' Managing Conflicts Policy. Please ensure that you read and understand our Full Disclaimer and Liability provision concerning the foregoing Information, which can be accessed on the website.

Copper: Where does it go from here?Since the highs in early March, Copper was stuck in a downtrend with a series of lower highs, but is starting to repair some of the technical damage that was done. The July Copper contract broke out off an inverse head and shoulders pattern on June 2nd but stalled out and reversed off resistance near 4.57, which was previously support and the breakdown point from April 25th (previous support is now resistance). With the recent COT showing a net short position of 13,000 contracts, there could be a potential short squeeze on a breakout above resistance which could open the door for a run back at the top end of the range from March and April, in the neighborhood of 4.80.


changes in the copper chart6.7.22 changes in the copper chart..............................................................................................................

6.7.22 IMPORTANT to recap tradesOIL ES1! Copper " important to over trades at the end of the day........

copper6.7.22 copper trading to target..........................................................................................
