Copper Turning Red HotWhen China sneezes, commodities catch cold. Developments in China over the last quarter around zero COVID have paved the path to re-opening, which has a substantial impact on lives, livelihoods, and commodity prices.
China re-opening plus a raft of measures to spur the Chinese real estate sector sets the backdrop for copper prices to be bullish. This case study illustrates that a long position in CME Copper Futures with an entry at 3.95 and a target of 4.326 supported by a stop loss at 3.614 would yield a reward to risk ratio of 1.2.
On 14th November, we published – Copper Melting? , in which we were short term bearish while staying long term bullish on Copper. Our call then turned out correct with prices tanking in November but given the large-scale policy shifts in China now, we believe prices are well supported and set to rise.
RECOVERY FROM COVID LOCKDOWNS
Bounce-back from Covid lockdowns is visibly observed in various China-centric asset classes and currency. The chart below shows that since last September, Iron Ore has spiked 19% & Copper is up 12% buoyed by real estate recovery.
COVID-19 STILL LINGERS THREE YEARS ON
It is 2023, but COVID-19 still lingers. Covid lockdown hurts. Weak growth and stunted consumer confidence is evident from the chart below. Consumer confidence is at its lowest in 10 years. Based on data compiled by Bloomberg, rebound in subway traffic in key cities suggests that infections might have peaked. While the situation is still challenging for many, conditions in China might have passed peak Covid, suggesting shift in sentiments for the better.
MEASURES TO HELP CHINESE REAL ESTATE SECTOR
In addressing sagging consumer confidence and struggling real estate market, Beijing has embarked on pro-growth policy stance with accelerated reopening plans, plus a range of support measures for the real estate sector.
The measures to boost property market include (1) easing of lending restrictions, (2) lowering of mortgage rates, (3) capping real estate brokerage commissions, (4) dialing back on “three red-lines” lending policy for banks, (5) reducing down payment ratios for first time buyers, (6) removing minimum lending rates for first time purchases, (7) resuming approvals for private equity funds to raise money to invest in residential real estate, and, (8) strengthening of “too-big-to-fail” property developers.
Phased rollout of these measures is starting to have a positive impact. Since lows touched in November, Bloomberg Intelligence (BI) China Real Estate Developers Index is up 62%.
IRON ORE AND COPPER ARE AMONG THE FIRST TO BENEFIT FROM SUPPORT MEASURES
A booming real estate sector directly benefits Iron Ore and Copper. Sea-borne Iron Ore - majority of which is imported into China has been buoyant and is anticipated to rebound to $130/ton this quarter according to Citi. Over the past month, iron ore prices have also moved up with reopening hopes boosting sentiment.
Bloomberg reported late last week that China plans to tighten the supervision on iron ore pricing to curtail speculations, the National Development and Reform Commission said in a statement on its WeChat page.
The Bullish sentiment in the real estate sector is showing up in buoyant copper prices. Unfettered by regulatory actions on price rise, copper has stayed more resilient than iron ore highlighting its relative strength.
SPECIFIC EQUITY MARKET SECTOR INDICES INDICATING MARKET BOUYANCY
Shares of mainland Chinese property developers shot up last week on talks that the authorities plan to extend supportive measures for “good-quality developers”.
The chart above shows a bullish cup and handle formation on the Shanghai Stock Exchange (SSE) Real Estate Index that points to an imminent recovery in the sector. SSE Real Estate Index spiked 21% since November 1st while the SSE Transportation Index (chart below) has climbed just 3.6% during the same period.
SIGNS OF BULLISHNESS IN COPPER TECHNICAL SIGNALS
Copper’s short-term moving average is approaching the long-term moving average. A cross could point to the start of a rally.
Copper’s Bollinger bands have started to narrow pointing to a narrowing range which suggests that a breakout from the range.
Copper prices cooled off in November before recovering, this price action also displays a bullish cup and handle formation as prices have remained range-bound post-recovery. Prices hovering at these levels despite softer volumes suggests that prices have found support.
INSIGHTS IMPLIED FROM OPEN INTEREST AND OPTIONS MARKETS POINTS TO EARLY SIGNS OF BULLISHNESS
Based on the Commitment of Traders Report, over the past 12 weeks, funds, institutional investors, and managed money have reduced their net short positions in copper futures by a striking 71%. Meanwhile, during the same period, small speculators while individually small but collectively non-trivial have shifted from net short positions of -1,004 lots to net long of +4,838 lots.
The put-call ratio on CME Copper Options is 0.57, a sign that participants are bullish on the prospects of copper price.
TRADE SET-UP
Each long position in micro copper futures (February 2023) provides exposure to 2,500 pounds of copper.
Entry: 3.950
Target: 4.326
Stop Loss: 3.614
Reward/Risk Ratio: 1.20
Profit at Target: $940
Loss at Stop Loss: $840
MARKET DATA
CME Real-time Market Data helps identify trading set-ups and express market views better. If you have futures in your trading portfolio, you can check out on CME Group data plans available that suit your trading needs www.tradingview.com
DISCLAIMER
Trade ideas cited above are for illustration only, as an integral part of a case study to demonstrate the fundamental concepts in risk management under the market scenarios being discussed. They shall not be construed as investment recommendations or advice. Nor are they used to promote any specific products, or services.
This material has been published for general education and circulation only. It does not offer or solicit to buy or sell and does not address specific investment or risk management objectives, financial situation, or particular needs of any person.
Advice should be sought from a financial advisor regarding the suitability of any investment or risk management product before investing or adopting any investment or hedging strategies. Past performance is not indicative of future performance.
All examples used in this workshop are hypothetical and are used for explanation purposes only. Contents in this material is not investment advice and/or may or may not be the results of actual market experience.
Mint Finance does not endorse or shall not be liable for the content of information provided by third parties. Use of and/or reliance on such information is entirely at the reader’s own risk.
These materials are not intended for distribution to, or for use by or to be acted on by any person or entity located in any jurisdiction where such distribution, use or action would be contrary to applicable laws or regulations or would subject Mint Finance to any registration or licensing requirement.
MHG1! trade ideas

Is Copper Melting?The red metal is widely regarded as a barometer of global economic health.
Despite thin investments in production in recent years, copper prices have been bullish since June this year. Anticipation of China re-opening from Covid linked restrictions and less than expected inflation prints in the US have fueled a near 15% rally in copper prices over the last two weeks.
Notwithstanding the recent bullishness in prices, this case study provides a brief macroeconomic backdrop making a case for short term headwinds even as the long-term bullishness for copper remains solid.
Real Estate in China
Against a backdrop of wider ESG recognition, de-carbonisation & EV adoption, and couple that with low investments in copper production, all this points to copper’s bullish outlook over the long term.
However, massive macro headwinds, chiefly from the troubled real estate sector in China and rising interest rates are likely to slam brakes on copper price rise in the short term. China consumes more than half of global copper production. Within China, real estate represents a lion’s share of copper usage.
Rising default rates in real estate loans, deleveraging among construction firms, and declining/slowing growth in real estate lead to anemic demand. Soft demand for copper from China is likely to send prices downwards in the near term.
Strong Dollar despite recent price retracements hurts commodity consumers
A majority of the global equity markets have plunged massively with change in the interest rate regime. Projects that used to make sense when the cost of financing was zero, now do not make commercial sense. Companies are facing shrinking profits and the outlook appears bleak for many firms across various industries with few exceptions. A resilient and strong dollar doesn’t help much either.
Commodities that are traded in USD fuels inflation in non-dollar-based economies. Firms that are already fighting slow growth are saddled with the burden of rising costs as US exports its inflation via a strong dollar. Even though USD may weaken somewhat in the coming weeks, the year-to-date gains in the USD makes it challenging for non-US firms which will likely drag copper prices down.
Geopolitical Conflicts
The lingering geo-political conflicts and the uncertainty that comes with it have put firms on their back foot. Businesses and consumers alike are posturing defensively instead of betting on growth.
Deleveraging
Markets in general are in a deleveraging mode. This is being observed across equities, bonds, housing, company balance sheets, credit market, and crypto among others. The US Fed is determined to tame inflation lower through higher rates for longer. This is likely to create an onset of recession starting with rising unemployment rate. As that sets in, we could see a decline in consumer demand which will subsequently affect commodity prices negatively.
Technical Signals
Copper prices rallied last week heading into a resistance band has not been breached since June. After a positive CPI print, prices moved above this band on positive sentiment. The RSI points to overbought as it hit 69.19 while BBW hit a 3-month high indicating a potential reversal in the uptrend. The 200-day moving average is currently at 3.9905 which could offer a resistance level in the current larger downtrend. Although the March contract saw elevated volume on the move last week, the current contract volume was consistent with normal trading activity.
Current implied volatility for March expiry ATM Copper options is 32.71% or 2.06% daily, it has been at this level for the past month. Realized 20-day volatility has been closer to 41.16% or 2.59% and stands elevated over the past 2 weeks from the low 20’s. This means that at current implied volatility levels daily, a 1-standard deviation move at the 200-day moving average could take us to 4.07.
$3.4465 is the Point of Control for the Visible Range Volume Profile since April and could offer a potential level for taking profit. Another potential level could be 3.2945 from where price has bounced over the past 3 months.
Trade Setup
Copper Futures on CME provide exposure to 25,000 pounds of copper. Copper futures expiring in March 2023 have a maintenance margin of $5,750.
Establishing a short position with an entry price of at $3.873 with a potential target at $3.4465 would result in $10,663 in profits or a return on capital of 185.4%. However, if the stop loss at $4.07 is triggered, it would lead to a loss of $4,925 or -85.65% of capital employed. Tier 2 target at 3.2945 would lead to a profit of $14,463 or 251.5% in return on capital.
Micro Copper Futures on CME, at 1/10th the size of standard copper futures, provide a more flexible, cost-effective way to express market views. Similarly, E-Mini Copper Futures on CME offer exposure to 1/2 of a standard futures contract.
CME Real-time Market Data help identify trading set-ups and express market views better. If you have futures in your trading portfolio, you can check out on CME Group data plans available that suit your trading needs www.tradingview.com
DISCLAIMER
Trade ideas cited above are for illustration only, as an integral part of a case study to demonstrate the fundamental concepts in risk management under the market scenarios being discussed. They shall not be construed as investment recommendations or advice. Nor are they used to promote any specific products, or services.
This material has been published for general education and circulation only. It does not offer or solicit to buy or sell and does not address specific investment or risk management objectives, financial situation or particular needs of any person.
Advice should be sought from a financial advisor regarding the suitability of any investment or risk management product before investing or adopting any investment or hedging strategies. Past performance is not indicative of the future performance.
All examples used in this workshop are hypothetical and are used for explanation purposes only. Contents in this material is not investment advice and/or may or may not be the results of actual market experience.
Mint Finance does not endorse or shall not be liable for the content of information provided by third parties. Use of and/or reliance on such information is entirely at the reader’s own risk.
These materials are not intended for distribution to, or for use by or to be acted on by any person or entity located in any jurisdiction where such distribution, use or action would be contrary to applicable laws or regulations or would subject Mint Finance to any registration or licensing requirement.

Copper to see a breakdown?XCUUSD - Intraday - We look to Sell a break of 4.209 (stop at 4.249)
We are trading at overbought extremes.
Although the bulls are in control, the stalling positive momentum indicates a turnaround is possible.
A break of the recent low at 4.221 should result in a further move lower.
Reverse trend line resistance can be seen at 4.290.
A Doji style candle has been posted from the high.
Our profit targets will be 4.109 and 4.089
Resistance: 4.270 / 4.305 / 4.330
Support: 4.250 / 4.220 / 4.180
Please be advised that the information presented on TradingView is provided to Vantage (‘Vantage Global Limited’, ‘we’) by a third-party provider (‘Signal Centre’). Please be reminded that you are solely responsible for the trading decisions on your account. There is a very high degree of risk involved in trading. Any information and/or content is intended entirely for research, educational and informational purposes only and does not constitute investment or consultation advice or investment strategy. The information is not tailored to the investment needs of any specific person and therefore does not involve a consideration of any of the investment objectives, financial situation or needs of any viewer that may receive it. Kindly also note that past performance is not a reliable indicator of future results. Actual results may differ materially from those anticipated in forward-looking or past performance statements. We assume no liability as to the accuracy or completeness of any of the information and/or content provided herein and the Company cannot be held responsible for any omission, mistake nor for any loss or damage including without limitation to any loss of profit which may arise from reliance on any information supplied by Signal Centre.

Gold Silver Copper ALL BULLISH in 15 minute chartsTHese had good solid retracements into 50% supports, especially Silver, this morning. These charts are pretty bullish. Maybe a bit late in the day to get in but there are makings for continued higher moves and breakouts over the next few days.


Copper futures could drop like a rock to $1.94The retracement in wave (X) (orange) could be over as it reached 61.8% of wave (W).
It unfolds in a triple three WXYXZ (yellow).
Y and Z are greater than W, which is healthy.
The target is the previous valley of Jan 2016 at $1.94.
At this target point the wave (Y) will reach the distance of 1.272 of wave (W), which is Fibonacci ratio.

COPPER - Near the sensitive zoneHi guys
As we see in this chart, we are near the supply in control zone in weekly timeframe. Also we can see weakness in the uptrend behavior and the RSI Divergence is the key signal.
I think the situation for this Index is short At least in H4 timeframe.
Sincerely


Copper's momentum has changed.XCUUSD - Intraday - We look to Sell a break of 4.099 (stop at 4.139)
Our bespoke support of 4.130 has been clearly broken.
Offers ample risk/reward to sell at the market.
We look for losses to be extended today.
Short term bias has turned negative.
Our profit targets will be 3.999 and 3.979
Resistance: 4.130 / 4.160 / 4.185
Support: 4.075 / 4.030 / 3.990
Please be advised that the information presented on TradingView is provided to Vantage (‘Vantage Global Limited’, ‘we’) by a third-party provider (‘Signal Centre’). Please be reminded that you are solely responsible for the trading decisions on your account. There is a very high degree of risk involved in trading. Any information and/or content is intended entirely for research, educational and informational purposes only and does not constitute investment or consultation advice or investment strategy. The information is not tailored to the investment needs of any specific person and therefore does not involve a consideration of any of the investment objectives, financial situation or needs of any viewer that may receive it. Kindly also note that past performance is not a reliable indicator of future results. Actual results may differ materially from those anticipated in forward-looking or past performance statements. We assume no liability as to the accuracy or completeness of any of the information and/or content provided herein and the Company cannot be held responsible for any omission, mistake nor for any loss or damage including without limitation to any loss of profit which may arise from reliance on any information supplied by Signal Centre.

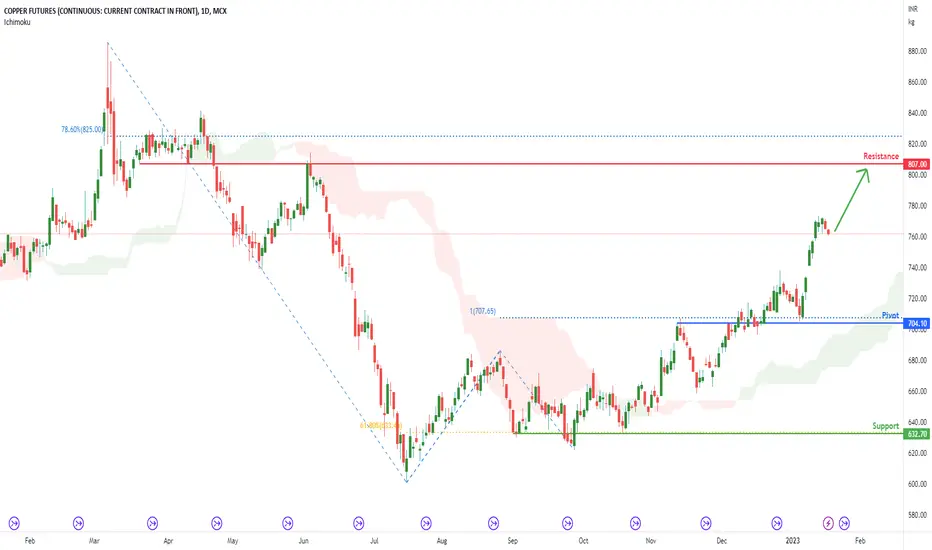
COPPER1!, Daily Potential for Bullish ContinuationTitle: COPPER1!, Daily Potential for Bullish Continuation
Type : Bullish Momentum
Resistance : 807.00
Pivot: 704.10
Support : 632.70
Preferred Case: On the H4, with price moving above the ichimoku cloud , we have a bullish bias that price may continue moving towards the resistance at 807.00, slightly below where the 78.6% Fibonacci line is.
Alternative scenario: Alternatively, price may head back down to retest the pivot at 704.10, where the 100% Fibonacci projection line is.
Fundamentals: no major news
Copper Is Simple (Bullish)Massive breakout on Copper
Wait for the pullback and green shade on the Jupu to buy

Copper to see a higher correction.XCUUSD - Intraday - We look to Sell a break of 4.128 (stop at 4.168)
Although the bulls are in control, the stalling positive momentum indicates a turnaround is possible.
A higher correction is expected.
A break of the recent low at 4.130 should result in a further move lower.
50 2hour EMA is at 4.129.
Bearish divergence is expected to cap gains.
Our profit targets will be 4.028 and 4.018
Resistance: 4.200 / 4.223 / 4.250
Support: 4.165 / 4.150 / 4.130
Please be advised that the information presented on TradingView is provided to Vantage (‘Vantage Global Limited’, ‘we’) by a third-party provider (‘Signal Centre’). Please be reminded that you are solely responsible for the trading decisions on your account. There is a very high degree of risk involved in trading. Any information and/or content is intended entirely for research, educational and informational purposes only and does not constitute investment or consultation advice or investment strategy. The information is not tailored to the investment needs of any specific person and therefore does not involve a consideration of any of the investment objectives, financial situation or needs of any viewer that may receive it. Kindly also note that past performance is not a reliable indicator of future results. Actual results may differ materially from those anticipated in forward-looking or past performance statements. We assume no liability as to the accuracy or completeness of any of the information and/or content provided herein and the Company cannot be held responsible for any omission, mistake nor for any loss or damage including without limitation to any loss of profit which may arise from reliance on any information supplied by Signal Centre.

HG1! Potential for Bullish Continuation Looking at the H4 chart, my overall bias for HG1! is bullish due to the current price being above the Ichimoku cloud , indicating a bullish market. Looking for a pullback buy entry at 3.9335, where the 23.6% Fibonacci line is. Stop loss will be at 3.7085, where the recent low is. Take profit will be at 4.4555, where the 88% Fibonacci line is.
Please be advised that the information presented on TradingView is provided to Vantage (‘Vantage Global Limited’, ‘we’) by a third-party provider (‘Everest Fortune Group’). Please be reminded that you are solely responsible for the trading decisions on your account. There is a very high degree of risk involved in trading. Any information and/or content is intended entirely for research, educational and informational purposes only and does not constitute investment or consultation advice or investment strategy. The information is not tailored to the investment needs of any specific person and therefore does not involve a consideration of any of the investment objectives, financial situation or needs of any viewer that may receive it. Kindly also note that past performance is not a reliable indicator of future results. Actual results may differ materially from those anticipated in forward-looking or past performance statements. We assume no liability as to the accuracy or completeness of any of the information and/or content provided herein and the Company cannot be held responsible for any omission, mistake nor for any loss or damage including without limitation to any loss of profit which may arise from reliance on any information supplied by Everest Fortune Group.

Copper (HG) Rallies in Nesting Impulse According to Elliott WaveCopper (HG) rally from 9.28.2022 low is unfolding as a nesting impulse Elliott Wave structure. A nest is a series of 1-2-((i))-((ii)) which is an extended version of an impulsive structure. Up from 9.28.2022 low, wave 1 ended at 3.96 and wave 2 pullback ended at 3.5410. Wave 3 is currently in progress with internal subdivision as another impulse in lesser degree. Up from wave 2, wave ((i)) ended at 3.929. The 1-hour chart below shows pullback in wave ((ii)) ended at 3.708. The metal has extended higher again in wave ((iii)).
Up from wave ((ii)), wave i ended at 3.865, and pullback in wave ii ended at 3.7985. The metal extends higher again in wave iii towards 3.988, pullback in wave iv ended at 3.932, and final leg wave v ended at 4.044 which completed wave (i). Pullback in wave (ii) then ended at 3.987. The metal extends higher again in wave (iii) towards 4.186 and pullback in wave (iv) ended at 4.129. Expect wave (v) higher to complete soon with a few more high and that should complete wave ((iii)) in higher degree. Afterwards, the metal should pullback in wave ((iv)) to correct cycle from 1.4.2023 low before it resumes higher. Near term, as far as pivot at 3.708 low stays intact, expect pullback to find support in 3, 7, or 11 swing for further upside.

COpper and other futuresCommodity traders are pumping everything, gold, oil, copper, cattle, hogs, everything I checked.
If they continue to do so, it will force the Fed to go .5% regardless of CPI. A Fed member speaks every day next week, at least one of them will probably say something.
Not as bullish as I was earlier today. Besides, CPI of 6.5% is still above 2% target.
They can't undo QE because they're under water on all of their MBS, so they're slowly letting them expire. I think interest rates will have to remain high until their balance sheet goes down. Take a look at this chart (and now you know why I keep calling Powell stupid):
www.federalreserve.gov
Copper rally to be capped.XCUUSD - Intraday - We look to Sell at 4.185 (stop at 4.230)
With signals for sentiment at overbought extremes, the rally could not be extended.
Although the bulls are in control, the stalling positive momentum indicates a turnaround is possible.
Early optimism is likely to lead to gains although extended attempts higher are expected to fail.
We look for a temporary move higher.
Our profit targets will be 4.075 and 4.055
Resistance: 4.160 / 4.187 / 4.250
Support: 4.150 / 4.080 / 4.030
Please be advised that the information presented on TradingView is provided to Vantage (‘Vantage Global Limited’, ‘we’) by a third-party provider (‘Signal Centre’). Please be reminded that you are solely responsible for the trading decisions on your account. There is a very high degree of risk involved in trading. Any information and/or content is intended entirely for research, educational and informational purposes only and does not constitute investment or consultation advice or investment strategy. The information is not tailored to the investment needs of any specific person and therefore does not involve a consideration of any of the investment objectives, financial situation or needs of any viewer that may receive it. Kindly also note that past performance is not a reliable indicator of future results. Actual results may differ materially from those anticipated in forward-looking or past performance statements. We assume no liability as to the accuracy or completeness of any of the information and/or content provided herein and the Company cannot be held responsible for any omission, mistake nor for any loss or damage including without limitation to any loss of profit which may arise from reliance on any information supplied by Signal Centre.

Fibonacci Retracement on CopperCOMEX:HG1!
Fibonacci Retracement applied on daily timeframe of COMEX:HG1! suggests that it will rally towards 4.47 after crossing 4.16 as strong candlesticks are being made.

Copper Cruising Higher!Copper was in a significant downtrend since the March 7th highs, bottoming out in July and has been trending higher from there. The precious metals have been trending higher with the dollar coming off its highs, and with this recent push higher, Copper has entered overbought territory. Going back to October of 2021, when the RSI for Copper is at or above 70, there has been an immediate decline in the price. This is not an exact science, but the market might look to take a breath and back test previous trendline resistance now acting as support.

XCUUSD ( COPPER / USD ) Commodities Analysis 10/01/2023Fundamental Analysis:
china is the biggest copper consumer and as of now we can see the most of its manufacturing plants and factories are getting shut due to Protests and ongoing havoc in the country.
DXY is very bullish which can go up to 130 and ultimately will result in the more price fall in the commodity sections.
World economic Crisis and Supply chain Disturbance which will lead to the Manufacturing Halt.
Technical Analysis:
Bearish Divergence of Price and MACD,
Hidden Bearish Divergence Formation in the process which is a very strong Bearish Trend continuation sign.
Nest Resistance and Potential Pivot Point 9500$
lower Support at 8450%
Bearish Targets: 5800$, 5250$, 4300$

#DR copper broken solid resistance and back above 200dmaHard to be bearish on global markets when probably the biggest proxy for growth is showing really strong technical action. Dr Copper has broken out its triangle which has kept price action constrained and under the 200dma for the better part of 2 months. It has now also broken above the 200day moving average with higher targets in play

Copper FuturesCopper Futures: Trading at a key Level. Trading at prior demand which may turn to supply.
For more research insights, including trade ideas, get in touch today.

HG1! Potential For Bullish ContinuationLooking at the H4 chart, my overall bias for HG1! is bullish due to the current price being above the Ichimoku cloud, indicating a bullish market. Looking for a pullback buy entry at 3.9335, where the 23.6% Fibonacci line is. Stop loss will be at 3.7085, where the recent low is. Take profit will be at 4.4555, where the 88% Fibonacci line is.
Please be advised that the information presented on TradingView is provided to Vantage (‘Vantage Global Limited’, ‘we’) by a third-party provider (‘Everest Fortune Group’). Please be reminded that you are solely responsible for the trading decisions on your account. There is a very high degree of risk involved in trading. Any information and/or content is intended entirely for research, educational and informational purposes only and does not constitute investment or consultation advice or investment strategy. The information is not tailored to the investment needs of any specific person and therefore does not involve a consideration of any of the investment objectives, financial situation or needs of any viewer that may receive it. Kindly also note that past performance is not a reliable indicator of future results. Actual results may differ materially from those anticipated in forward-looking or past performance statements. We assume no liability as to the accuracy or completeness of any of the information and/or content provided herein and the Company cannot be held responsible for any omission, mistake nor for any loss or damage including without limitation to any loss of profit which may arise from reliance on any information supplied by Everest Fortune Group.

MCX COPPER : VIEW SELL MCX:COPPER1!
RATIONALE : COPPER JAN : As per Technical chart, considering resistance price range of 750-755 level .Hence we may see some profit booking or bull move to be slow, it may expected to move towards 744 -740 price level
