Comp Triple bottom1.) Triple Bottom (bull)
2.) Long term Trend line intact (bull)
3.) watch for short term trendline to break (bull)
Bearish case if price falls below triple bottom
COMPUSD trade ideas

COMP Gartley PCZ with level support reached. Decent entry point for COMP at low risk areas. Targets based on conservative fib points.

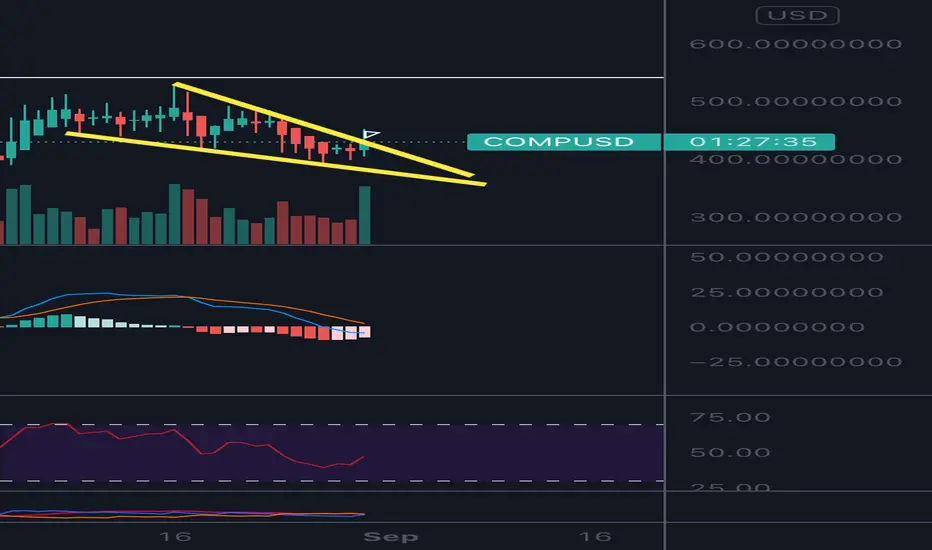
COMPUSD - Falling wedgeIn my analysis it seems there is a second falling wedge, from where COMP kan breakout to reverse the down-trend. Perhaps it will go sideways for a couple of hours/days before it the breakout will happen

comp buy time EVERyone buy in dip then make more profit
and buy when everyone selling
and don't buy then everyone buying

COMP - Time to pay attention!Before reading, get rid of your moonboy mentality and no emotions for dips/corrections! Cannot rule bearish scenarios! Dips are for buying!!
People are so focused on the hourly/daily timeframe that they get emotional on every dip! Take a step back to the weekly/monthly timeframe and see why I'm so bullish now. Stop looking at the short term dips/rise. Short term is irrelevant for the move that is coming!
You can't be emotional in these markets (stocks, forex, crypto, real estate, etc.). You will lose this game following the news and doing what the majority does. News creates emotions. Everything you need to know are on the charts. News are manipulated by the elites, and they take advantage of our emotions. Stop listening the news and pay more attention to the charts. Don't follow the majority, because the majority will lose in the end! Also, don't buy the hype when everyone is buying.. instead buy the fear when everyone else is selling
Everything is on the chart! Cryptocurrencies are on the verge of exploding higher. Dips/Corrections are normal and needed in a bull market, and are buying opportunities! Huge gains opportunity in the coming months! Never trade blindly. Use multiple indicators to make calculated decisions. Trade with no emotions!
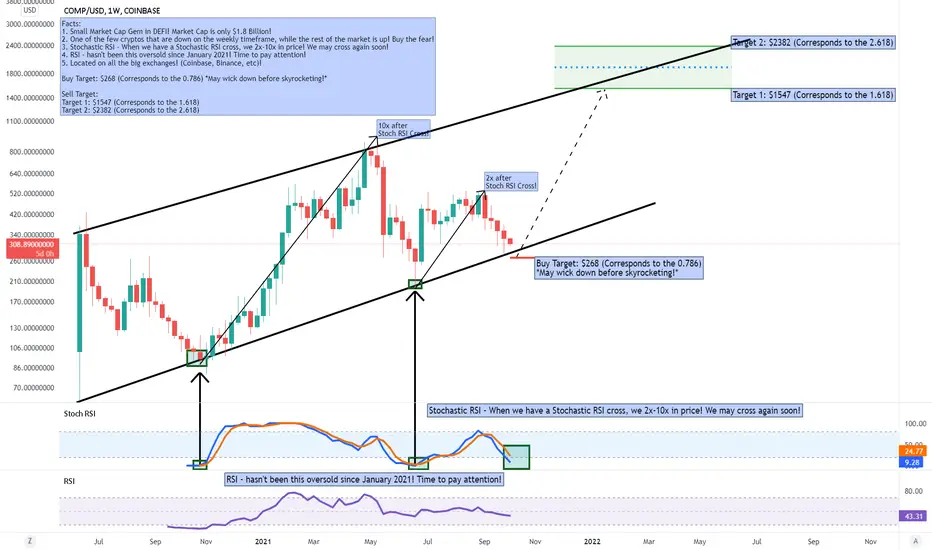
Facts:
1. Small Market Cap Gem in DEFI! Market Cap is only $1.8 Billion!
2. One of the few cryptos that are down on the weekly timeframe, while the rest of the market is up! Buy the fear!
3. Stochastic RSI - When we have a Stochastic RSI cross, we 2x-10x in price! We may cross again soon!
4. RSI - hasn't been this oversold since January 2021! Time to pay attention!
5. Located on all the big exchanges! (Coinbase, Binance, etc)!
Buy Target: $268 (Corresponds to the 0.786) *May wick down before skyrocketing!*
Sell Target:
Target 1: $1547 (Corresponds to the 1.618)
Target 2: $2382 (Corresponds to the 2.618)
"If you can't beat the fear, do it scared!"
"Be fearful when others are greedy, and greedy when others are fearful!" - Warren Buffet.
"Markets are a device for transferring money from the impatient to the patient. - Warren Buffet
"Show me the charts, and I'll tell you the news." - Bernard Baruch
"The secret to investing/trading is figuring out how rich you want to be and how poor you're willing to become."
"If you want to live like the 5% of the population who are hugely successful, then don't act like the 95%!"
COMPOUND COMPUSDT Inverted H&SHello Traders,
this is my view for BINANCE:COMPUSDT .
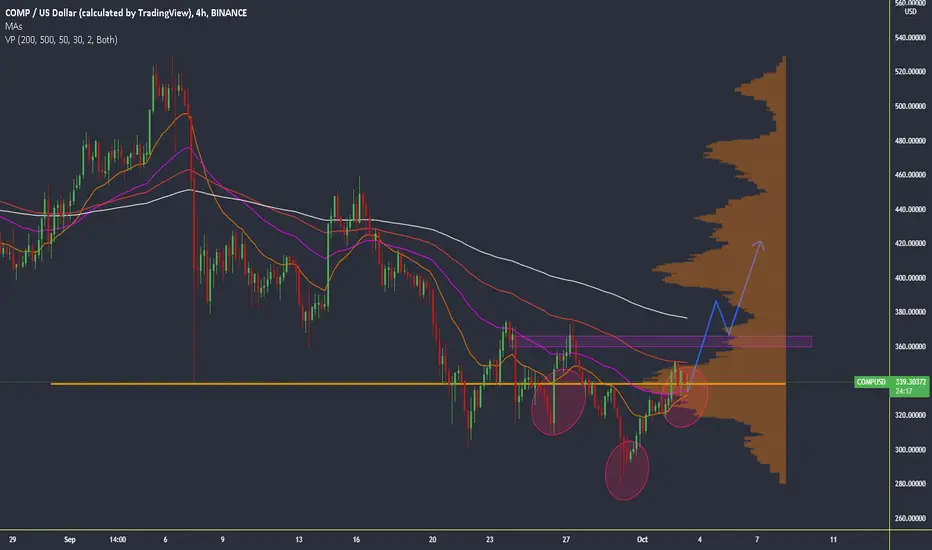
BYBIT:COMPUSDT broke up the 4h POC and closed above. Now we are trading at 338 usd targeting 415 - 448 - 578.
Seems to be forming and inverted head and shoulders.
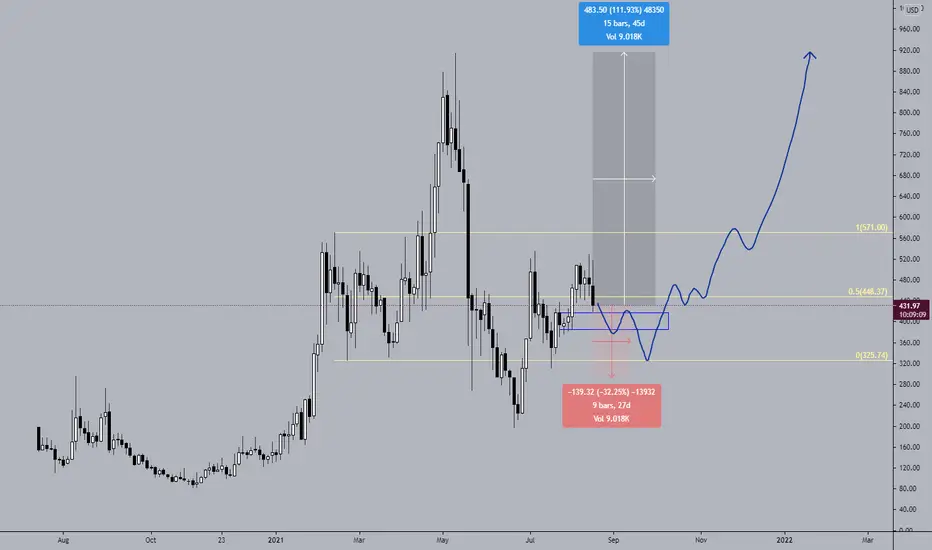
Compound USD predictionAnother Compound chart showing potential path of moving average and price action over the next couple of weeks.
Just a prediction; Nothing to base your trades or finances upon only an idea.

COMPOUND price predictionEstimation of Compound /USD price action over the next month or two. 200 Moving average beginning to curl upward. Barring any bad news events in traditional markets prices should continue to rise over the next month in most cryptos.

I am starting to form a new position on altcoins COMPUSDT I am starting to form a new position on altcoins / COMPUSDT The fundamental coin is one of the leaders in the DEFI industry. Bought in the OTE buy zone (Optimal buy zone) This is a price correction to the 0.38-0.5 Fibonacci levels from the initial recovery impulse on June 26 - July 6. I bought only 20% of the entry, so that it could be averaged if the price falls into the 267-226 zone

COMP Inflection zone break.Testing the top of the range here as support with a bullish engulfing candle here on the 1HR and bullish divergence on the MACD


COMPUSD Bullish on COMP across all time frames as price refuses to break lower and has retested previous resistance now turned support more than once.

COMP simple s/r flip, looks primed to breakoutCompound is looking very bullish on the COMP/USD and COMP/BTC pair. There are 2 trendlines to break out of for COMP on the BTC pair which it is testing the first, and as we can see we have a smaller S/R flip with a higher low just under a current resistance. If we break this resistance, there is not much in the way for a ~25% move to the mid-upper 600s as shown in the chart. Long can be taken, with targets and stops as shown

COMP seasonDefi has underperformance most of 2021 - I think it outperforms EOY and finishes parabolic

COMP Ascending Triangle 01/09/2021There is reason to believe we may be in super-millennium wave 5, and are prepping for millennium wave 3. Price is currently holding this high volume profile area and bouncing off the channel median. Volatility indicator at the lows while price is making higher lows and is now slowly growing. Hidden bullish divergence is visible on 1D RSI.
Measured price target of triangle breakout: ~$678 (28.9%)
On the H4 timeframe we can see the most recent breakout, with volume, RSI and volatility increasing:

COMPUSD Impressive symmetryImpressive symmetry between right and left sides of the possible head and shoulders formation
I am long this coin

CompGot the breakout after a pull back and retest of the wedge on smaller time frames. Some resiatnce at 477 and monster resiatnce 542. I’ve been long since 429$ looking good still! Let’s goo

CompComp looking interesting to me. Looking like it’s breaking out on smaller timeframes. Seems to have a large volume spike. Seems to have broke from 429$ area. Is now in an ascending traingle on smaller timeframes. With support around 439$. I did jump in around 431$ as my alerts went off and may add more if we break above 450 and hold. Target is 530
COMP 1D Ascending Triangle 23/08/2021Potential ascending triangle visible on the 1D chart. Confirmation as per Bulkowski is 3 touches of one trendline, and 2 of the other - we are 1 touch away. Volume is also trending downwards, consistent with the pattern. Measured price target is ~28.7% (~$682). Average rise for this pattern is 43%. Breaks upwards 63% of the time.
Breakdown of lower trendline would likely lead to continuation drop until $380/$325.
Other technicals:
Bollinger bands are squeezing, indicating we may see a large move when this breaks out of either side.
RSI has been bouncing off the median and is trending inside the bullish control zone.
VPVR shows a large amount of positions being taken at this current price range.
Higher lows being plotted so far by the lower trendline.

COMP long termCOMP long term scenario, keeping it as a record, would like for it to go up but in the worst case it takes out range low and goes for ATH
COMP Affection for Inverse H&SShowing all the inverse H&S patterns on chart
Seems COMP has an affection for them


COMP Cup & HandleCOMP forming a classic cup & handle above the 200 day. If Bitcoin can hold the 200 day, think this breaks out shortly. Measured move is to the $700 resistance
