COMPUSDT is creating a double bottomThe price is testing the demand zone on the daily timeframe where the market is creating a double bottom.
How to approach it?
IF the price is going to grab new liquidity, we could see a pullback untile 0.5, 0.618 Fibonacci level, so According to Plancton's strategy , we can set a nice order
–––––
Keep in mind.
🟣 Purple structure -> Monthly structure.
🔴 Red structure -> Weekly structure.
🔵 Blue structure -> Daily structure.
🟡 Yellow structure -> 4h structure.
⚫️ black structure -> <= 1h structure.
–––––
Follow the Shrimp 🦐
COMPUSDT trade ideas

A breakthrough is already underway. Time to open a sell positionThe price after a strong fall went for correction. For a long time it was traded in the sideways. The market is extremely negative. Volumes are reduced. Once again approached the level of 33.28 $. I expect a breakout and a movement below. The first goal is a local minimum of $ 32.66

COMPUSDT HELLO GUYS THIS MY IDEA 💡ABOUT COMPUSDT is nice to see strong volume area....
Where is lot of contract accumulated..
I thing that the sellers from this area will be defend this SHORT position..
and when the price come back to this area, strong sellers will be push down the market again..
DOWNTREND + SUPPORT from the past + Strong volume area is my mainly reason for this short trade..
IF you like my work please like and follow Thanks

Anticipating structure confirmation Although news seems to be pushing this pair upwards, I am anticipating a downward trend confirming this pattern. Let's see how this plays out.


FUTURES TRADERS SET YOUR SHORT POSITION ON THE GIVEN ENTRIESComp/usdt made a liquidity and suddenly dropped to a 15mins demand zone which is now pushing and to a trendline, hope it obeys the trend line

compusdt positionIf the candle closes after the specified points, you can open the desired position.
You have to manage your risk, don't forget the stop loss

COMP
#COMP/USDT
Exchanges: Binance-Bittirex
Signal Type: Regular (Long)
Amount: 2.0%
💎 Entry Targets:
1) 37.40- 31.99
Take-Profit Targets:
Target 1: 53.54
Target 2: 69.32
Target 3: 92.78
Target 4: 101.92
Target 5:
Target 6:
Target 7:
🚫 Stop loss:
28.48

COMP Analyze::S&R in short time frame>>>>Hello EveryOne
I Have Tried My Best to Bring the best Possible outcome in this Chart.
Short term possibilities marked on the chart.
We buy only in possibility breakout and in correct to broken gray line (weak supply zone)
It's just an analyze definitely not happen .
Not a financial advise.
PLZ DYOR
With hopping success>>>>>>>>>>>

COMPUSDT | SETUPCOMP has been trading in bearish trend.
The price has currently has hit the falling resistance.
Now the price is trading near the horizontal support.
The bulls can show strength at this level.
Manage your levels accordingly.

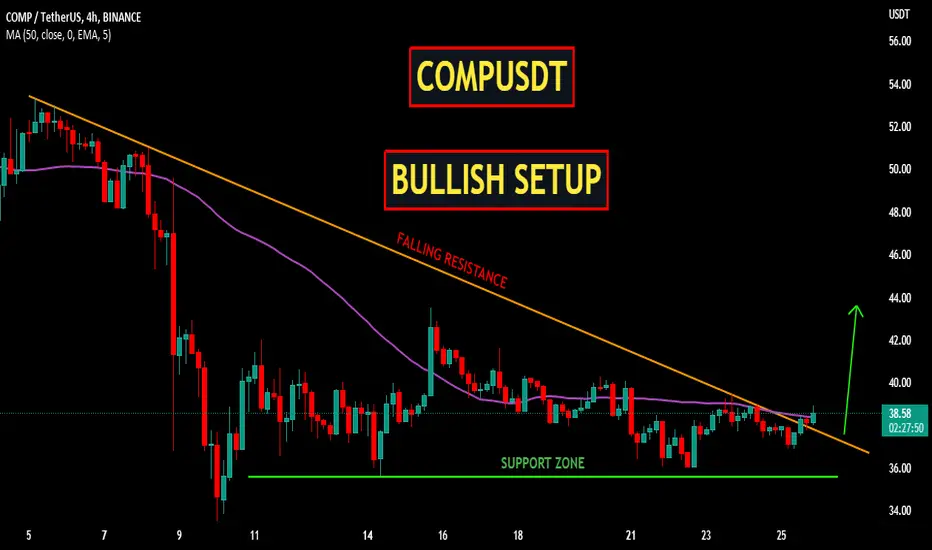
COMPUSDT | BULLISH SETUPCOMPUSDT was trading under the falling resistance on shorter time frame from last 1month.
The bulls has now broken price above the falling resistance.
The bulls need to hold the breakout zone.
One can long whole keeping SL below the support zone.
Manage your trades accordingly.
Down Channel breakout on COMPHello guys ,Today i saw a Down Channel on COMP and i thought it will be a good setup.
The price will hit the local support soon.
open your position after you see a bullish candle.(wait,don't open your position fast !)
the target is between 43 and 45.5.(it's safe to close your position).
always pay attention to fundamental news.(it may ruin the position).
it's just an idea , always do your research and analysis.
don't forget to follow and boost this idea :) thank you.

COMP USDT Forming HTF Gartley Bullish SetupWait and see the potential bull run pattern forming. Not financial advice.

COMP EITHER ORI can s the significant number of 100 being respected on the technical so I'll be looking to get in short from just below. Long 27.2 Short 98.8

COMP/AAVE trading pairThe comp aave pair always bounces off the same lows. and the same highs. will continue to trade when one is hit.


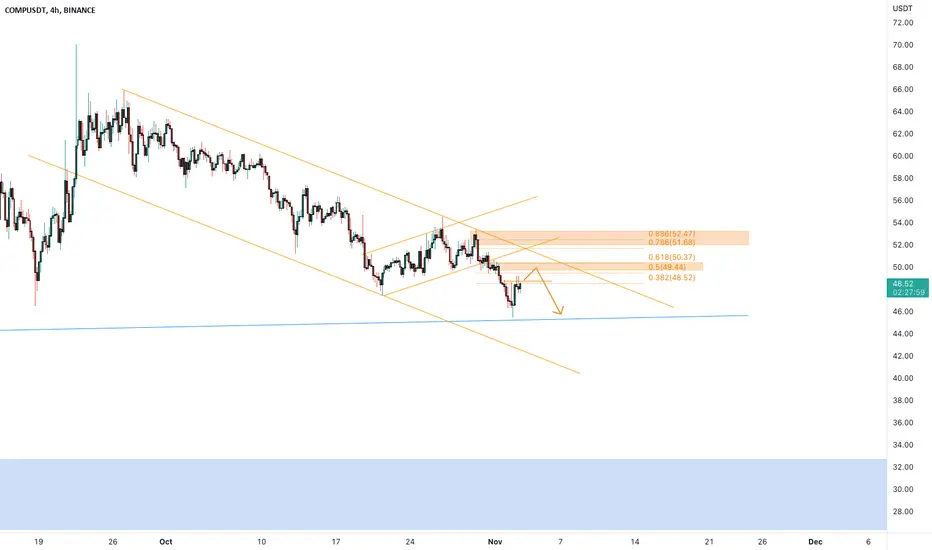
COMPUSDt Pullback?the price is testing the daily dynamic support at 46$ area where the price has a key level. Th market has a big liquidity on 34$ area
How to approach it?
The price could have a pullback until 0.618 - 0.786 Fibonacci Level, so According to Plancton's strategy , we can set a nice order
–––––
Keep in mind.
🟣 Purple structure -> Monthly structure.
🔴 Red structure -> Weekly structure.
🔵 Blue structure -> Daily structure.
🟡 Yellow structure -> 4h structure.
⚫️ black structure -> <= 1h structure.
–––––
Follow the Shrimp 🦐
$70 in the next few days? or next week?Everything looks like its matched up for this to take off..... Thoughts?

COMP - Buying SignalBYBIT:COMPUSDT.P
4H time frame
-
COMP is hanging about on the support zone, open long here with good risk to reward ratio.
-
Entry: Market
Add: 4.815
TP: 52, 54.5, 58, 63
SL: 47.9

COMP no positive signals but still in trendBINANCE:COMPUSDT
Locally no signals to buy or sell for COMP but for middle term if you looking for next few month COMP can pump over 100%
✅Before we start to discuss, I would be glad if you share your opinion on this post's comment section and hit the like button if you enjoyed it.
Thank you.
Possible Targets and explanation idea
➡️This fib still relevant since local top in April
➡️Traded under fundamental price and appeared Strong Buy signal in June by "Trade ON" indicator
➡️4 October appeared signal to Buy on Direction indicator. Strong Signal
➡️Now if market crash again buy line for Comp at 35.85 will be good enter point
➡️For local trades 71$ is good time to take profit on "take profit line"
➡️Middle term target is correction by this fib to 128$ (0.618 fib level)
➡️Globally with market supply of COMP I can expect price higher then 500 again
Hope you enjoyed the content I created, You can support with your likes and comments this idea so more people can watch!
✅Disclaimer: Please be aware of the risks involved in trading. This idea was made for educational purposes only not for financial Investment Purposes.
* Look at my ideas about interesting altcoins in the related section down below ↓
* For more ideas please hit "Like" and "Follow"!


COMP | Seems like Ready to FLY..!!
#COMP Descending Channel Formation in Higher timeframe Chart..!!
Major Trendline Resistance getting Weaker & Buying Volume Coming in, Expecting Breakout.
In Case of Upside Breakout, Expecting 2-3x Bullish Rally in the Midterm..
Please like the idea for Support & Subscribe for More ideas like this and share your ideas and charts in Comments Section..!!
Thanks for Your Love & Support..!!

COMP long @ 49.00 10x leverageCOMP is consolidating heavily on lower time charts. I am opening a scalp long. I may add onto this position as time goes on.
Momentum indicators, MACD and TSI are signaling a consolidation of price action on the 30m.
We're within our Keltner Channel so we have support beneath us.
Lower time charts are signaling a small move up before our macro move down.
