COMPUSDT trade ideas

ALT/USDT|COMP/USDT|LongLong COMP/USDT
The system trading idea is activated only when it is fixed in the highlighted blue zone, if the price has gone beyond the highlighted zone, then the transaction is activated 2 minutes after the breakout.
* The author reserves the right to close the deal before reaching the take zone and the stop zone. Closing a deal for subjective reasons does not completely cancel the idea and is not a call to the same action, you can continue developing the idea according to your data, but without the support of the author.
The level indicated by the ellipse is a zone of increased resistance, a reversal is possible in this area for correction, please take this factor into account in this transaction.
The term "forecast" was used to indicate the percentage potential in this idea. The author does not take into account the date and time of the trade, only the percentage change.
Blue zones are activation zones.
Green zones are take zones.
The red zone is the stop zone.
Working out of the take level takes place without fixing on a "pending order", working out of the stop level only when fixing in the stop zone or breaking through this zone.
SUM PNL: This parameter displays the total % of all closed ideas (according to the author) for this sector at the time of publication of the idea. The calculation is very "clumsy" just the sum of the profits of all the ideas, based on this indicator, you can more accurately assess the risks when working with my ideas of this sector. I present you the construction of the idea, you can use it yourself as you like based on your subjective view and risks, the calculation of the PNL indicator is carried out only on transactions that the author closed on TV in manual mode or by take.
!This idea is in the format of a systemic trading idea, losses will be mandatory, the goal is to gain a positive PNL at a distance by using the system. Follow your own risk and money management parameters if you are going to use these ideas.!

COMP longI hope to see BTC dominance to correct downwards, that allowing alts to move up, and if that happens i hope this patterns plays out.

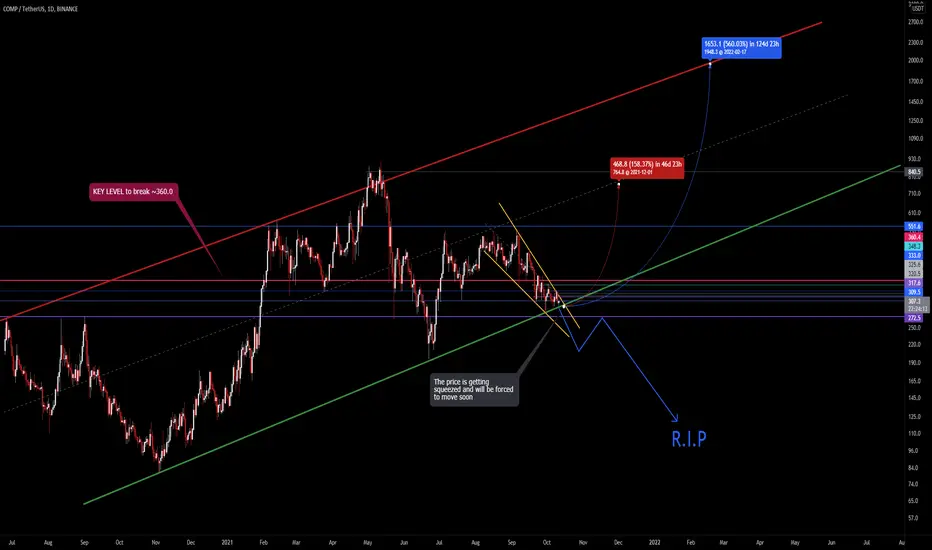
🚨COMP-is it time? F.Wedge+Macro BottomWhat you need to know is that the was some bad news that came out recently:
"$22M Drained From Compound Contract That Was Hit for $80M Last Week. About $66 million – and counting – was recently added to the still vulnerable contract, thus making more funds available for exploit. "
Source: coindesk
That event obviously had a negative impact on the price, but surprisingly we didn't see a rapid sell-off.
Compound touched the bottom trendline of the parallel channel for the third time and seems like it's about to break out of the falling wedge formation anytime now.
The key level to claim is ~360.0. Once it's done compound will be ready for some big moves. Until that happens it's possible for the price to just keep going sideways.
compusdt potential bullish scenariomacd divergence @ 1hr
mfi divergence @ 1hr
well respected .618 fib level
potential reversal weekly chart
retest around 296-298


COMP 1D : LONG TERM BUY ZONEKeep In Mind ❗
🟣 Purple structure -> Higher Timeframe Structure.
🟢 Green structure -> Daily Structure.
⚫️ Grey structure -> 4h Structure.
🟡 Yellow structure -> <4h Structure.
Important : Please Use RM (Risk Management) and MM (Money Management) If You Decide To Use My Ideas, There Will Always Be Unprofitable Ideas, This Will Definitely Happen, The Goal Of The System Is That There Will Be More Profitable Ideas At A Distance.
COMP/USDTSimple . FTM and CELR was in a position like this and pumped . is it time to COMP?
we try our chance :)

Compound vs Tether Will Also Turn Bullish... Watch!This pair, COMPUSDT, is also very likely to go bullish in a matter of days.
We will see prices moving above EMA10, then EMA21 and finally EMA50 just to grow some more.
We have an early signal with the young bullish cross on the MACD Together with a higher low...
The RSI is also looking good.
The targets are mapped on the chart.
Thanks again for reading.
Your support is appreciated.
Namaste.


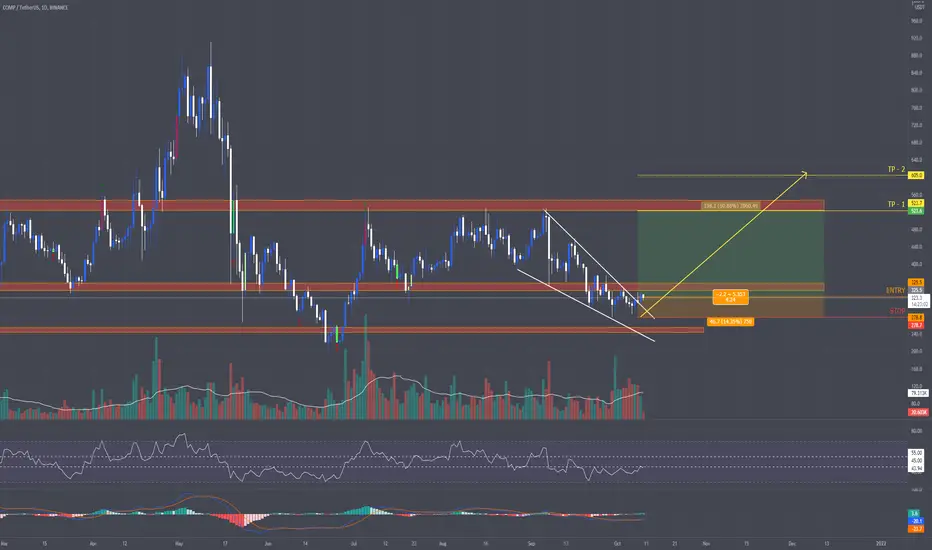
COMPUSDT - Falling Wedge Pattern!COMPUSDT (4h Chart) Technical analysis
COMP/USDT (4h Chart) Currently trading at $325
Buy level :Above $321
Stop loss: Below $284
TP1: $372
TP2: $427
TP3: $474
TP4: $528
Max Leverage 3x
Always keep Stop loss
Follow Our Tradingview Account for More Technical Analysis Updates, | Like, Share and Comment Your thoughts.

Time To Long COMPUSDT For A +50% ProfitDon't miss this opportunity, the plane try bodies of trading 😋😋are lined up perfectly to deliver over 50% profits on COMPUST, i made similar prediction last week on ONTUSDT, and over 30% has occurred on ONT since i mention it. Comp is a great crypto project that is currently priced way bellow its actual value, with BTC set to move up this month, expect similar on this asset as you will notice that we have just broken a descending trend on comp. Follow me and give a thumbs up to get keep getting timely call outs like this from me.

comp is readyhello friends, I think Comp is ready for a pump, if u can buy it around 300 to 320, I think in first step it can go above 350, let me know what you think in the comments

Comp Getting SupportCOMP looking so bullish now, Triple Bottoms got support and Bears power seems so low.Heikin Ashi just with Doji.Huge rally is expected

COMP over 20%comp comp comp. everyone wondering with the bad news out there, it seems not to really affect the price... actually everyone think now seeing the price going its moving up.. its good profit over 20%.
the bad news means a seed has being planted waiting to grow (375 - 390) harvesting could begin from there.
however this is what i think... i call this price movement the fools bait.. or invitation of the dumb money.. i have being there alot of times, and few times still do lol. but i think this time i can see it happening.. i am sure no one is interested in buying now.. but would @ 360- 370 area...

Comp noob analysis this is how I feel comp coin will play at since its been consolidating for some time, may trade sideways for some time more.

bull are in chargecomp is on a retest after breaking out a falling wedge pattern
i personally long it to 0,5 fibo area
DYOR
Not a financial advice

COMP SITTING IN A NICE BUY ZONE$COMP is quietly sitting in an accumulation zone. This is a great buying opportunity to get in before we start moving towards ATH or even price discovery by the end of Q4.
This is just an analysis, not a financial advise.


COMP confirmation low at pattern completion zone of a sharkBINANCE:COMPUSDT just made a confirmation low at the PCZ of a bullish shark. Very nice low risk entry for a long with much higher upside after the falling wedge breaks. Good luck traders!

COMPUSDT AnalysisHello friends.
Please support my work by clicking the LIKE button(If you liked).Thank you!
Everything on the chart.
open pos: market
target: 360 and 390
after first target reached move ur stop to breakeven
stop: ~290 (depending of ur risk). ALWAYS follow ur RM .
risk/reward 1 to 2
Good luck everyone!
Follow me on TRADINGView, if you don't want to miss my next analysis or signals.
It's not financial advice.
Dont Forget, always make your own research before to trade my ideas!
Will be very appreciate for ur donat/coins :)
Open to your questions or suggestions(Looking for investors!).

Comp waiting for a buyI'm waiting this downward trend to be breaken UP to buy.
Not to far from support zone.
Let's see.

