COMPUSDT (DAY TF) Technical Analysis, Asending TriangleCOMPUSDT (DAY TF) Technical Analysis
Waiting for the ascending triangle breakout
COMP/USDT currently trading at $513.5
Buy-level: Above $535
Stop loss: onve daily TF closes below $425
Target 1: $600
Target 2: $670
Target 3: $840
Target 4: $910
Max Leverage: 4×
ALWAYS KEEP STOP LOSS...
COMPUSDT trade ideas

COMPUSDT Ascending Triangle Formation!COMPUSDT (DAY CHART) Technical Analysis Update
Waiting for the ascending triangle breakout
COMP/USDT currently trading at $514
Buy-level: Above $535
Stop loss: i will update once i see the breakout
Target 1: $610
Target 2: $685
Target 3: $830
target 4: $880
Max Leverage: 2X or buy it on spot
ALWAYS KEEP STOP LOSS...

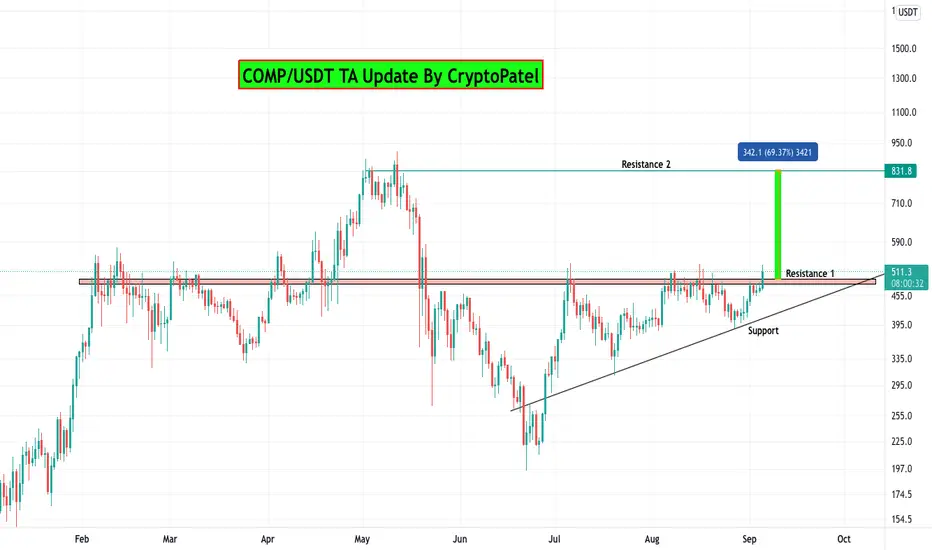
COMP/USDT Ready for 70% move from here...?#COMP/USDT TA Update:-
#COMP currently trading at $510
And Looks good as per chart.
Broke out resistance $495
Now…?
Volume also good so I am expecting Big move in coming days.
If hold $500 support then We can see $800
Support:- $490/$430
Resistance:- $831
Please click like button and Appreciate my hard work.
Must follow me for latest crypto real time updates.
Thank you..
#COMPUSDT Daily Chart
Price is moving in an uptrend creating higher highs, however it is failing to break the resistance at $517.4. MACD is in a bullish territory and RSI is bough plus price is trading above EMA ribbon. In addition to all those bullish indications, price has tested this resistance level multiple line so we should expect a breakout soon. Overall price is expected to reach the daily supply zone.

COMP/USDT LIMIT BUY SIGNALThis is a medium probability setup, where we expect the crypto market to continue rising. COMP price action does look very attractive.
COMPUSDT are two potential cup and handle patterns ?On the left side 4h chart
There is a big potential cup and handle pattern and it broke-out the handle .
We can setup a long-term trading plan
TP1 : Fib 1 (531.0)
TP2 : Fib 1.272~1.382(622.0~658.8)
SL : 399.2
On the right side 1h chart
There is a tiny cup and handle pattern
and it broke-out the downtrend line and retest the line .
We can setup a short-term trading plan
TP1 : Fib 1.272~1.382(510.9~521.4)
TP2 : Fib 1.618(543.9)
TP3 : Fib 2(580.3)
SL : 462.7
Or you can hold until touch the long-term target .

COMPUSD Compound TokenDaily close above 485 and this one sends to ATHs
Breaksout in the next week imo
defi heating up for semptember also
most coins with utility to ATHs by the end of the year yadayada
incredible opportunities right now across the board


A Good spot for buying $COMPA Good spot for buying #COMP if you still don’t have one.
Broke through the descending resistance and took hold above it.
On The 1D Time, $COMP Have strong support we might never see it again

compound COMPUSD what next after retesting its resitance HI, congratulations and enjoy your profits if you took trades on my previous compound analysis where I explain how it is forming a bullish divergence where it can it is almost at my point I closed my 50% position waiting for retesting if rejected i will close all my positions and will open short
here is a complete representation of what I going to do next
If you are new to my analysis the check my previous predictions and decide for yourself

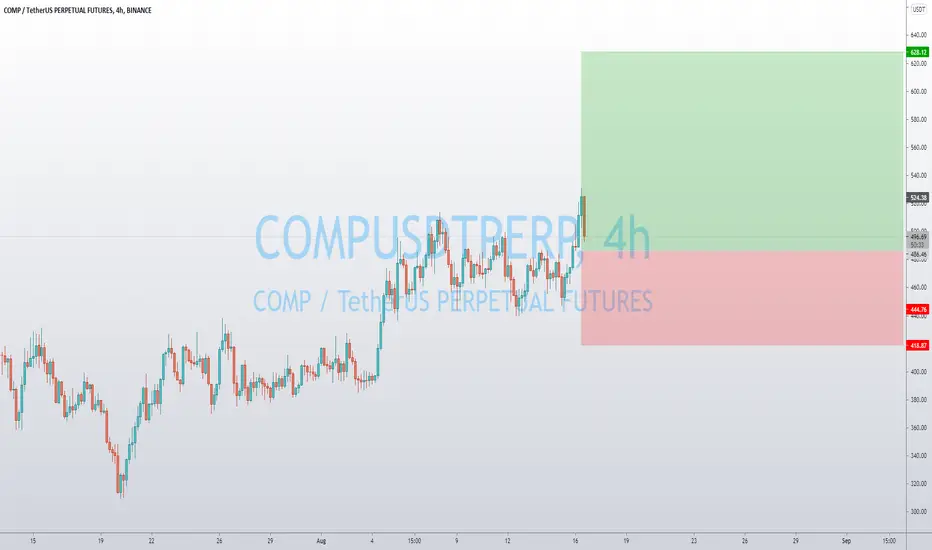
$COMP/USDT (Binance Futures) Falling wedge breakoutCompound is looking good for bullish continuation here after regaining 100EMA and breaking out.
Current Price= 455.95
Buy Entry = 455.63 - 442.81
Take Profit= 496.82 | 548.43 | 601.95
Stop Loss= 1039.8
Risk/Reward= 1:1.25 | 1:2.6 | 1:4
Expected Profit= +21.20% | +44.16% | +68.00%
Possible Loss= -17.02%
Fib. Retracement= 0.786| 1.117 | 1.414
Margin Leverage= 2x
Estimated Gain-time= 5 weeks

COMPUSDT🌟this alt is in sideway in higher time frames while showing signals of bullish sign in lower ones that's where we enter in such coins
🌟the chart can face the 421$ too but as we have a greater target for it and no time to check all of these opportunities we just enter here and wait for our targets to be touch
👉This idea has the confirmation of "advanced price action" 👍
👉Follow us and invite your friends too, this way we can share ideas and signal to anyone we care 👍
👉Hit share and spread the information in public chats or your twitter for everybody to get profit 👍
👉Tell us what's important for you in the market or what asset makes a difference in your investment basket 👍

COMP triangle breakoutCompound seems to be ready to break up this triangle 📐 and if successful I think there is chance for run to 481 and even higher.
ENTRY : local high @ 445
SL : local low @ 432
TARGET : height of the triangle projected from midpoint of the local range (BUY STOP-LIMIT - SL) @ 481
RRR : 2.7
INVALIDATION : when SL level hit
Like👍, follow✒️, enjoy📺!

COMP/USDT - potential 131% setupHello, Traders!
COMP has been consolidating in the active trading range of $396 - $492 for a long time
Volumetric and cluster analysis shows the presence of demand on the part of buyers.
It is possible to connect to purchases in parts in order to catch a stop on correction:
The first part in the range of $396 - $435
The second part in the range of $332-$370.
Stop loss on consolidation below $255
Buying targets would be levels:
$550
$608
$691
$786
$852
Good luck and watch out for the market
P.S. This is an educational analysis that shall not be considered financial advice

COMP/USDT FUTURES No body have been talking about this coin in awhile. The best time to enter a coin is when know one is looking.. SOOO check it out..

COMP - new rocket 🚀🚀COMP is a promising new project. Compound is a DeFi lending protocol that allows users to earn interest on their cryptocurrencies by contributing them to one of several pools supported by the platform.
Globally, the price is near a strong support line. Locally, the price has broken the sloping trend line. If the price tests the trend line as support, it would be a good point to buy. Potential targets are marked above.
Be careful, if Bitcoin goes down, all altcoins will go down as well.
Write in the comments all your questions and instruments analysis of which you want to see.
Friends, push the like button, write a comment, and share with your mates - that would be the best THANK YOU.
P.S. I personally will open entry if the price will show it according to my strategy.
Always make your analysis before a trade

COMPUND FINANCE (COMP) Looking Nice.Looks like we're sailing towards some price appreciation in the days to come. Blue chip DeFi projects such as Compound Finance will perform well throughout this year. Decentralized lending protocols play such a vital function in DeFi.. We're oversold on the daily Stochastic RSI and about to bullishly diverge on the MACD. I'm liking how COMPs chart is looking moving steadily sideways. May be a decent time to get in on a short term. Only 10,000,000 coins and 55% are already circulated. COMP has great potential to easily be a $1,000+ coin this cycle. Good Support at $400!
Peace, love, health, and wealth be with you.

COMPUSDT Technical Analysis
⏳ Spot
💎 COMPUSDT Has broken above the triangle. It may go down for a Pullback before it continues to go up.
🏁 Medium & Long Term
💵 Invest Only 5% of your Portfolio
🎳 Entry at market or 412.0
☕️ TP1 470.0
🍺 TP2 525.0
🍻 TP3 600.0
🍾 TP4 _____
🍷 TP5 _____
🍸 TP6 _____
🍹 TP7 _____
🎁 TP8 _____
🚫 SL 378.0
Good Luck 🎲
Check the Links in Description and If you LIKE this analysis, Please support our page and Ideas by hitting the LIKE 👍 button. ❤️ Your Support is really appreciated! ❤️
Traders, if you have your own opinion about it, please write your own in the comment box. We will be glad for this.
Feel free to request any pair/instrument analysis or ask any questions in the comment section below.
We will have more FREE forecasts in TradingView soon
Have a Profitable Day


COMPOUND stuck in this zone ? will it break itHi, As you know compound has so much potential but with the uncertainty in the market, in the recent bullish scenario those who bought at high have sold it so the volume of compound decreases at a rapid pace
No compound is consolidating in this for a while there is strong support in this area around 390-400
as we now seeing the volume coming in it will restest the previous support after that we will think to take entries at 400 then will hold it till 550-600. we are eying at that level

COMP Head and ShoulderBINANCE:COMPUSDT
There is an almost ideal head and shoulder pattern on the chart
Which you can achieve after the resistance of the pattern neckline
Come in and make a profit of 0.618 and
The price is on strong support that is likely to rise

COMPUSDT LONGPrice is breaking out a descending channel
The target for the price is the next upcoming resistance.

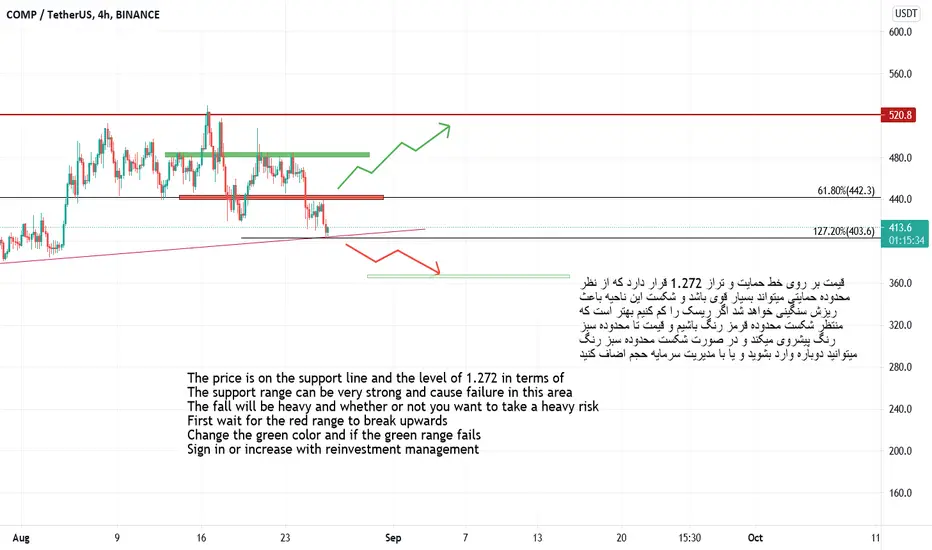
COMP/USDTBINANCE:COMPUSDT
The price is on the support line and the level of 1.272 in terms of
The support range can be very strong and cause failure in this area
The fall will be heavy and whether or not you want to take a heavy risk
First wait for the red range to break upwards
Change the green color and if the green range fails
Sign in or increase with reinvestment management