Compound (COMP) - October 5Hello?
Welcome, traders.
By "following", you can always get new information quickly.
Please also click "Like".
Have a nice day.
-------------------------------------
(COMPUSDT 1W Chart) - Mid-Long-Term Perspective
Above the 144.58-287.10 section: The uptrend is expected to continue.
The centerline of OBV in the volume indicator is showing a lot of upside.
We need to see if the green width increases as the centerline of OBV declines.
If the price is maintained above the range of 144.58-287.10 with this change in trading volume, it is expected to lead to a large increase.
On the wRSI_RC indicator, you need to check if the RS line rises below 20.
If this change is accompanied by a volume explanation, we would expect it to turn into an uptrend and move up along an uptrend line.
(1D chart)
Support section: 220.36-266.58 section.
First resistance zone: near point 359.03.
Second resistance section: 451.47-497.69 section.
If it falls from the support zone, it is expected to touch the 144.58-191.87 zone, which is the boundary zone of the mid- to long-term investment area.
I mentioned the resistance section separately, but the resistance section is formed throughout the volume profile section spanning the section 359.03-529.78.
It is expected that it will take some time to break through this section upwards, but if the BTC price rises to the 50K level and maintains the price, it may rise accordingly, so we need to watch the flow.
------------------------------------------
We recommend that you trade with your average unit price.
This is because, if the price is below your average unit price, whether it is in an uptrend or in a downtrend, there is a high possibility that you will not be able to get a big profit due to the psychological burden.
The center of all trading starts with the average unit price at which you start trading.
If you ignore this, you may be trading in the wrong direction.
Therefore, it is important to find a way to lower the average unit price and adjust the proportion of the investment, ultimately allowing the funds corresponding to the profits to regenerate themselves.
------------------------------------------------------------ -----------------------------------------------------
** All indicators are lagging indicators.
Therefore, it is important to be aware that the indicator moves accordingly with the movement of price and volume.
However, for the sake of convenience, we are talking in reverse for the interpretation of the indicator.
** The MRHAB-O and MRHAB-B indicators used in the chart are indicators of our channel that have not been released yet.
(Because it is not public, you can use this chart without any restrictions by sharing this chart and copying and pasting the indicators.)
** The wRSI_SR indicator is an indicator created by adding settings and options to the existing Stochastic RSI indicator.
Therefore, the interpretation is the same as the traditional Stochastic RSI indicator. (K, D line -> R, S line)
** The OBV indicator was re-created by applying a formula to the DepthHouse Trading indicator, an indicator disclosed by oh92. (Thanks for this.)
** Support or resistance is based on the closing price of the 1D chart.
** All descriptions are for reference only and do not guarantee a profit or loss in investment.
(Short-term Stop Loss can be said to be a point where profit and loss can be preserved or additional entry can be made through split trading. It is a short-term investment perspective.)
COMPUST trade ideas


COMPUSDTHello traders.
comp has reacted well to the multi support zone(intersection of channel's lower band & the 270 level of support).as long as the price is inside the channel we are aiming for level 1 & level 2.

COMPUSDTRetest is done ! let pump it !!!
comp is retesting and will follow alt coins hopefully to reach high target .
buy between 332-340 .
note ! not a financial Advice !

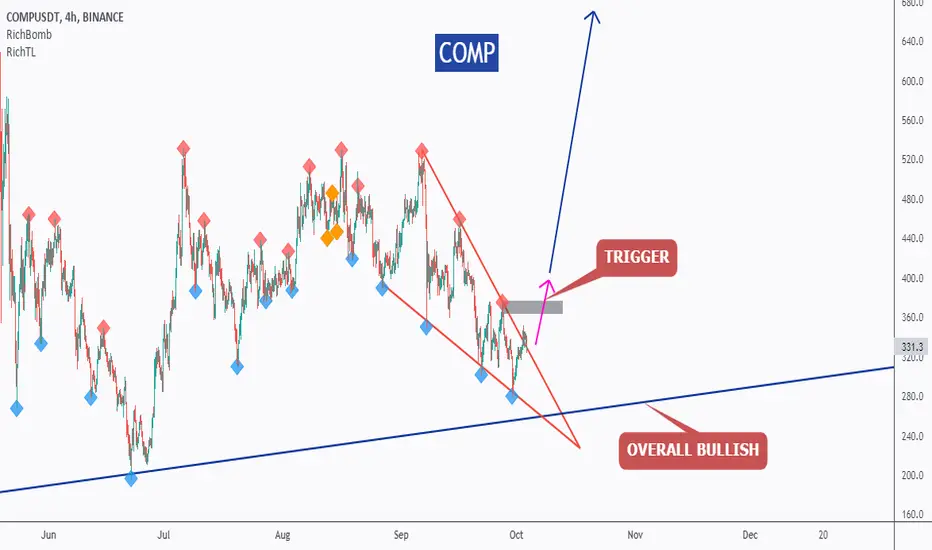
COMP - Wait For The Trigger!Hello everyone, if you like the idea, do not forget to support with a like and follow.
COMP is overall bullish and now approaching the blue trendline from Daily acting as a non-horizontal support, so we will be looking for buy setups.
on H4: COMP is formed a wedge pattern in red but it is not ready to go yet.
Before we buy, we want the bulls to take control.
Trigger => Waiting for a momentum candle close above the last swing high to buy (gray area)
Meanwhile, until the buy is activated, COMP would be overall bearish can still trade lower.
Good luck!
All Strategies Are Good; If Managed Properly!
~Rich

$550 Comp is incoming Comp is ready to breakout of the falling wedge. This will give massive gains to COMP hodlers. Get ready for solid profits 🚀

PATTERNThe wedge pattern is formed on the daily frame, waiting to break the pattern or after retesting. The price rebounded from a strong support area more than once. Good luck....

Comp Long SetupIt's pure price action and easy to understand.
Disclaimer: It's not a signal it's an idea, open positions by your own responsibility

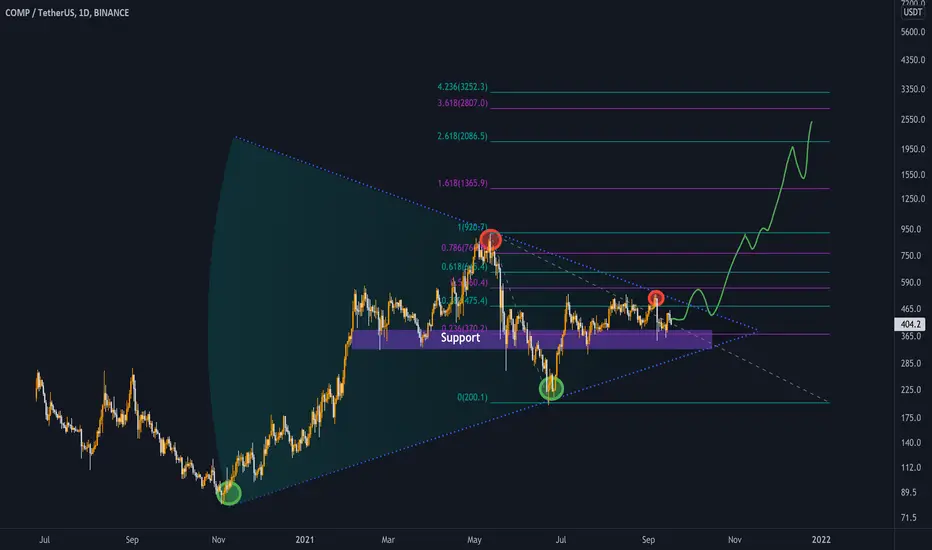
COMP could 50% pump from here , if this pattern break !Hello trader .
let's start with the daily chart :
before we talk about the details , i like to show you this similarity in the chart ; as you can see , previously COMP created this pattern and after break it , started to rise about 100% .
now we have similar pattern which called rising wedge , and if price could break it in my opinion could easily reach the target , which is the top of the wedge , but lets look at the 4H time frame for find more details :
as you can see this is very beautiful rising wedge , because we have so many touch points in the downward trend line , and at least 3 touch points at the upper trend line .
if you look at the RSI you can see clear bullish divergence between RSI and the price , in my opinion this is very good sign of the trend reversal , because we have rising wedge pattern above the weekly support , and now also can see bullish divergence .
if we zoom in a little bit , we can see price already break the upper resistance line and also break above the ema ribbon , with huge amount of volume , the only thing we need is that break above the previous rejection point , because for now it seems that COPM price have good signs of trend reversal ; but where is the potential price targets :
as you know the technical target of the rising wedge , is the top of the wedge , but we have some resistance area in the way to the up :
if we draw fib retracement tool , we can find resistance area , the first one which is very alignment with the daily structure (blue box) is at 0.382 . but you can take profit partially in the way to the up .
I hope you enjoyed this analysis.
Do not forget to like and subscribe
share my ideas with your friends , thanks for watching my ideas

#COMP breakout imminent #COMP
Possible opportunity key level flip.
Break of trendline will confirm long.

COMPUSDT Break out trend line!/Trading StrategyBYBIT:COMPUSDT
Notice in chart---Red: rise; Green: fall
1H trend chart
-
Price took out the long-term downtrend line, we consider it as a reversal signal.
Additionally, price stood firm on Fib(0.618)level which is 338.4
With both conditions, trading strategy as below.
-
Profit Targets:
a) 374.75----Fib(1)
b) 400.65~411.10----Fib(1.272~1.382)
c) 433.60-----Fib(1.618)
Stop losses:
a) 317.7----Green horizontal ray
-
Trading is a reflection of yourself, sometimes you need to take a step back to see more.
Learn more daily and Be ready for any opportunities daily.
Have a nice trading!

Q4 is here! Lets trade some ALTs! Here's a quick Look at COMP 8 hr chart. As we can see, the price has been forming a bigger falling wedge and we could see a break to the upside soon! Definitely one to keep an eye on. October is believed to be bullish according to S2F model and historically!
The best entry would be, when the price breaks above the falling wedge with good amount of volume .
-------------------------------------------
The idea is: Buy the breakout from the falling wedge and take profits at the levels shown in the chart.
Targets:
- Profits can be taken in the resistance zone .
1. 359$
2. 427$
3. 452$
-------------------------------------------
If you like the content, then make sure to comment and like the post :D
Follow me for daily profitable trading setups
BTC dictates the market. If BTC falls, then Alts will fall as well. Trade safe!

COMPUSDTA new low is expected to complete the ending diagonal, that would be the area not buy and forget until new all-time High.

🆓Compound (COMP) Sep-28 #COMP $COMPThe selling force on COMP is dominated so in next days, it could fall down sharply to 260$ from this 340$ zone. The 260$ zone is quite reliable to start a new rally up to 340$, 420$ and 520$ zone or even higher in October.
📈RED PLAN
♻️Condition : If 1-Day NOT closes ABOVE 2.2$ zone
🔴Sell : 340$
🔴Buy : 260$
🔴Sell : 340$ - 420$ - 520$
📉BLUE PLAN
♻️Condition : If 1-Day closes ABOVE 2.2$ zone
🔵Buy : 340$
🔵Sell : 420$ - 520$
❓Details
🚫Stoploss for Long : 10%
🚫Stoploss for Short : 5%
📈Red Arrow : Main Direction as RED PLAN
📉Blue Arrow : Back-Up Direction as BLUE PLAN
🟩Green zone : Support zone as BUY section
🟥Red zone : Resistance zone as SELL section
🅰️A : The Close price of 1-day candlestick is Above the zone
🅱️B : The Close price of 1-day candlestick is Below the zone

Compusdt Daily RangeCompusdt has been ranging since July and its just beatiful. The tick which is on the RL is also perfectly aligned with the expansion moves OTE . This is my swing coin
Entry: 309,59
tp1:419,64
tp2:529,69
tp3 go crazy 610 LGEQ

COMP watch for breakoutCOMP watch for breakout !
This one is almost behind the market.
Theta, Hbar and XRP are the other behind cryptos!

COMPUSDTTook a long position on COMP, three targets are indicated. Deviation below the formed low indicates upcoming expansion.

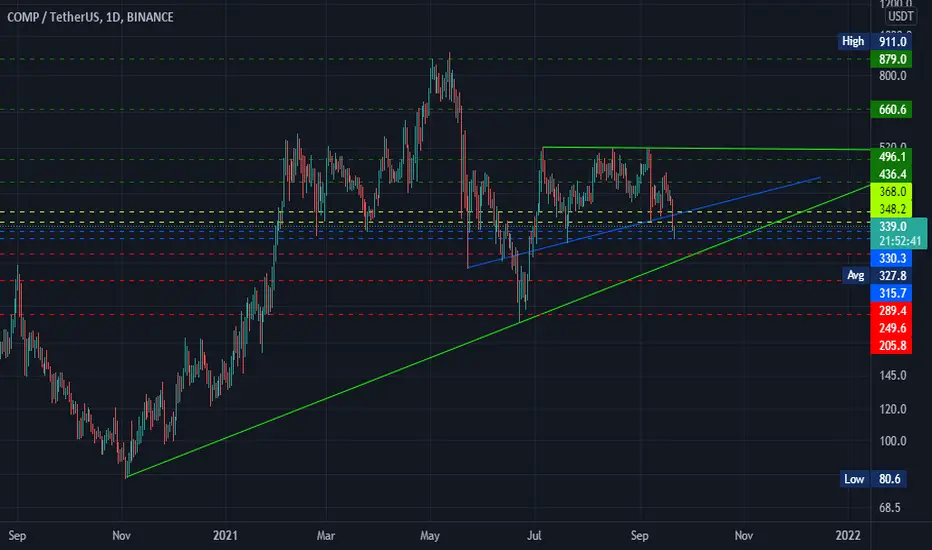
COMPUsdt UpdateAfter this last fall, now is a good opportunity for those who have been left out of this year's Bullmarket to enter the second part and overcome a good barrier. After the dominance goes up and Bitcoin starts the main move, which will probably be next week, it will start little by little.
GL
EntryPoint:
330.3
315.7
Supports:
289.4
249.6
Resistance;
348.2
368.0
Targets:
436.4
496.1
660.6
879.0
For Mid time:
1321.8
For HODL:
2220.0
GL
Rememebr after this fall bTC Fast come back on 3 day can x2or x3 back up
Dont miss market
COMP/USDT Inverse H&S COMP/USDT has shown volatile movement during April.
The chart pattern can be thought as ascending wedge which is a bearish pattern,
but I bet this is inverse head and shoulder pattern, which is a bullish pattern.
1) The price is above the resistance line, and the price is staying above the line.
2) Whenever the price touched neckline, (red dotted line) There was volume increase,
which confirms that the resistance line is very important in the pattern.
3) MACD (4h) made golden cross, which means that it will be bullish in short term,
and also means that the price is staying at the stable price.
4) There is one more "shoulder" part, which was shown in 27 Apr '21. It is extended shoulder part
because of BTC crash in 27 Apr '21. It could not complete the pattern in 27 Apr '21.
5) Stoch RSI is also showing that the price can still go up further, which also confirms that the movement is still bullish.
Therefore I think COMP/USDT will go further.
Target point is shown in the chart, in green numbers(Fibo levels)
Trade at your own risk.
XOXO.

Compound DEFI FALL SEASON!chart looks ready to explode to the upside. Similar structure to $CRV (we have already seen what that one has done). A RETURN OF DEFI will happen this Fall!
I hope you found the idea interesting;)
COMPLonged here and if I find a dip chance I will add , I will risk free at 470$ and my TP IS between 470$-510$
