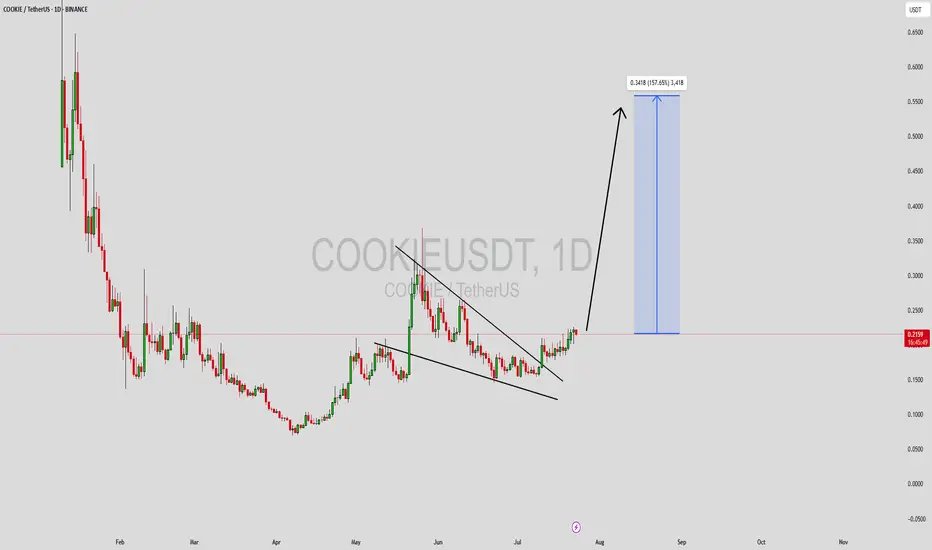
COOKIEUSDT Forming Falling WedgeCOOKIEUSDT has recently broken out from a bullish falling wedge pattern on the daily chart, a formation that typically signals a trend reversal and strong upward momentum. The wedge formed after a long consolidation and price compression, which usually results in a breakout supported by increased volume—and that’s exactly what we’re seeing. This breakout now opens the path for a potential move toward a 140% to 150% gain in the near-to-mid term.
The falling wedge breakout is accompanied by rising buying volume, which validates the pattern and confirms growing market interest in COOKIE. Price action has flipped from lower lows to forming higher highs, a technical shift that’s often the early phase of a parabolic move. COOKIEUSDT has established a solid support base, making this breakout structure more reliable for bullish continuation.
Investor sentiment around COOKIE has also been turning positive. With increased attention across crypto communities and favorable positioning on Binance, COOKIE is beginning to draw speculative momentum. The risk-reward ratio remains attractive at current levels, especially considering the technical setup and expected target levels projected around the $0.55–$0.60 zone.
Traders should keep an eye on short-term resistance zones for potential pullbacks and re-entry opportunities. As long as the breakout holds and volume remains strong, COOKIEUSDT could become one of the top-performing mid-cap altcoins in this cycle.
✅ Show your support by hitting the like button and
✅ Leaving a comment below! (What is You opinion about this Coin)
Your feedback and engagement keep me inspired to share more insightful market analysis with you!
COOKIEUSDT trade ideas
COOKIE/USDT on the Verge of a Breakout? Descending Triangle
📊 Complete Technical Analysis
COOKIE/USDT has been forming a classic Descending Triangle since February 2025, indicating prolonged market consolidation. Sellers have been pushing the price down gradually (lower highs), but buyers have strongly defended the horizontal support around $0.16–$0.18.
Now, the price is testing the upper boundary of this structure, signaling a potential explosive breakout.
🔍 Pattern Breakdown
Pattern Name: Descending Triangle
Key Traits:
Lower highs compressing price action
Strong horizontal support zone holding steady
Typically a continuation pattern, but in this case, it can act as a reversal signal if breakout occurs to the upside
Formation Duration: ±6 months
Breakout Confirmation: A daily candle close above ~$0.22 with strong bullish volume
🚀 Bullish Scenario (Upside Breakout)
If COOKIE/USDT successfully breaks above the triangle resistance, here are the potential bullish targets:
Target Price Reason
🎯 Target 1 $0.259 Local resistance zone
🎯 Target 2 $0.299 Key breakout confirmation
🎯 Target 3 $0.407 Measured move from triangle height
🎯 Target 4 $0.626 – $0.700 Historical resistance range
🏁 Final Target $0.842 (ATH Zone) If bullish sentiment fuels momentum
✅ Volume confirmation is crucial. A breakout without strong volume might signal a fakeout.
🛑 Bearish Scenario (Rejection or Breakdown)
On the flip side:
❌ If the price fails to break the triangle resistance (~$0.22) and gets rejected again, we could see a retest of:
Support zone around $0.18
A breakdown below this level could drive the price toward:
$0.140
$0.120
Possibly as low as $0.095 – $0.075 if sentiment worsens
❗ Be cautious of fake breakouts or bear traps near key levels.
📚 Summary & Insights
> The current descending triangle is a textbook setup of “compression under pressure.” If the structure breaks upward with conviction, COOKIE/USDT may enter a powerful bullish trend after months of consolidation.
This setup is ideal for swing traders, breakout traders, or early trend investors seeking solid entries before momentum accelerates.
#COOKIEUSDT #CryptoBreakout #DescendingTriangle #AltcoinAnalysis #BullishReversal #TechnicalAnalysis #TradingView #CryptoTA #AltcoinSetup #ChartPattern

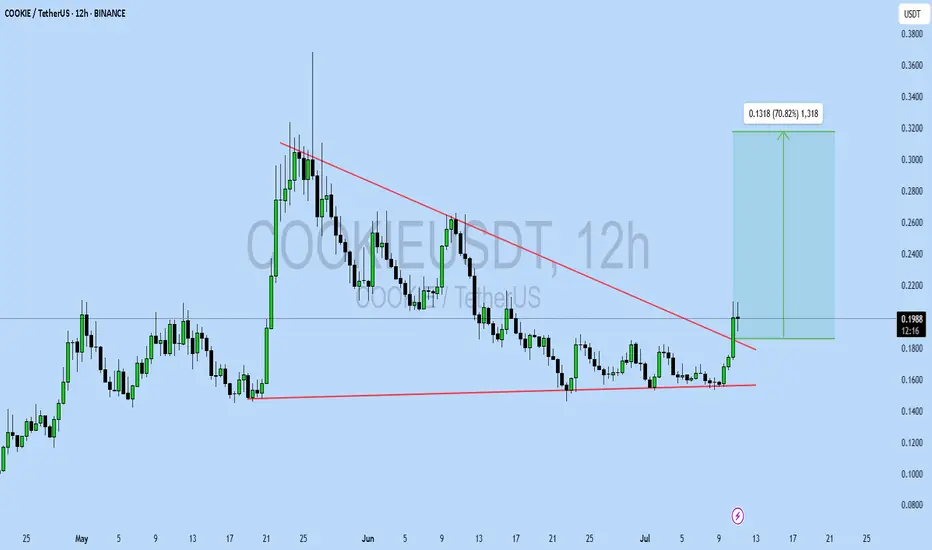
COOKIEUSDT UPDATE
Pattern: Falling Wedge Breakout
Current Price: \$0.1996
Target Price: \$0.32
Target % Gain: 70.82%
Technical Analysis: COOKIE has broken out of a falling wedge pattern on the 12H chart, supported by a strong volume surge. The breakout is confirmed with a close above the trendline, indicating bullish momentum.
Time Frame: 12H
Swing Trading Plan For COOKIEUSDTBINANCE:COOKIEUSDT
📄 Trading Idea
💵 Currency $COOKIE
📄 This path is considered positive and forms a Falling Wedge pattern
⭕️ Entry points for this currency: current price 0.1640 and at 0.1329 - 0.1007 at the same size if it experiences a drop
◀️ This is the main support range for the currency to maintain a positive structure. Caution and attention should be given to a break below 0.10
🔼 The main target for this pattern is to rise towards the range of 0.3328 - 0.4044, which is a doubling in the market value of COOKIE currency
🚨 The pattern fails with a break below 0.0703 and is considered distant, so you should calculate the size of your trade correctly before entering and use this analysis

Bearish opportunityThere is a H&S pattern that is currently in play, the sell movent has already started but its still in its initial stages.
A sell position current with a stop loss slitely above 0.1875 and a take profit at 0.00712 would be most ideal.
A conservative trader can go with the most recent structure which would be a continous bearish pattern,if and only if you wait for a retest or volume to the down side and enter then but with a bigger stop loss.

Cookieusdt trading opportunityCOOKIEUSDT has broken down from its rising channel and is now heading toward a potential reversal zone. If price finds support and reacts positively from this area, a move toward the important supply zone is expected. A confirmed breakout above this supply zone would open the path toward the projected final target, as outlined on the chart.

COOKIE Failed to Hold $0.20 ! What's Next ?BYBIT:COOKIEUSDT bounce attempt fizzled, and price broke lower below $0.2 — now heading toward the $0.14 support zone, with Fibonacci extension at $0.10 in sight.
Will bulls defend the April low and spark a fresh rally from here? Eyes on the reaction.

COOKIE Holds Above $0.2—What’s Next?📊 BINANCE:COOKIEUSDT has bounced off the support area at $0.2, signaling the start of a potential upside move that could take it toward $0.5.
🚀 Will momentum carry it higher, or is another test of support coming first?

Potential Bullish MoveA buy position is ripe. A clear retest has happened and it is just a matter of time before price shoots upwards.

COOKIE/USDT H&S +100d Accumulation COOKIE has broken out of a 100-day accumulation range with strong buy volume stepping in. The $0.20 level continues to act as strong support, holding firmly through recent price action.
Additionally, price has formed a clear and well-defined Inverse Head and Shoulders pattern, now targeting the completion of this bullish structure — a textbook signal of a potential trend reversal.
Take Profit Levels:
TP1: $0.30
TP2: $0.39
TP3: $0.50
Stop Loss: $0.198
Pattern confirmation + volume surge = strong potential for follow-through.

Could $COOKIEUSDT be heading to $0.60??BINANCE:COOKIEUSDT has been retracing for a while following massive bullish rally the previous month. It seems to have broken out of a bearish trendline after retesting a support zone twice and also putting a bullish divergence in the process. So lookout for a move to about $0.60
Be on the look out and expect minor retracements while at it, as there are some support and resistance zones it can bounce off from. These zones are already marked out in the setup.
Kindly support this analysis to enable it reach to other people, and do comment your thoughts.

Cookie Eyes Reversal as Key Support HoldsAfter a recent correction, Cookie (COOKIE) is showing signs of strength at a key technical level. This region—backed by multiple indicators—has acted as a solid support base, allowing for a potential trend reversal. If price can hold this zone in the coming days, it opens the door for a bullish breakout, with targets set at $0.25 and then $0.30.
Detailed Analysis:
Cookie recently pulled back into a crucial technical zone that combines the daily horizontal support, the 200 MA, and the golden pocket of the recent move—the 0.618 Fibonacci level. This region has so far acted as a springboard, with price action beginning to base out and show signs of accumulation.
From a structure perspective, this could mark the beginning of a higher low formation—an early signal that bulls are defending this level. While volume remains moderate, the lack of a breakdown from this zone suggests selling pressure may be waning.
A clean hold above this support base would set the stage for a bullish expansion phase. The first upside target lies around $0.25, where prior resistance sits. A reclaim and flip of that level could lead to a continued rally toward the psychological and technical resistance at $0.30.
If Cookie maintains support and breaks short-term resistance with volume confirmation, the probability of a move to $0.25 and then $0.30 increases significantly. However, losing this support could invalidate the bullish outlook and lead to further consolidation.

Cookie the AI alpha seeker.Cookie is a very interesting application. Like Coingecko for AI Crypto projects. I am seeing other platforms build their insights into their websites. A change in regulatory environment has allowed AI projects to come out in a way that has not been seen since ICO era. What has changed is it become viable to publicly fund projects again without fear of regulators. As regulatory bodies in the US like the SEC, seen as hostile to crypto last year are now much more friendly. At #382 on CoinGecko this project is still relatively small. People who want to find and buy AI projects definitely want Cookie as a data source.
The chart is beautiful for Long positions. You have very clean trend of higher highs and higher lows. While riding on the moving averages. I am using 8 SMA, 21 EMA, 34 EMA, 50 SMA, and 200 SMA. With a previous price low around 15 cents, the price needs to remain above that level.
MACD is moving up consistently with the price action. I am not seeing anything concerning here. As I am interested in day and week trends not intraday trades.
With a previous high of 78, there is still a lot of room to work with.
Looks like this could be just the start of this move.
Disclaimer: The information provided in this post is for educational and informational purposes only. It does not constitute financial advice, investment recommendations, or a solicitation to buy or sell any financial instruments. All investments involve risk, and the past performance of a security, market, or trading strategy does not guarantee future results. I am not a financial advisor. Please conduct your own thorough research and consult with a qualified financial professional before making any investment decisions. You are solely responsible for any investment decisions you make.

Head and ShoulderPrice moved in a very unclear manner and eventually showed its true nature by dropping slitely after forming the second shoulder.
The excepted move is a sell all the way down to the end of the lowest point of the structure.

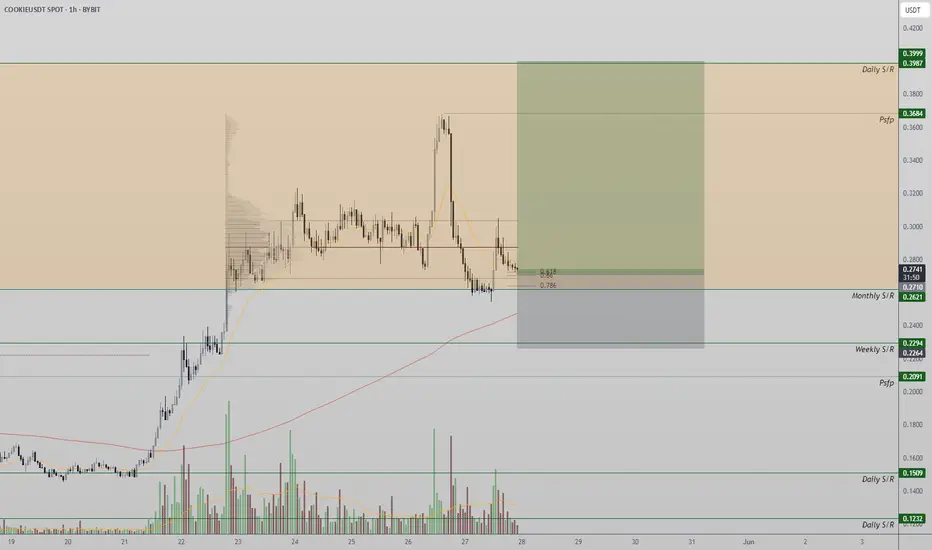
COOKIE Retests Key Support Zone – Eyes on $0.38 ReboundAfter a sharp corrective move, COOKIE is back at a key support level. With multiple layers of confluence lining up, price action remains bullish — and a bounce toward $0.38 is in play.
Key Highlights:
Support Zone: Confluence of 0.618 Fibonacci, monthly support, and major moving average
Current Structure: Healthy correction following rejection near high time frame resistance
Upside Target: $0.38 resistance remains the key level to reclaim
Full Analysis:
COOKIE has pulled back from its recent rally after failing to break through the high time frame resistance near the $0.38 level. However, this retracement has landed price action right into a technical demand zone — combining the 0.618 Fibonacci retracement, the monthly support level, and a long-term moving average. This multi-layered support structure creates a strong foundation for a potential reversal.
Despite the corrective move, the broader trend remains bullish. The rejection at $0.38 did not break any structural higher lows, and volatility in this zone is not uncommon in trending markets. As long as price holds above this confluence zone, COOKIE maintains its upside structure, and the probability of a retest of the $0.38 resistance grows stronger.
Volatility is expected in this phase of the move, but it should be viewed within the context of a bullish continuation pattern. Confirmation of support holding — such as bullish engulfing candles or volume uptick — would further validate a reversal scenario.
Cookie DAO price analysis😠 Those who like high-risk trading can take a closer look at #Cookie
📈 If buyers manage to keep the price of OKX:COOKIEUSDT.P above $0.25, then the chance for another powerful upward momentum will be very, very high.
📉 If the #CookieDAO price is fixed below $0.25, it may indicate that a corrective movement is starting, which, according to the red scenario, could be quite deep.
_____________________
Did you like our analysis? Leave a comment, like, and follow to get more

#COOKIEUSDT maintains bearish momentum📉 SHORT BYBIT:COOKIEUSDT.P from $0.2787
🛡 Stop loss: $0.2925
🕒 Timeframe: 4H
✅ Market Overview:
➡️ A Rising Wedge pattern has formed and broken down, confirming bearish momentum.
➡️ Price has broken below the wedge and the POC level at $0.2976, turning it into resistance.
➡️ Strong volume cluster at $0.2976–$0.2925 is now likely to act as a rejection zone.
➡️ Bearish pressure is visible through high-volume red candles.
➡️ Arrows on the chart indicate a continuation toward the take-profit levels.
🎯 TP Targets:
💎 TP 1: $0.2660
💎 TP 2: $0.2515
💎 TP 3: $0.2395
📢 Watch how price reacts BYBIT:COOKIEUSDT.P to TP1 — weak bounce may signal room for deeper drop.
🚀 BYBIT:COOKIEUSDT.P maintains bearish momentum — further downside expected!

COOKIE Looks Bullish (1D)We have a good setup on the chart. A bullish CH has formed, the trigger line has been broken, and the price is currently sitting on a support level.
The green zone has been tested twice and rejected, which has strengthened the bullish outlook for this asset.
The main supply zone is marked in red. It is expected that, with price fluctuations, the asset will reach the red zone in the coming days or weeks.
A daily candle closing below the invalidation level would invalidate this analysis.
For risk management, please don't forget stop loss and capital management
Comment if you have any questions
Thank You

COOKIE | C&H PatternThis chart for COOKIE/USDT (4-hour timeframe) showcases a clear and well-formed cup and handle pattern, a classic bullish continuation signal. The rounded bottom indicates a strong accumulation phase, followed by a brief consolidation forming the handle. The breakout from the handle suggests bullish momentum, with a projected target of $0.56, representing a potential 180% upside from the current price near $0.1867. This technical setup reflects strong market confidence and offers an attractive risk-to-reward opportunity for traders anticipating a sustained upward move.


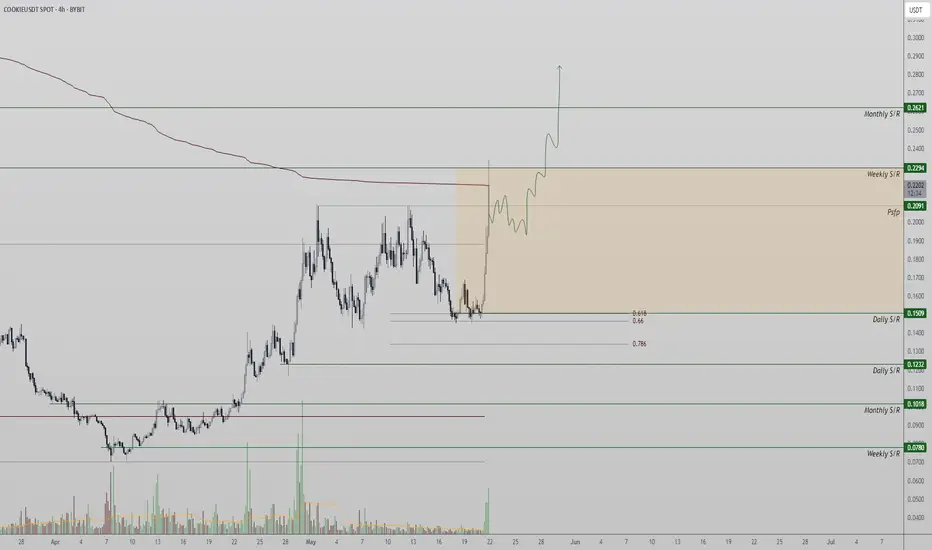
Bullish Trend Forming After Key Fibonacci Rebound
Cookie has shown an impressive reaction off the $0.15 support level, which also aligns with the 0.618 Fibonacci retracement — a textbook area for bullish continuation in trending markets. This confluence of support not only held price but triggered a strong bullish impulse, suggesting renewed interest and accumulation at this key technical zone.
Following this bounce, Cookie is now approaching a crucial test: the VWAP resistance and a well-defined daily horizontal level. Price is currently backtesting this resistance area. While this could act as a barrier in the short term, a rejection here wouldn’t necessarily be bearish. In fact, a minor pullback from this zone could be considered a bullish correction, giving Cookie room to form a higher low — a key requirement for establishing a healthy uptrend.
It’s important for Cookie to maintain support above $0.15 and ideally form a consolidation range between the current level and the recent local high. This would signal strong market structure and allow momentum to build for the next leg higher.
The current price action shows early signs of a larger bullish trend in development. If Cookie manages to hold the current support and break above the VWAP and daily resistance, it could open the door for an extended rally toward previous highs and beyond.
Cookie is currently in a bullish phase, with clear technical confluence backing its recent bounce. A healthy correction here would reinforce the trend. Traders should watch for consolidation above $0.15 and a potential breakout above VWAP in the days ahead.
COOKIE/USDT Short Setup Loading - High-Probability DropPrice recently pumped into a premium zone and gave us a clear Change of Character (ChoCh) — a classic signal that momentum is shifting from bullish to bearish. Now, we’re seeing a pullback into the 0.5–0.618 Fibonacci retracement zone, which often acts as a key area for entries.
📍 Trade Plan
Entry: 0.182 USDT
Stop-Loss: 0.191 USDT (above recent high / invalidation point)
Target: 0.173 - 0.1657 - 0.153
🔎 Why This Setup Stands Out:
✅ ChoCh Confirmed – Momentum has shifted, suggesting the bulls are losing control.
✅ Fibonacci Confluence – Price is pulling back right into the golden zone (0.5–0.618), offering a textbook short entry.
✅ Clean Risk/Reward – With a tight stop and a defined target, the setup offers solid R:R potential.
💭 Final Thought:
Now it’s all about confirmation. If we see a solid rejection in the zone, this setup could play out with strength. Patience is key — let the market come to you.

COOKIE Buy/Long Setup (4H)Looking at the chart, we can identify bullish signs for COOKIE.
On the CH chart, we see a bullish structure along with the clearing of resistance zones. There’s also a liquidity pool above the chart which is expected to be swept soon.
The only remaining resistance order block on the chart is the marked supply zone, which could potentially also be taken out.
As long as the demand zone holds, we expect a move toward the targets.
A daily candle close below the invalidation level would invalidate this analysis.
Do not enter the position without capital management and stop setting
Comment if you have any questions
thank you
