Copper Bearish Crab Pattern
In 2024, copper prices have exhibited notable fluctuations, driven by macroeconomic trends, industrial demand, and supply constraints.
Key Fibonacci retracement levels have played a crucial role in shaping market movements. With the 0% level at $3.96, the 23.6% retracement at $4.11 acted as an initial support, while the 38.2% level at $4.225 provided stronger stability.
The 50% retracement at $4.28 served as a key equilibrium zone, with the 61.8% level at $4.361 marking a critical support for potential reversals.
According to the harmonic Crab pattern , the 161.8% Fibonacci extension near $5.00 is expected to act as a major resistance. If the price reaches this level, a sharp bearish reversal is likely due to overbought conditions. A rejection at this resistance could drive prices down toward the support zones, completing the harmonic correction phase.
However, a breakout above $5.00 could invalidate this scenario and lead to further bullish momentum.
If you like this trading idea and want to stay updated with the next one, please give it a thumbs up and follow along! Your support means a lot, and I’m excited to share more insights with you. Let’s embark on this journey together!
SEYED.
COPPER trade ideas

CopperXCUUSD
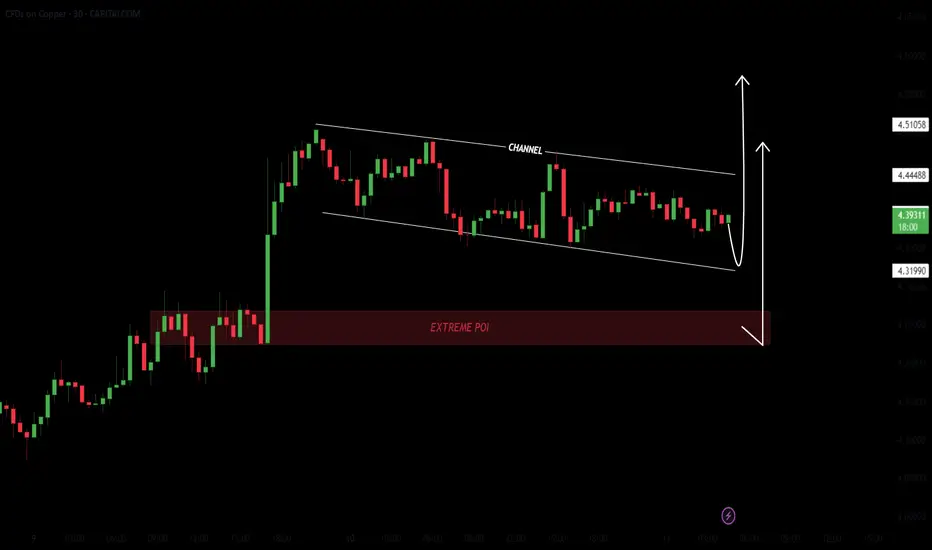
- Bearish Channel as an corrective pattern in short time frame
- Break of Structure
- Consolidation Phase
- Extreme Poi
- Impulse Correction
High Risk, High Reward: Shorting ATH in a Bullish Copper Market.Copper just broke above its all-time high, triggering my short entry at 5.3010. While the macro trend is undeniably bullish, past price action has shown that each major high was followed by aggressive selloffs. This might not be the case this time – but that’s exactly why we have a stop-loss in place.
This is a tactical counter-trade: not about fighting the trend but playing a potential rejection from a psychological and technical key zone. Let’s see if history rhymes or the red metal keeps melting resistance!
Technicals:
• Daily timeframe breakout above ATH triggered the short at 5.3010.
• Strong vertical rally into major supply – parabolic move often cools down.
• Previous ATH levels have consistently attracted heavy selling.
• If price invalidates with a continuation above 5.61, the setup is out.
• Volatility around this zone is expected – precision and SL management are key.
Fundamentals:
1. Trump’s Proposed Copper Tariffs:
• Tariffs of up to 25% could disrupt global trade flow and introduce price instability.
• Market already priced in a bullish narrative, so any delay or uncertainty could spark a correction.
2. Panama’s Cobre Mine Shutdown:
• The mine accounts for 1% of global supply, and uncertainty around reopening may already be priced in.
• The government is holding off public visits, which adds operational risk but no clear bullish resolution yet.
3. China Smelter Closures:
• While bullish in nature, these are known factors – any shift or reversal from China could cool the demand-side speculation.
4. Overbought Sentiment:
• Prices surged rapidly, creating a gap between LME and NY copper prices, reaching record spreads.
• Speculative exhaustion could trigger a short-term pullback or deeper correction.
Risk-Managed Play. Let’s see if this time is different – or just the same old Copper story in a new macro wrapper.
Note: Please remember to adjust this trade idea according to your individual trading conditions, including position size, broker-specific price variations, and any relevant external factors. Every trader’s situation is unique, so it’s crucial to tailor your approach to your own risk tolerance and market environment.

CopperXCUUSD
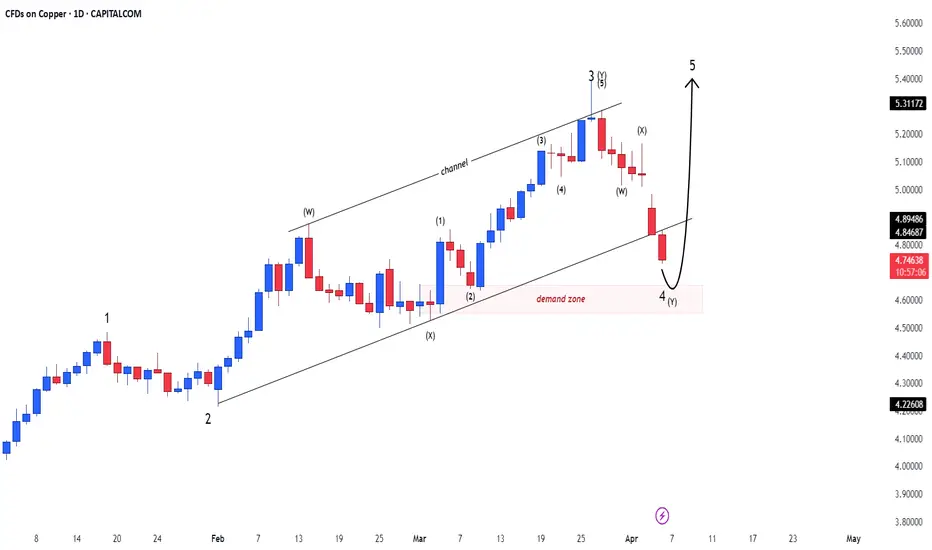
- Demand Zone
- Change of Characteristics
- Bullish Channel as an Corrective Pattern in Short Time Frame
- FVG
- Completed " 123 " Impulsive Waves
Bearish drop?COPPER is reacting off the resistance level which is an overlap resistance that lines up with the 23.6% Fibonacci retracement and could drop from this level to our take profit.
Entry: 5.0325
Why we like it:
There is an overlap resistance level that aligns with the 23.6% Fibonacci retracement.
Stop loss: 5.1220
Why we lik eit:
There is a pullback resistance levle that line sup with the 50% Fibonacci retracement.
Take profit: 4.8933
Why we like it:
There is a pullback support level that is slightly above the 61.8% Fibonacci retracement.
Enjoying your TradingView experience? Review us!
Please be advised that the information presented on TradingView is provided to Vantage (‘Vantage Global Limited’, ‘we’) by a third-party provider (‘Everest Fortune Group’). Please be reminded that you are solely responsible for the trading decisions on your account. There is a very high degree of risk involved in trading. Any information and/or content is intended entirely for research, educational and informational purposes only and does not constitute investment or consultation advice or investment strategy. The information is not tailored to the investment needs of any specific person and therefore does not involve a consideration of any of the investment objectives, financial situation or needs of any viewer that may receive it. Kindly also note that past performance is not a reliable indicator of future results. Actual results may differ materially from those anticipated in forward-looking or past performance statements. We assume no liability as to the accuracy or completeness of any of the information and/or content provided herein and the Company cannot be held responsible for any omission, mistake nor for any loss or damage including without limitation to any loss of profit which may arise from reliance on any information supplied by Everest Fortune Group.

Copper Preparing up for a BIG MoveCAPITALCOM:COPPER Weekly Chart Analysis 📈
Current Price: $5.05(-1.43%)
🎯 Key Levels:
Support Levels: $5.00 (Major), $4.92 (Next support)
Resistance Levels: $5.50 (Next major target)
📊 Trend & Market Structure
Breakout Confirmed: Price has broken above previous resistance (~$5.00) and is sustaining.
Retest in Progress: Currently testing support at $5.00-$4.92.
💡Trade Plan 📝
Bullish Setup (Buy on Retest) ✅
Entry: $5.00 - $4.92 (Support retest)
Stop-Loss: $4.85 (Below support break)
Target: $5.50 and $6.50

Copper continues to 6$Things only the Wizard will show you...
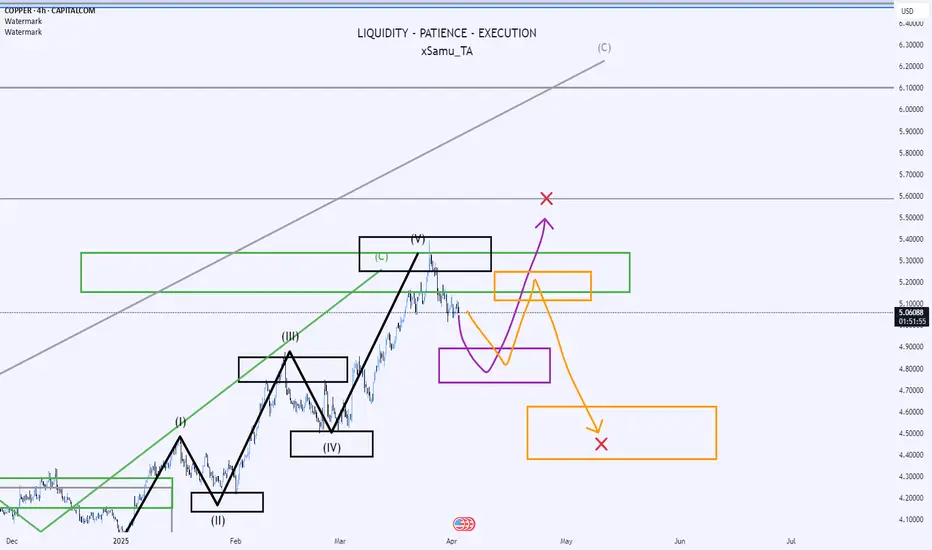
But what does it mean?
Right now, we’ve got two possible targets on the board—and here’s the key: the market has full legitimacy to go for either. Both the bullish and bearish scenarios are in play, but in the grand scheme of things, it really doesn’t matter.
Look left—Copper was riding an overarching green structure, hitting its target through multiple corrections. That gave us four clean trade entries during wave C alone. A similar setup is unfolding here.
While the green structure is now complete, there’s still an even larger bullish structure in gray, and guess what? Its resistance line hasn’t even been touched yet.
So for the long-term investors: rest easy—Copper is headed for $6, sooner or later.
And on the way? There’ll be plenty of high-probability leverage plays for those who stay sharp.
Will it be purple or orange? Doesn’t matter yet.
I’ll observe. I’ll adapt. I’ll strike.
Stay focused. Don’t let big money fool you.
Copper Set to Rally: Bullish Setup with Massive Upside PotentialCopper is holding firmly at a key support level and poised for a potential breakout. The combination of bullish macroeconomic factors and tightening supply suggests significant upside potential.
China’s Growth Push:
Chinese leaders are targeting 5% annual growth in 2025, with plans to boost domestic consumption and infrastructure spending, key drivers of copper demand.
Robust Demand Drivers:
Industries like EVs, power grids, and air conditioning continue to drive structural demand for copper, aligning with the global shift toward electrification and renewable energy.
Supply Challenges:
Multi-month low inventories in Shanghai warehouses signal tight supply conditions.
Peru’s flat output and Chinese smelter profitability issues add further pressure to global supply.
With these factors converging, copper prices are primed for a bullish move from current levels.
Trade Setup
TP1: $4.3498
TP2: $4.6347
TP3: $5.000
Stop Loss: $3.8622
This trade setup offers an excellent risk-to-reward ratio, with tightening supply and robust demand creating a solid foundation for bullish momentum.

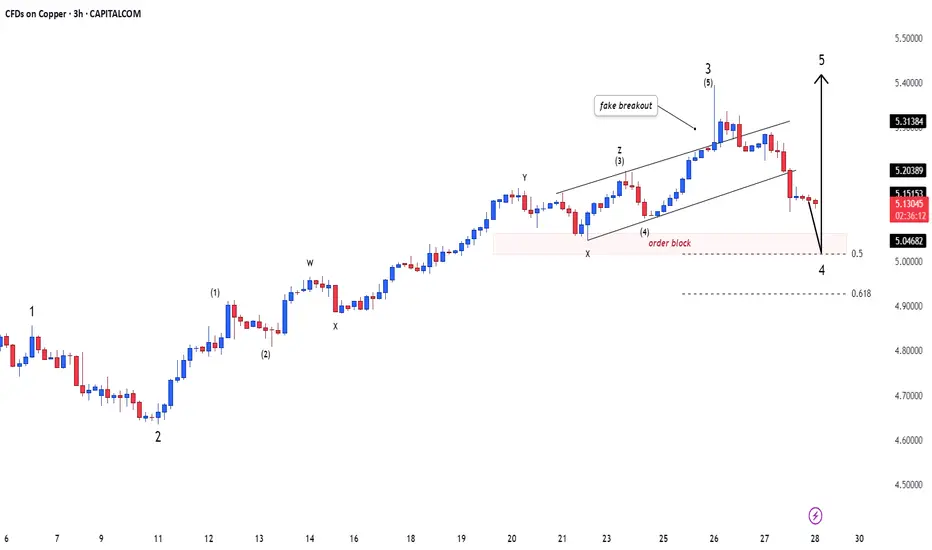
CopperXCUUSD
- Completed " 1234 " Impulsive Waves
- Break of Structure
- Demand Zone
- Fibonacci Level - 50.00% / 61.80%
- Rising Wedge in Short Time Frame
COPPER Technical Analysis📊 COPPER (1D) Technical Analysis 📊
🔹 Trend Overview:
Copper is in a strong uptrend, testing a key resistance level. A breakout or rejection here will determine the next move.
🔹 Key Levels:
📈 Resistance: 5.393 – A breakout above this level could send price higher.
📉 Support: 5.098 – If broken, price may drop to 4.832.
🔹 Market Structure:
🚀 Bullish scenario: Rejection/hold of 5.098 & we might see price back to 5.3967 → Break & Retest → Target higher levels.
⚠️ Bearish scenario: Break of 5.098 → Drop to 4.832 → Further decline if broken.
🔹 Trade Idea:
Bullish above 5.09840 & 5.393, targeting new highs.
Bearish below 5.09840.
📌 Risk Management: Wait for confirmation of breakout or rejection before entering trades.

Copper - Can we cross the ATH and look further?Our analysis over copper, the prices have experienced a significant upward trend, influenced by a combination of policy decisions, supply dynamics, and market speculation.
Current Price Levels:
London Metal Exchange (LME): Copper prices have surpassed $10,000 per tonne, marking a five-month high.
New York Comex: Prices have exceeded $11,000 per tonne, reflecting a 27% increase since the beginning of the year.
Factors Driving the Price Increase:
U.S. Trade Policies and Tariff Speculations:
President Donald Trump's administration is considering imposing tariffs on copper imports to bolster domestic production. This has led to a surge in imports, with approximately 500,000 tons of copper en route to the U.S., significantly higher than the typical monthly import volume of 70,000 tons.
Supply Concerns:
The potential tariffs have prompted stockpiling, leading to concerns about a global supply shortage. This situation is exacerbated by low processing fees and an oversupply of smelting capacity in China, which pressures non-Chinese smelters.
Market Speculation:
Anticipation of tariffs and supply constraints has fueled speculative trading, contributing to the rapid price escalation.
Market Outlook:
While the current trajectory points towards sustained high prices, several factors could influence future movements:
Global Economic Conditions: A slowdown in major economies, particularly China, could dampen demand and exert downward pressure on prices.
Trade Policy Developments: The implementation and extent of U.S. tariffs on copper imports will significantly impact market dynamics.
Supply Chain Adjustments: Producers and consumers may seek alternative strategies to mitigate tariff impacts, such as sourcing from different regions or investing in domestic production capabilities.
Conclusion:
Copper prices are currently on an upward trajectory, driven by U.S. trade policy considerations, supply concerns, and market speculation. Stakeholders should closely monitor policy developments and global economic indicators to navigate this volatile market effectively.
We would look for a further increase in the prices of Copper -
Entry: 5.19
Target: 5.50
SL: 4.70 - We would look this as a mid term opportunity which would give us the freedom to look for no stop loss / diverse overview of Risk Management, hence at the moment there is no indication of President Trump stoping with his tariffs plan, which can give a continues push to the prices of Copper.

XCU/USD "The Copper" Metals Market Heist Plan🌟Hi! Hola! Ola! Bonjour! Hallo! Marhaba!🌟
Dear Money Makers & Robbers, 🤑 💰💸✈️
Based on 🔥Thief Trading style technical and fundamental analysis🔥, here is our master plan to heist the XCU/USD "The Copper" Metals market. Please adhere to the strategy I've outlined in the chart, which emphasizes long entry. Our aim is the high-risk Red Zone. Risky level, overbought market, consolidation, trend reversal, trap at the level where traders and bearish robbers are stronger. 🏆💸Book Profits Be wealthy and safe trade.💪🏆🎉
Entry 📈 : "The vault is wide open! Swipe the Bullish loot at any price - the heist is on!
however I advise to Place buy limit orders within a 15 or 30 minute timeframe most recent or swing, low or high level. I Highly recommended you to put alert in your chart.
Stop Loss 🛑:
Thief SL placed at the recent / nearest low level Using the 4H timeframe (9500) swing trade basis.
SL is based on your risk of the trade, lot size and how many multiple orders you have to take.
Target 🎯: 10050 (or) Escape Before the Target
🧲Scalpers, take note 👀 : only scalp on the Long side. If you have a lot of money, you can go straight away; if not, you can join swing traders and carry out the robbery plan. Use trailing SL to safeguard your money 💰.
📰🗞️Read the Fundamental, Macro Economics, COT Report, Seasonal Factors, Intermarket Analysis, Sentimental Outlook:
XCU/USD "The Copper" Metals Market is currently experiencing a bullish trend,., driven by several key factors.
⭐Fundamental Analysis⭐
Overview: Fundamental analysis of XCU/USD involves evaluating the intrinsic value of copper based on economic, industrial, and external influences. At $9.70/lb, copper is at an unusually high level, suggesting strong demand, supply constraints, or external pressures.
Economic Growth: Copper is a key industrial metal tied to global GDP growth, particularly in manufacturing, construction, and electrification (e.g., EVs, renewable energy). A price of $9.70 could reflect robust economic expansion, especially in emerging markets like China and India.
Inflation and Currency: High inflation in 2025 could weaken the USD, pushing commodity prices like copper higher. Alternatively, a strong USD might temper this rise unless offset by other factors.
Industrial Demand: Increased demand from green energy (e.g., solar, wind, EVs) and infrastructure projects could justify this price.
Supply Constraints: Disruptions in major copper-producing countries (e.g., Chile, Peru) or reduced mining output could tighten supply, driving prices up.
⭐Macroeconomic Factors⭐
Interest Rates: If the Federal Reserve maintains high rates in 2025 to combat lingering inflation, this could strengthen the USD, typically pressuring commodity prices downward. However, at $9.70, demand might outweigh this effect.
Global Growth: Strong GDP growth in China (a top copper consumer) or a global infrastructure boom (e.g., post-2024 recovery) could support high prices. Conversely, a recession would cap upside potential.
Inflation: Persistent inflation in 2025 could make copper a hedge, boosting prices. A cooling inflation trend might signal a peak.
USD Strength: A weaker USD (e.g., due to Fed rate cuts) would naturally lift XCU/USD, while a stronger USD could challenge the $9.70 level unless supply/demand dynamics dominate.
⭐Geopolitical Factors⭐
Trade Policies: Escalating U.S.-China tensions or tariffs in 2025 could disrupt copper flows, raising prices if China stockpiles or seeks alternative suppliers.
Regional Instability: Political unrest in copper-rich regions like Peru or Chile (e.g., protests, strikes) could reduce output, supporting high prices. For instance, Peru’s flat production trends (noted in prior data) might persist.
Sanctions/War: Geopolitical events, such as sanctions on Russia (a minor copper player) or conflicts affecting shipping routes (e.g., Red Sea disruptions), could increase costs and prices.
Energy Transition: Global commitments to net-zero (e.g., post-COP29 agreements) might amplify copper demand, reinforcing the $9.70 level.
⭐Supply and Demand Factors⭐
Demand: Copper’s role in electrification (EVs, grids) and construction suggests strong demand. At $9.70, industries might face cost pressures, potentially curbing consumption unless offset by growth.
Supply: Multi-month low inventories (e.g., Shanghai warehouses) and challenges in mining (e.g., declining ore grades, environmental regulations) could limit supply. A price this high implies significant tightness.
Substitution Risk: High prices might encourage substitution (e.g., aluminum in wiring), though copper’s conductivity makes this limited in key applications.
Stockpiles: LME warehouse data showing declining stocks would support $9.70; rising inventories could signal a reversal.
⭐Technical Factors⭐
Price Levels: At $9.70, XCU/USD might be testing a major resistance (e.g., a psychological $10.00 level). Historical highs (around $4.90 in 2022) suggest this is a breakout, potentially overextended.
Moving Averages: If the 50-day MA ($9.50) and 200-day MA ($9.00) are below the current price, this indicates bullish momentum. A drop below these could signal a correction.
RSI: An RSI above 70 (overbought) at $9.70 suggests a potential pullback; below 50 would indicate bearish momentum.
Support/Resistance: Support might lie at $9.00–$9.20 (former resistance turned support), with resistance at $10.00–$10.50.
⭐Sentiment Factors⭐
Market Sentiment: At $9.70, sentiment is likely bullish, driven by optimism about industrial demand and supply fears. However, over exuberance could lead to profit-taking.
X Trends: Discussions on X about unexpected commodity price spikes (akin to trending weather surprises) might reflect surprise at this level, hinting at speculative froth.
Media: Positive coverage of copper’s role in green tech could fuel bullish sentiment; negative economic outlooks might shift it bearish.
⭐Seasonal Factors⭐
Construction Cycles: Spring (March–May) typically sees higher copper demand due to construction in the Northern Hemisphere, supporting $9.70.
Chinese Demand: Post-Lunar New Year (Feb 2025) often boosts industrial activity in China, aligning with this price spike.
Historical Patterns: Copper prices can peak mid-year if supply lags seasonal demand, suggesting $9.70 might hold short-term but face pressure later.
⭐Intermarket Analysis⭐
USD Index: A declining DXY (e.g., below 100) would support higher XCU/USD; a rising DXY could cap gains.
Gold (XAU/USD): Copper often correlates with gold as an inflation hedge. If gold is also at highs (e.g., $2,900+), this reinforces bullish commodity trends.
Oil Prices: High oil prices (e.g., $90+/barrel) increase mining costs, supporting copper prices but potentially slowing industrial demand.
Equities: Strong industrial stocks (e.g., mining, EV firms) suggest copper demand; a broader market sell-off could drag prices down.
⭐Market Sentiment Analysis of All Types of Investors⭐
Retail Investors: Likely bullish at $9.70, chasing the trend via ETFs or futures, but prone to panic selling on dips.
Institutional Investors: Hedge funds and banks might be long copper, betting on supply shortages, though some could hedge if overbought signals emerge.
Industrial Users: Manufacturers (e.g., EV makers) might lock in prices via forwards, supporting the market, but high costs could prompt hedging or substitution.
Speculators: High volatility at $9.70 attracts traders; sentiment could turn bearish if momentum fades.
⭐Next Trend Move and Future Trend Prediction⭐
Short-Term: Likely a pullback to $9.20–$9.50 due to overbought conditions (RSI > 70) and profit-taking. Target: $9.30.
Medium-Term:
If supply remains tight and demand grows (e.g., China’s 5% growth goal), prices could test $10.00–$10.50. Target: $10.20.
Long-Term:
Sustained electrification trends might push prices to $11.00+, but economic slowdowns or substitution could cap at $9.00. Target: $10.50 (bullish) or $8.50 (bearish).
⭐Overall Summary Outlook⭐
Current Stance: At $9.70 on March 12, 2025, XCU/USD is in a Long/Bullish phase short-term, driven by strong demand, supply constraints, and a weaker USD. However, the extreme price suggests a Short/Bearish correction is imminent medium-term due to overbought signals and potential demand softening.
Bullish Case: Continued supply disruptions (e.g., Peru/Chile strikes), robust Chinese growth, and green tech demand could push prices toward $10.50–$11.00 long-term.
Bearish Case: Economic slowdown, USD strength, or inventory buildup could trigger a decline to $8.50–$9.00 within 6–12 months.
Recommendation: Hold long positions short-term but prepare for a correction. Watch $9.50 support and $10.00 resistance for trend confirmation.
📌Keep in mind that these factors can change rapidly, and it's essential to stay up-to-date with market developments and adjust your analysis accordingly.
⚠️Trading Alert : News Releases and Position Management 📰 🗞️ 🚫🚏
As a reminder, news releases can have a significant impact on market prices and volatility. To minimize potential losses and protect your running positions,
we recommend the following:
Avoid taking new trades during news releases
Use trailing stop-loss orders to protect your running positions and lock in profits
💖Supporting our robbery plan 💥Hit the Boost Button💥 will enable us to effortlessly make and steal money 💰💵. Boost the strength of our robbery team. Every day in this market make money with ease by using the Thief Trading Style.🏆💪🤝❤️🎉🚀
I'll see you soon with another heist plan, so stay tuned 🤑🐱👤🤗🤩

$6 Copper By 2026 | 9 Months to GoWould like to see some type of pullback as we're at a major resistance level and then a resumption towards the $6 target.
This is the best fractal I've seen play out and is still on track.

Copper (XCU/USD) Analysis: Bearish Reversal Expected Amid SupplyTechnical Analysis of Copper (XCU/USD)
Copper has faced strong resistance over the past four years, being strictly rejected at key resistance levels three times. Recently, on May 20, 2024, Copper reached its all-time high of $5.2, but the current weekly candle is showing signs of retesting that level. Despite this short-term bullish momentum, the broader trend from May 2021 remains bearish, indicating a long-term downtrend. A simple trendline drawn from May 2021 shows that Copper’s price action has struggled to maintain upward momentum and is likely to revert back to its mean.
The short-term trendline from the May 20, 2021 high also suggests that a pullback is imminent. Given this setup, the outlook for XCU/USD is bearish, and the price may gradually decline towards the recent support level of $4.0 before experiencing a potential upward swing. Traders holding Copper for weeks might consider short positions, while those trading shorter timeframes could scalp long positions on temporary upward moves with a suitable stop-loss strategy.
Fundamental Analysis of Copper (XCU/USD)
The global Copper market is currently facing a supply and demand imbalance due to shifting trade flows. Traders are redirecting shipments from Asia to the US to capitalize on higher prices and avoid potential tariffs, resulting in a tightening Copper supply in China. Estimates suggest that 100,000 to 150,000 metric tons of refined Copper will arrive in the US in the coming weeks. This could put upward pressure on US Copper prices while simultaneously reducing available supply in China, where demand is expected to rebound due to government stimulus efforts.
Meanwhile, Copper inventories on the London Metal Exchange (LME) and Shanghai Futures Exchange (SHFE) are declining, signaling a tighter supply in the market. In the US, the situation is further complicated by tariff threats from President Donald Trump, which could restrict Copper imports. Given that the US imports nearly half of its Copper supply and relies on only two major smelters, any additional tariffs could create a domestic supply squeeze, potentially driving prices higher in the short term. However, if global economic conditions weaken or demand slows, Copper prices may follow the bearish trajectory predicted in the technical outlook.

Cooper reched to the targetsIt was another golden trade!!!
open buy positon in a riversal zone and keep the trade open till the third target!!!
I will close the trade at this point...

copperXCUUSD
Rejecting from the Upper Trend Line of Rising Wedge and Resistance Level forming a Double Top Pattern. Completed " 123 " Impulsive Waves at Fibonacci Level - 161.80%

Not much but 3-5% fall possible Not much.. but 3-5% fall from today's high is possible.
Rsi negative divergence.(Daily)
Weekly double top.
Over bought (daily)

The 3 Step Rocket Booster Strategy Explained In DetailChart patterns are very important as you are trying to
learn how to trade in this video i share with
you the rocket booster strategy:
Its has 3 steps:
1-The price has to be above the 50 EMA
2-The price has to be above the 200 EMA
3-The price has to gap up
According to step number 3 the rising 3 soldiers candle stick
pattern is the one am seeing in this video,
to learn more watch the video again.
Rocket boost this content to learn more
Disclaimer:Trading is risky please learn risk management and
profit taking strategies.
Also feel free to use a
simulation trading account before
you trade with real money.

Copper Surges High as Bulls push the Price to mitigate 5.1 zone Expectations that US President Trump will impose tariffs on copper, a move that would pressure the limited capacity of local smelters. The President signed an executive order to initiate a review of copper imports after noting he would tariff the metal in an earlier speech before Congress. These signals suggested that levies would be imposed later in the year, but the escalation of base metal tariffs on Canada sporadically announced by the White House ramped up concerns that barriers on copper may be expedited.
That being said am just taking advantage of all this tariff talk as I find opportunities every time an executive tariff order are signed.
My Tp.1 for the metal is @5.1167 Handle.

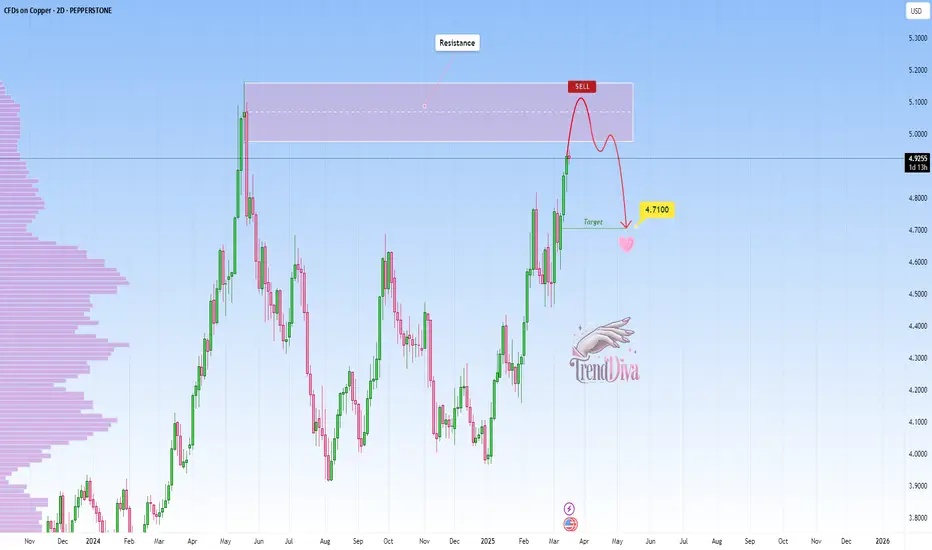
COPPER Approaching Key Resistance — Potential Sell SetupPEPPERSTONE:COPPER is approaching a significant resistance zone, highlighted by previous price reactions and strong selling interest. This area has previously acted as a key supply zone, increasing the likelihood of a bearish reversal if sellers step in.
The current market structure suggests that if the price confirms resistance within this zone, we could see a pullback toward the 4.7100 level, a logical target based on previous price behavior and current market structure. However, a clear breakout above this resistance could challenge the bearish outlook and open the door for further upside. It's a pivotal area where price action will likely provide clearer clues on the next direction.
Just my take on support and resistance zones—not financial advice. Always confirm your setups and trade with solid risk management.
Best of luck!
Copper breaks out but misses target, what's next?Copper formed an ascending triangle from mid-February, triggering the pattern on March 12. The price moved higher as expected but remains just shy of its target at 5.12. If there is a pullback toward 4.91, or in the worst case down to the breakout point at 4.84, traders will likely see this as a buying opportunity to align with the pattern's upward momentum. The pattern remains valid as long as the price stays above 4.78, a level just below the strong retest of the breakout point on March 13.
This content is not directed to residents of the EU or UK. Any opinions, news, research, analyses, prices or other information contained on this website is provided as general market commentary and does not constitute investment advice. ThinkMarkets will not accept liability for any loss or damage including, without limitation, to any loss of profit which may arise directly or indirectly from use of or reliance on such information

Falling towards overlap support?COPPER is falling towards the support level which is an overlap support that is slightly below the 38.2% Fibonacci retracement and could bounce from this level to our take profit.
Entry: 4.7641
Why we like it:
There is an overlap support level that is slightly below the 38.2% Fibonacci retracement.
Stop loss: 4.6909
Why we like it:
There is a pullback support level that line sup with the 61,8% Fibonacci retracement.
Take profit: 4.8933
Why we like it:
There is a pullback resistance level.
Enjoying your TradingView experience? Review us!
Please be advised that the information presented on TradingView is provided to Vantage (‘Vantage Global Limited’, ‘we’) by a third-party provider (‘Everest Fortune Group’). Please be reminded that you are solely responsible for the trading decisions on your account. There is a very high degree of risk involved in trading. Any information and/or content is intended entirely for research, educational and informational purposes only and does not constitute investment or consultation advice or investment strategy. The information is not tailored to the investment needs of any specific person and therefore does not involve a consideration of any of the investment objectives, financial situation or needs of any viewer that may receive it. Kindly also note that past performance is not a reliable indicator of future results. Actual results may differ materially from those anticipated in forward-looking or past performance statements. We assume no liability as to the accuracy or completeness of any of the information and/or content provided herein and the Company cannot be held responsible for any omission, mistake nor for any loss or damage including without limitation to any loss of profit which may arise from reliance on any information supplied by Everest Fortune Group.

Copper The Week Ahead 17th March ’25 Copper maintains a bullish sentiment, supported by a longer-term uptrend. However, the recent price action suggests a corrective pullback toward a key support zone, which could determine the next major move.
Key Levels to Watch
Resistance Levels: 9850, 9970, 10086
Support Levels: 9500, 9370 (200 DMA), 9260
Bullish Scenario
A successful retest and bounce from the 9500 support level, which aligns with the rising trendline and previous consolidation zone, could reaffirm bullish momentum. If this level holds, Copper could target the 9720 resistance, with further upside potential toward 9850 and 9977 in the longer term.
Bearish Scenario
A confirmed breakdown below 9500, with a daily close beneath this level, would weaken the bullish outlook. This could lead to a deeper retracement toward the 9370 support (200 DMA), with extended downside risk toward 9260 if selling pressure persists.
Conclusion
While Copper remains in a broader uptrend, the 5000 level serves as a key pivot point. A bullish bounce from this level could signal trend continuation, while a breakdown below it may indicate further corrective weakness. Traders should monitor these levels closely for confirmation of the next directional move.
This communication is for informational purposes only and should not be viewed as any form of recommendation as to a particular course of action or as investment advice. It is not intended as an offer or solicitation for the purchase or sale of any financial instrument or as an official confirmation of any transaction. Opinions, estimates and assumptions expressed herein are made as of the date of this communication and are subject to change without notice. This communication has been prepared based upon information, including market prices, data and other information, believed to be reliable; however, Trade Nation does not warrant its completeness or accuracy. All market prices and market data contained in or attached to this communication are indicative and subject to change without notice.
