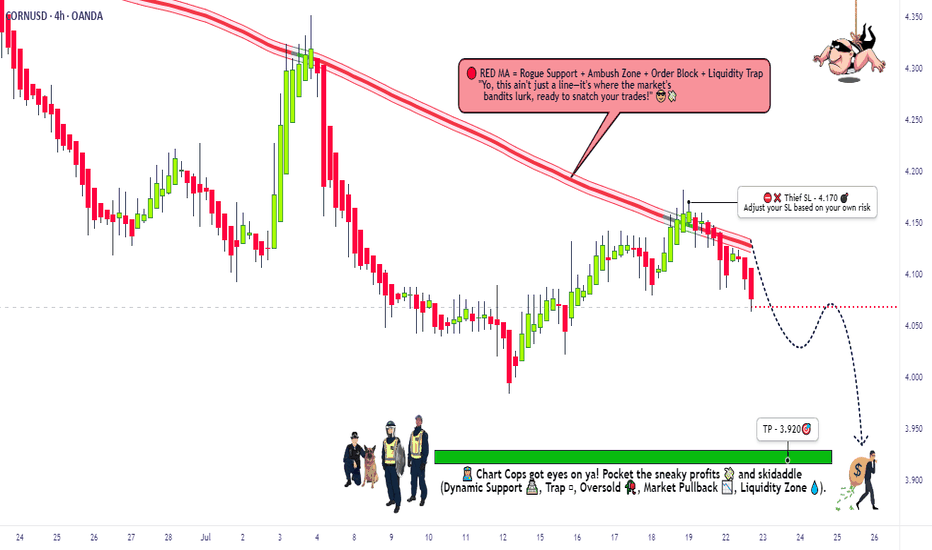
CORN Heist: Steal Short Profits Before Bulls React!🚨 CORN HEIST ALERT: Bearish Raid Ahead! 🚨 Swipe the Loot Before Cops Arrive! 🌽🔻
🌟 Attention, Market Bandits & Profit Pirates! 🌟
🔥 Thief Trading Intel Report 🔥
The 🌽 CORN CFD market is setting up for a bearish heist—time to short-swipe the loot before the bulls rally their defenses! Police barricade
THE GREAT CORN GRAB! (Bearish CFD Heist)🌽 THE CORN HEIST: Bearish Raid Plan (Swing/Day Trade) 🚨💰
🌟 Attention, Market Robbers & Money Makers! 🌟
(Hola! Oi! Bonjour! Hallo! Marhaba!)
🔥 Based on the ruthless Thief Trading Style (TA + FA), we’re plotting a bearish heist on the CORN Commodities CFD Market! Time to short like a bandit and escap
Shady CORN Scheme: Bullish Plot or Market Trap?🌟 Ultimate CORN Heist Strategy: Swing Trade Plan 🌟
Greetings, Wealth Chasers & Market Mavericks! 🤑💸
Ready to pull off a legendary heist in the 🌽 CORN Commodities CFD Market? Our Thief Trading Style blends sharp technicals and fundamentals to craft a high-octane plan for massive gains. Follow the st
Corn Market Trends: Production in Argentina and Brazil (02.11)As the global corn market navigates supply constraints, the latest WASDE report highlights a downward revision in production forecasts for Argentina and Brazil, key players in global exports. Adverse weather conditions, including prolonged heat and dryness in Argentina and planting delays in Brazil,
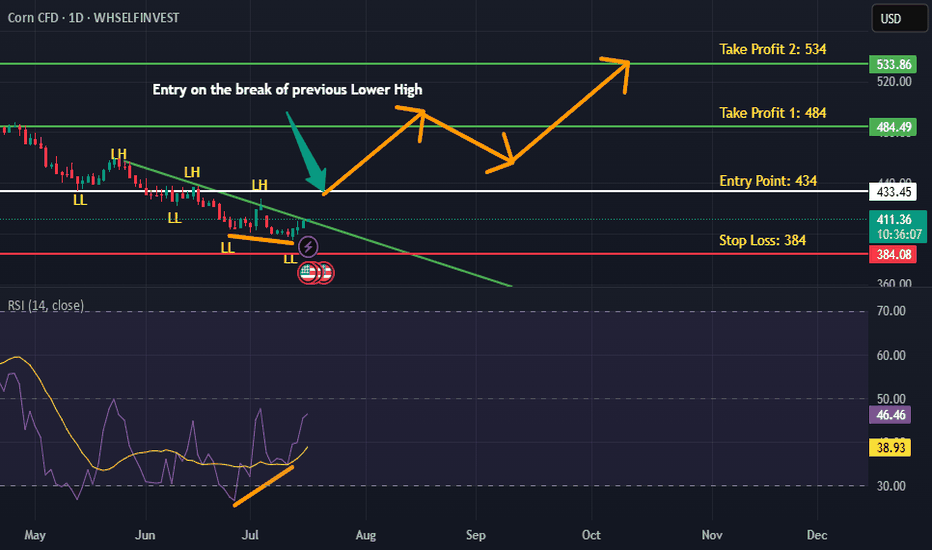
CORN is BullishCorn has not only broken the descending trendline but has also successfully breached previous lower high after the emergence of a bullish RSI divergence on weekly time frame. Entry can be taken at current price as according to Dow theory now price will start making higher highs and higher lows. Targ
Corn Market: Outlook Driven by Supply Trade, and Demand ShiftsThe global corn market in 2025 is undergoing notable transitions shaped by changing supply dynamics, evolving trade flows, and increasing demand across key sectors. The January 2025 WASDE report sheds light on the significant pressures and opportunities facing this essential commodity as productio
See all ideas
Summarizing what the indicators are suggesting.
Oscillators
Neutral
SellBuy
Strong sellStrong buy
Strong sellSellNeutralBuyStrong buy
Oscillators
Neutral
SellBuy
Strong sellStrong buy
Strong sellSellNeutralBuyStrong buy
Summary
Neutral
SellBuy
Strong sellStrong buy
Strong sellSellNeutralBuyStrong buy
Summary
Neutral
SellBuy
Strong sellStrong buy
Strong sellSellNeutralBuyStrong buy
Summary
Neutral
SellBuy
Strong sellStrong buy
Strong sellSellNeutralBuyStrong buy
Moving Averages
Neutral
SellBuy
Strong sellStrong buy
Strong sellSellNeutralBuyStrong buy
Moving Averages
Neutral
SellBuy
Strong sellStrong buy
Strong sellSellNeutralBuyStrong buy
Displays a symbol's price movements over previous years to identify recurring trends.


