COTI LOOKS BULLISHHi, dear traders. how are you ? Today we have a viewpoint to BUY/LONG the COTIsymbol.
For risk management, please don't forget stop loss and capital management
When we reach the first target, save some profit and then change the stop to entry
Comment if you have any questions
Thank You
COTIUSDT trade ideas

SasanSeifi 💁♂️COTIUSDT /LONG VIEW 👉1D ⏭ 0.091/0.10 ⬆Hello everyone ✌ As you can see, in the daily time frame, after the growth of about 150% from the range of 0.052, the price faced a correction of about 50% from the range of 0.12. It is currently trading in the 0.080 range. According to the behavior of the candles in the long term, the scenario we can consider is that the price will grow up to the 0.091 range after collecting VOLUME and minor fluctuations.
The possible trend is indicated on the chart.
The important support area is 0.068.
❎ (DYOR)...⚠⚜
What do you think about this analysis? I will be glad to know your idea 🙂✌
IF you like my analysis please LIKE and comment 🙏✌

COTI S&R >>>>>>I Have Tried My Best to Bring the best Possible outcome in this Chart.
In case COTI price's Hit and Stablize above COTI mid-term down trend channal,
We have a good opportunity for buyiying position to 100-80% trget profit in this uptrend.(red marked zon_strong supply)
PLZ do your own review and set stop first.
Must important level's marked on the chart.(scroll your mouse on the chart)
It's just an analyze,
Not a financial advise.
PLZ DYOR
With hopping success>>>>>>>>

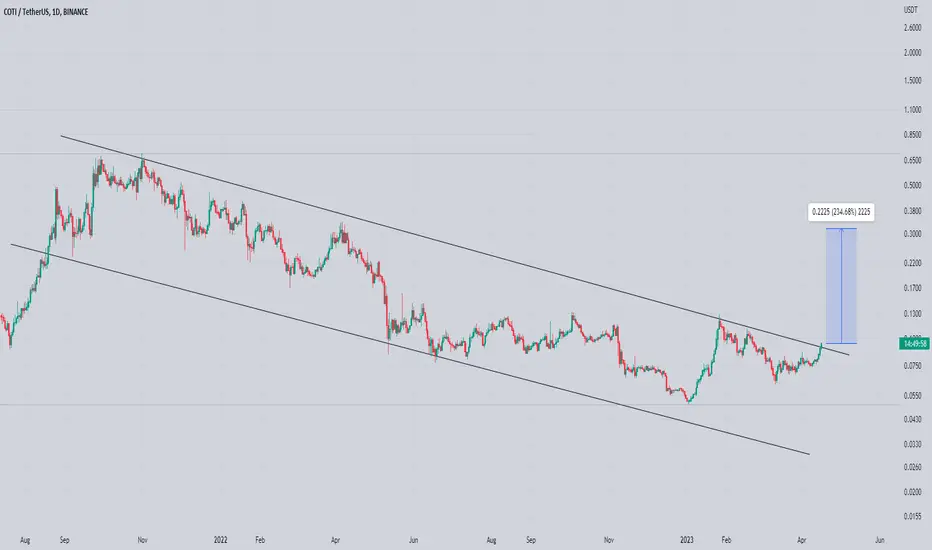
Coti Breaking Descending Channel Formed & breaking descending channel in daily Timeframe incase Of successful breakout Expecting 180 to 200% bullish move in Midterm Keep Eyes On coti for breakout

COTI is in an symmetrical triangle#COTI is in a very nice symmetrical triangle, I would enter now as we seem to have bounced off the bottom.
I also expect long term holders to enter now as the end of the Airdrop period nears.
Given that a lot of tokens will be locked for ~180 days, I fully expect the token to keep going up.
Because of the upcoming airdrop, I am not planning on exiting but I do have a few days to observe if we reach the SL.
If we do then I will sell and reconsider if I have time to re-enter, but I would be surprised if we did drop off.
Entry: Now (100%)
TP1: 0.1050 (50%)
TP2: 0.0879 (50%)
SL: 0.0716

COTIUSDT 2H HR MTcoti has broken its previous high and has become positive compared to pirbtc, which increases the power of upward movement.

COTIUSDTWe can see a trend reversal as there is a completion of AB=CD harmonic pattern + bearish divergence. B point has been broken so we can take an instant entry here and wait for TPs or SL.
Cheers.

COTIUSDT LONGGGGGGGGGGGGGGnnnnnnnnnnnNothing to add
add COTIUSDT on to ur PF
Huge pump Incoming
Never a fin Advi
LONG

Coti Buy Trade #Coti
Entry: 0.0831
Stoploss: 0.0735
TakeProfit: 0.1954 @ 135%
INSHA ALLAH
This analysis is for informational purposes only and should not be considered financial or investment advice. The information presented in this analysis is based on my own research and is subject to change without notice. The analysis is not a recommendation to buy or sell any specific cryptocurrency Stocks Or Forex, including This Pair. Please conduct your own research and consult with a financial advisor before making any investment decisions.
Here are ten popular cryptocurrencies as hashtags without separate lines:
Bitcoin (#bitcoin), Ethereum (#ethereum), Binance Coin (#binancecoin), Dogecoin (#dogecoin), Cardano (#cardano), Polkadot (#polkadot), XRP (#xrp), Chainlink (#chainlink), Litecoin (#litecoin), Stellar (#stellar)

$COTI lock up chaseCoti is getting ready to start a governance token airdrop campaign which starts the 3rd of April. Lock up periods will create liquidity crunches and make this move fast.
We are ready for 10c and soon there after 13c. Weekly is turning green. Bets placed!

COTI bullmarket targetsCOTI, upward parallel channel. Fibonacci extension lvls for next bullmarket show targets up to 3-5$.

COTI is gonna be bearish for sometimeCOTI has created a Descending triangle pattern and has already Done a break out and a pullback to the bottom line of the Triangle which means It's ready to Descend Further. The Support zone which we think the price will end up is visible on the chart.
_ _ _ _ _ _ _ _ _ _ _ _ _ _ _ _ _ _ _ _ _ _ _ _ _ _ _ _ _ _ _ _ _
🌍Thank you for seeing idea .
Have a nice day and Good luck

COTI LONG TERM BULLISH REVERSALHello Traders and everyone, I am Hadi Karaali, Known as SNIPERS_FX
If you like the idea, do not forget to support with a like and follow.
COTI FROM A LONG-TERM PERSPECTIVE!
As we can see price got stuck inside this big range market
However, price now is around a strong support zone , where we will be looking for a long-term bullish movement.
For the bulls to kick in from a long-term perspective we need a break above the upper bound of the range which is a major swing high
then we will be speculating bullish reversal and a further movement higher would be expected till the upper resistance zone
If you like this kind of analysis don't forget to like and follow
and as usual follow your trading plan and manage your risk.
Be patient and good luck!

COTI formed bullish Gartley for upto 76.50% pumpHi dear friends, hope you are well and welcome to another new trade setup of COTI coin with US Dollar pair.
On a daily time frame, COTI has formed a bullish Gartley move for another price reversal.
Note: Above idea is for educational purpose only. It is advised to diversify and strictly follow the stop loss, and don't get stuck with trade

COTIUSDTCoti should see some nice action here.
10-11 cents is the target
Seems to be in a megaphone patteren

COTIUSDT is inside a descending channelThe technical analysis of the price chart shows that the pair is currently trading inside a descending channel. The descending channel is a bearish pattern that suggests a potential continuation of the current downtrend.
Moreover, the pair has recently lost the daily support at 0.095$, which could trigger selling pressure in the market. The loss of support may lead to a further price decrease towards the demand zone at the 0.07$ area. The demand zone is the area where buyers are expected to be active and could potentially stop the downward trend.
Traders are waiting for a breakout of the descending channel and a retest of the key level for a new long position. According to Plancton's rules, traders may consider entering a new long position once the breakout and retest occur. This means buying COTIUSDT with the expectation that the price will increase.
–––––
Follow the Shrimp 🦐
Keep in mind.
🟣 Purple structure -> Monthly structure.
🔴 Red structure -> Weekly structure.
🔵 Blue structure -> Daily structure.
🟡 Yellow structure -> 4h structure.
⚫️ Black structure -> <= 1h structure.
Follow the Shrimp 🦐

COTI/USDT Analysis! LONG!COTI/USDT Has found a strong demand zone! expecting a breakout to the upside.
COTI left alot of liquidity above the current price, im buying!

COTI LONG TERM BULLISH REVERSALHello Traders and everyone, I am Hadi Karaali, Known as SNIPERS_FX
If you like the idea, do not forget to support with a like and follow.
COTI FROM A LONG-TERM PERSPECTIVE!
As we can see price got stuck inside this big range market
However, price now is around a strong support zone, where we will be looking for a long-term bullish movement.
For the bulls to kick in from a long-term perspective we need a break above the upper bound of the range which is a major swing high
then we will be speculating bullish reversal and a further movement higher would be expected till the upper resistance zone
If you like this kind of analysis don't forget to like and follow
and as usual follow your trading plan and manage your risk.
Be patient and good luck!

COTIUSDTPERP SHORTCOTIUSDTPERP 1h TF is in bearish trend and printing new lows. we can see a red candle closure in the current higher low. Short trade can be taken as per marking on the chart.

current Coti evaluation and road map JUST FOR FUN AND EDUCATION to make paper trades and test my skills

Coti Getting Ready For Another Bullish Impulse Formed Descending Channel In h1 Incase Of Breakout Expecting Another Bullish Impulse
Incase Of Breakout Expecting 20 - 25% Bullish Move

Coti Long position setupCoti is currently on a triangle and I assume that it will break it down trend with coming wave,
targets are marked on chart,
Lets See
