0.1318 is a possible target for COTI/USDTThis level is a weekly Ichimoku level. The price might go up to it.
COTIUSDT trade ideas

COTI with volume coming inCOTI with volume coming in
Market Cap: 108.3M
Category: DeFi
Target 1: 0.108626
Target 2: 0.120684
Target 3: 0.131283
Stop Loss: 0.087957
Manage Risk - have a stop loss in place
price movement prediction
Price Prediction
not financial advice
this is for entertainment purposes only
always DYOR

COTIUSDT Breakout!COTIUSDT Technical analysis update
Buy level: Below $0.088
Stop loss: $0.072
Take Profit 1: $0.100
Take Profit 2: $0.120
Take Profit 3: $0.140
Take Profit 4: $0.167
Always keep stop loss
Thanks
Hexa

Coti can pumpHi, dear traders. how are you ? Today we have a viewpoint to BUY/LONG the COTI symbol.
For risk management, please don't forget stop loss and capital management
When we reach the first target, save some profit and then change the stop to entry
Comment if you have any questions
Thank You

COTI Short - Possible breakdown in 1HSHORT ENTRY
Leverage: 3x-5x
Pair: COTI/USDT
Entry: 0.0532
Target: 0.0504
Stop Loss: 0.0546
Risk:Reward = 1:2
1hour Timeframe $COTI possible breakdown. Take entry on breakdown level with proper risk management.
Note: This analysis is for educational purpose only. This is not a financial advice. Do your own research.

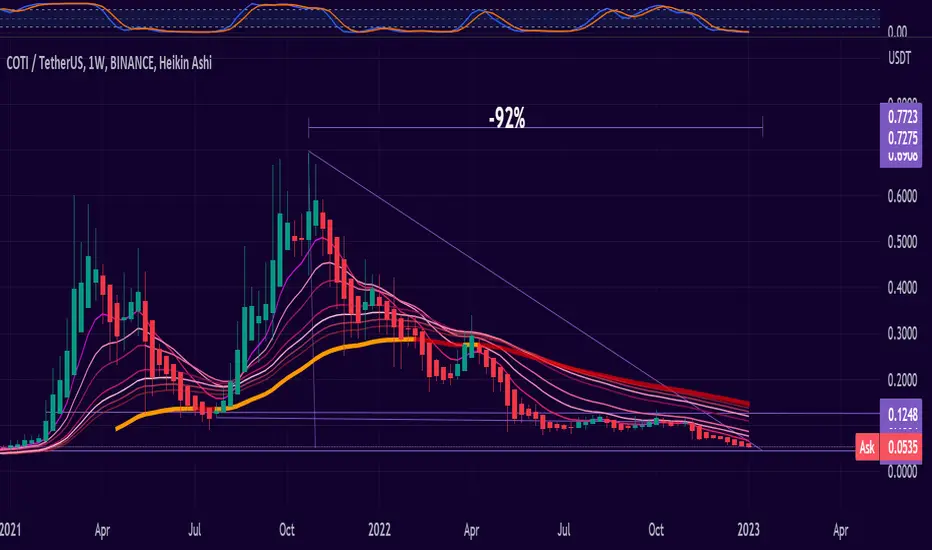
COTI -Currency Of The Internet. Currency Of The Internet.
COTi has fixed an unbelievable 92% since its ATH, it is the first enterprise-grade fintech platform on its official website, empowering organizations to build their own payment solutions and digitize any type of currency to save time and money.
The bottom is expected to be at 0.0438 and its weekly resistance at 0.12489. At this moment COTI is at the bottom line of the Keltner Channel and by all indications, triangular formation, oversold RSI, we will have a reaction in a short time from COTI, of course if the geopolitical conditions allow it.
COTI, with its DAG-based distributed ledger blockchain technology, allows you to confirm transactions using its Trustchain Algorithm. The cluster can validate and settle hundreds and thousands of transactions per second (TPS).
Among other functionalities COTI was designed and engineered to make daily transactions between merchants and consumers. The first major part of the COTI ecosystem is COTI Pay. It can process any and all types of payments offline or online, be it cryptocurrency or stablecoins, credit cards or even the merchant's native currency. It has built-in financing with interest earned on deposits and commercial loans.
Multi Dag 2.0 - for future reference 8 hours away from the MD2.0 Hard Fork. Coti’s network will never be the same. Let’s see how this looks in one year for now.

Big profit incoming on COTIUSDT(SELL SETUP)Down to the target open to use 5x leverage . This is not financial advice.

COTI USDTAre we going to see the typical power of 3 setup on coti? Def good level for buy here. BIg daily/weekly support

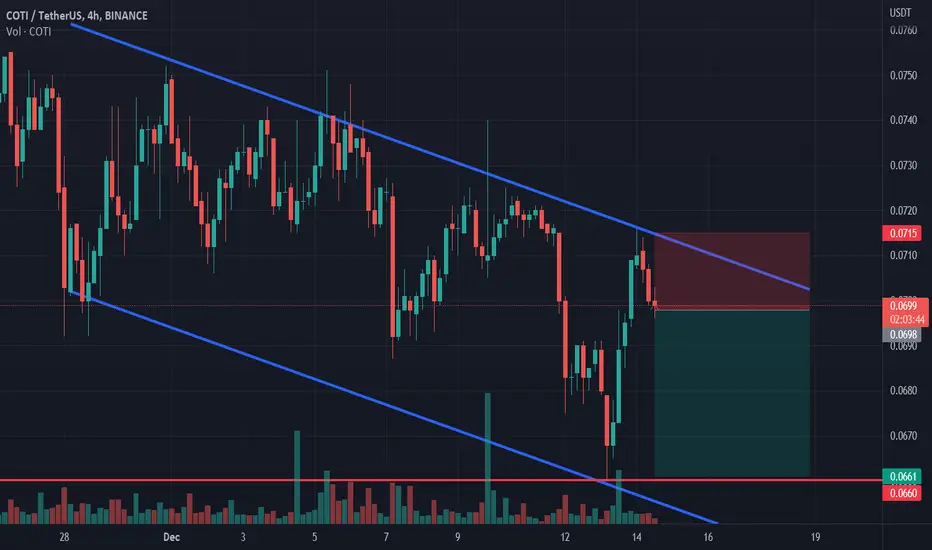
COTI / USDT 4H CHART - Targets and Stoploss!Hello everyone, let's look at the 4H COTI to USDT chart as you can see that the price is moving below the local downtrend line.
Let's start by setting goals for the near future that we can take into account:
T1 = $0.0686
T2 = $0.06943
T3 = $0.07013
T4 = $0.07077
and
T5 = $0.07176
Now let's move on to the stop loss in case the market goes down further:
SL1 = $0.0675
SL2 = $0.06638
and
SL3 = $0.06494
Looking at the CHOP indicator, we see that the energy is gathering more and more strength on the 4H interval, while the MACD indicator indicates a local downtrend. It is also worth adding that we have a rebound on the RSI.

COTI shortCOTI bounced off the upper boundary of descending channel. Bearish movement to support level at 0.066 is possible.
COTI USDT at Binance -ChartType KAGINext Stop is about 743 and then is goes once again Down to go up after that

COTI USDT at Binance -ChartType KAGIWhere do you think we are going with COTIUSDT? Are we Going DOWN? Or are we Going UP

COTI USDT at Binance -ChartType KAGI - Update from 6-12-2022Where do you think we are going with COTIUSDT? Are we Going to DOWN? Or are we Going to UPSTAIRS?
DOWNSTAIRS value cames sooner than expected.
The bottom RED trend line has been adjusted. The moment of the crossing at the question marks will determine where it goes. What do you expect?
Updated from:
:https://www.tradingview.com/i/8fOLUP23/


COTI basing upwards. Yet another long call.My buddy spotted a potential COTI long position.
I left some ideas - I have alarms set on the bottom on the current upward trend to enter a low risk long. Some TP points noted.
Keep that risk under control.

COTI going to $0.30 or $0.70??COTI coming to a decision point pretty soon. If my pattern of Descending triangle is correct it will be going to either $0.30 or $0.70. The Descending Triangle is normally a bearish pattern, however I believe it has been consolidating and will break out upwards to new ATH. It is holding that bottom support very well and for quite a while now. Currently at a great buy opportunity for a tight stop loss in case it does break downwards. If that happens I expect a pull back to about $0.30 area where it sat for a good amount of time before breaking up.

COTI might be poppin soonIf it follows the channel and overall market is green for the next days, then coti can pop to the top of the channel and 200 day EMA


COTI SHORT SETUPHello, dear traders. how are you ? Today we have a setup to SELL/SHORT the COTI symbol.
For risk management, please don't forget stop loss and capital management
When we reach the first target, save some profit and then change the stop to entry
Comment if you have any questions
Thank You

COTIUSDT & Possible Targets COTI has a possibility to move upward to reach the goals highlighted. Wave numbering has broken some principles for a good reason.

COTI | Descending Channel Formation..!!
#COTI is forming Descending Channel Pattern in Daily timeframe..
Seems like Bottomed out & Ready for Historical Breakout So Keep an eye on it.
In Case of Breakout, Expecting +160-180% Bullish Wave in Midterm.
Please like the idea for Support & Subscribe for More ideas like this and share your ideas and charts in Comments Section..!!
Thanks for Your Love & Support..!!

COTI can hit 0.14xx area soon - risky tradeAs we can see in the chart, price is holding quite nicely above white MA which is very good sign. If the price breaks up the orange MA, then there is a high probability that red MA (200) on daily can be our target.
BTC must stay without deeper drop. This is quite risky so have SL placed.
MANAGE YOUR RISK
