Buy COTI Here Buy COTI by market
Current price (Buy price): 0.63$
Target 1 : 0.66$ (+50%)
Target 2 : 0.68$ (+80%)
Target 3 : 0.69$ ( +100% )
Target 4 : 0.715$ ( +120% )
COTIUSDT trade ideas

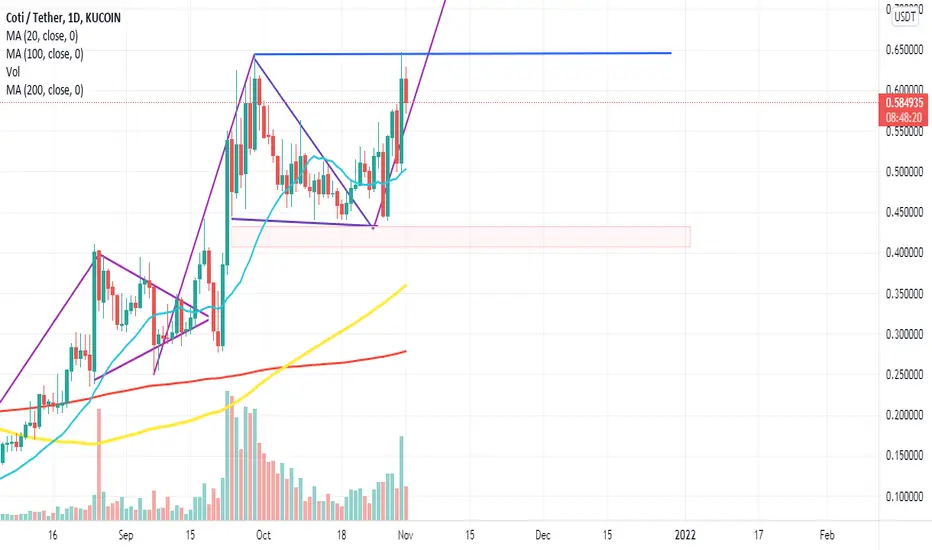
COTI Cup and HandleToday it's a big day for the COTI with the release of mainnet 2.0, We can see a clean Cup and Handle, let's buy 🚀

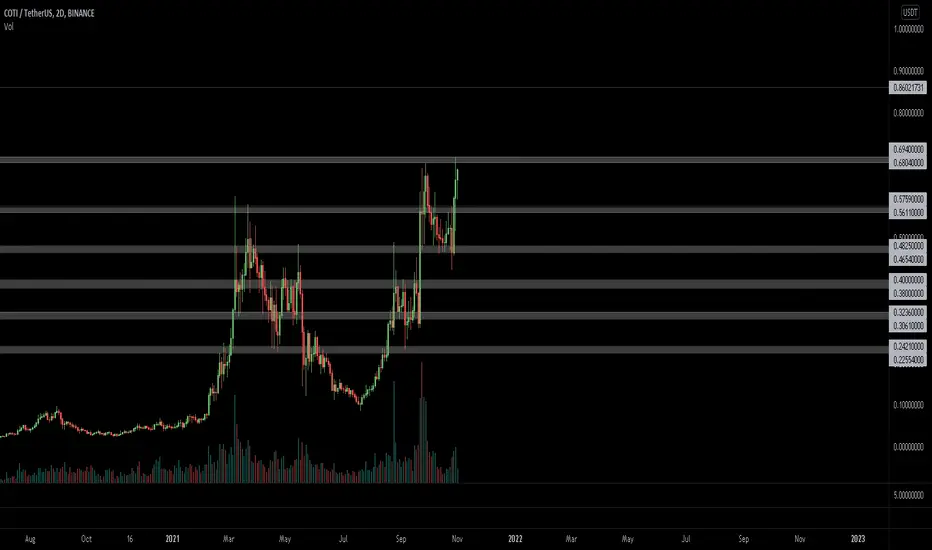
$COTI, Signalling a 2D Buy signal (4 of 4 so far since mid 2020)$COTI
Signalling a 2D Buy signal (4 of 4 so far since mid 2020)
Just ~5% away from ATH w/ increasing volume
Seems interesting.. 😏
#COTI
Golden Cross On the Daily Frame !After the LAST GOLDEN CROSS The price went x15 higher from 0.04$ to 0.6$ ! With no real products !
Big news are coming on the CARDANO summit on the 26th of September, a big partnership between COTI and ADA will be revealed !
Next week the COTI credit card and crypto bank accounts will be released !
AND MORE BIG NEWS !!!
On the daily frame we have a golden cross
If only we do x15 (like what happened after the last golden cross) from current prices, the price will go from 0.36$ to 5.4$ if not more !!!!
This is not a financial advice !
Do your own analysis !
Trade on your own RISK !

Will COTI cross 0.84? COTI updateHi, I am new to the crypto world, this is how I am going on COTI.
This isn't investment advice. Please leave your thoughts about my strategy.
Yellow lines are resistance levels.
Orange lines are support levels.
Is 0.59 a resistance level?

COTI - Future Projection SeriesDuring the last downturn in the market I spent time learning more about utilizing the charting functions in TradingView. I also watched a lot of youtube vids about crypto and charting concepts. I came across a good chunk of info on using the “log” function and what it could possible show me.
At this point in the crypto cycle, even though I feel we are nearing a parabolic stage, it is beyond the point to expect 50X or more from me or any basic Joe who “dabbles” in crypto investing. Think long term. What can I realistically (if that even exists in Crypto) expect a coin to perform in the next bull run. Well the log function gives me a level playing field to do just that.
Using the log function, I utilize a common start date as the beginning of my parallel channel. That date is the big drop Mar/20. The parallel channel runs from the bottom of the Mar/20 drop forward in time along the bottom dips. The top of the channel is the highpoint in the cycle.
The first future projection is created using the green trend lines, the first from the top of the cycle peak to the bottom, and another from that lowest point up forward in time to what I estimate as the timeframe for top cycle which approximates end of Q4, and my birthday Jan/7 so thats the future date for all graphs in this series.
The second future projection takes ratio’d growth into consideration. This is done using the blue trend line which starts at the first peak after the Mar/20 drop, using the top of arcs as the guidance. I carry this line forward to Jan/7.
Conclusion; As you can see I have a red line at .55 because I bought there so ya I have an interest in this conclusion. Having said that, I’ll use .55 as my initial investment amount.
First Projection $2.73
2.73 / .55 = 4.9 X
Second Projection $10.52
10.52 / .55 = 19.1 X
Now for a regular old fellow such as myself, a 5 to 19 X on my money within the next few months is a good investment. It literally involves 2 trades. Timing is not a great big deal as long as you get in near .55 otherwise the X factors changes a lot. Timing to get out is the top of the curve. This is a day time factor. It’ll be “at the top” for days or a week. You’re not chasing a pump or a knife here, its a month(s) trade. Or a parabolic week so watch close.
I’ve done this for a lot of coins now and the results are sometimes very interesting in that, a popular coin just doesn’t have the numbers or that it really has good numbers. I found as an average I like results in the 5 or above range for the first projection and 15 or above for the second projection. If I utilize this investment concept and choose coins with similar numbers I can reasonably expect a 10-15 X overall. I’ll post a few others I find interesting for this bull run in the coming posts.
My thoughts, not advice Oklah. Cheers

COTIUSDTIt seems to have another uptrend and in case of resistance breakout our target could be $ 1 - Support 0.5 / 0.4 / 0.3 - Resistance 0.66

COTI ANALYSISI'm so bullish on $COTI Tomorrow the new mainnet will be launched, be ready. Just look at the 40% that the price took when the announcement (28th octobre) was made so imagine tomorrow....
The chop is loaded be ready.
Target 1$ EOY.

A sleeping lion!! COTI/USDT, mid/long term trade setup!Hello, everyone! let's take a look on Coti/usdt, coti broke out perfectly here as we can see on 4hr TF. I am going long on coti here.
Also, i see it Fundamentally strong as there are some important events in coming months.
Long Entry:- 0.4950- 0.5150
Stop Loss:- 0.4650
Target 1:- 0.5600
Target 2:- 0.6100
Target 3:- 0.6900
Fundaments:-
Mainnet 2.0 on 30th Nov 2021
Rollups on Mainnet on 31st Dec 2021
Please hit like and share, if you want to appreciate my work.
Thnaks!!

Flag forming for COTINice flag is forming for COTI, they announce that main net 2.0 will launch on 02.11.2021 so I'm expecting break out in the next few hours.
Target is 0.681 fib or around 0.79
Stay cool and take care.

Double CupCoti looks ready to explode upwards in a similar fashion to its last run up followed by a consolation into a cup. We could see this playout once again.

COTI USDTCOTI is in consolidation mode
Looking for a dip in COTIUSDT
Buying zone should hold any dip
Will be a decent buying opportunity for year end rally

COTI longI updated my trade idea for COTI as it broke out, reduced the risk and added new TP levels. I'm planning to take out my initial investment at the 0.2618 level and let the rest ride. Let's see what happens whoop whoop, I'm excited for this one!

COTIUSDT - Can coti break the resistance ?!#COTIUSDT - Daily Timeframe
Coti had a reverse head and shoulder pattern and could not function well and cause a fall. I hope it does the opposite and makes coti grow.

COTIUSDTI expect a small correction
I will gain a position with limit orders at OB which can be seen at 15 min TF:
limit order 1: 0.5195 (0.25% of depot)
limit order 2: 0.5030 (0.25% of depot)
limit order 3: 0.4854 (0.5% of depot)
limit order 4: 0.4689 (0.5%)
stop: 0.3972

Coti. Easy double Coti has not yet ran after listing. We are breakout out now with a target of 75 cents to 1.2$ load up and sit back, wait for liftoff.

COTI testing previous resistance as support.COTI is testing the breakout out of the channel as support. Stochastic is oversold so with a bit of luck (and strength of Bitcoin) we could see a nice retest here.

COTI, BULLISH STORY CONTINUES...Great potential!
Entry must be over 0.56 (even after the retest). Make up your mind with accurate risk and money management.
-Go ahead-

Market UpdateThis is what I see, do you have the same opinion? I think we must be waiting for a great sharp

Long COTIUSDTLong COTIUSDT
COTI has been consolidating 37 days now. Im looking to long COTIUSD after a regain of the monthly open of 0.62.
1st Target - 0.77 zone
2nd Target - 0.95 zone
invalidation daily close below monthly open after a breakout

COTIUSDT HI everyone 😃 1400/8/8
Before we start to discuss, I would be glad if you share your opinion on this post and hit the like button if you enjoyed it !
4 hr analysis.....

#COTIUSDT Reached to it's resistanceIf #COTI Break out the resistance at 0.60 and close daily above this level , will go to 1$
