COTIUSDT trade ideas

Coti, Golden pocket retrace sets up 16x algo targetGolden pocket special...
to avoid being repetitive & to save time I'll just give the trade and spare you the write up. See linked BTC chart for more details.
The Trade:
Preferred Entry: $0.079 or 0.618 retrace of this impulse wave (if we get one)
Ape Entry: $0.114
Stop: $0.075
Target: $1.91
D.Y.O.R. DO NOT BLINDLY TAKE THESE TRADES.
Never Trust. Verify. PLEASE DO YOUR OWN ANALYSIS.
This is not financial advice. These are just my observations.
Technical Analysis is not about being right, it's about increasing your odds.
Be prepared to be wrong. Risk management is key. Capital preservation above all else.

COTI/USDT: BREAKOUT ALERT! 3X PROFIT POTENTIAL!!Hey everyone!
If you’re finding value in this analysis, don’t forget to hit that 👍 and follow for more updates!
COTI is showing strength right now! It’s breaking out from a descending triangle pattern and looks poised for a potential 2x-3x rally from this level. Start accumulating here, and consider adding more if there’s a dip.
Entry Range: $0.094 - $0.106
Target: 250% - 300%
Stop Loss: $0.08
COTI’s price action is shaping up to be a solid bullish setup. What are your thoughts? Drop your insights and analysis in the comments below!

COTIUSDTCOTI ~ 6D
#COTI So far it continues to maintain this support block. if you have Conviction on this coin,. This support block would be a very good buy for now.

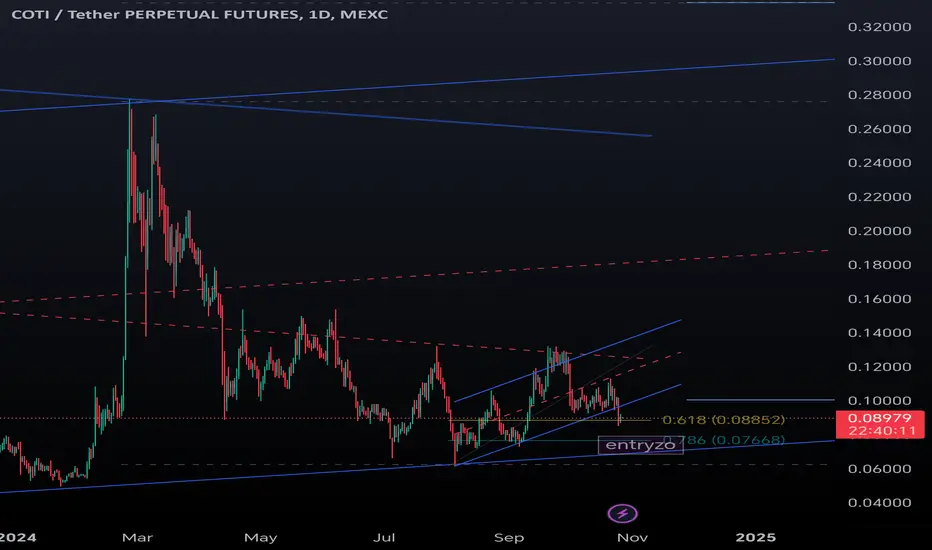
COTI entry on htfWaiting for COTI price to come back to this level.
If price respects the lower trend could present a long opportunity.
COTI D Update
Green support seems to be holding price, and this could be black wave 2 in its final stages.
Even if this is a corrective move to the upside, I still expect another leg up, possibly targeting gray resistance (around 0.15).
Invalidation is at the previous low of 0.06130 (pink line).


COTI Long Position (Support Consolidation)Market Context: COTI is consolidating within a key support zone, providing an opportunity to ladder into a long spot position. This offers a favorable risk-to-reward scenario for a potential upward move.
Trade Setup:
Entry: Between $0.091 - $0.107.
Take Profit:
First target: $0.13 - $0.15
Second target: $0.18 - $0.21
Stop Loss: Just below $0.085.
This setup looks to capitalize on the consolidation and potential bounce from support levels. #COTI #Altcoins #Crypto

COTI will be bull?after seeing the price movement of this coti it makes me interested because it managed to create a new structure, where it penetrated the previous high low which will indicate a sign of a price reversal, and we believe the price will show an increase to the green line that we have marked.
*disclaimer

Coti | Fast 110% BU-Pot. Bullish Wave Mapped➢ In January 2024, COTIUSDT produced a rounded bottom pattern that was followed by very high volume and suddenly a 450%+ bullish wave. This rounded bottom is now our main "low."
➢ In August 2024, COTIUSDT produced a higher low and is now ready to produce a new bullish wave. This bullish wave is part of a relief rally before the major 2025 bull-market and so we expect it to be mild in size.
👉 Easy target of 110% (fast) can be seen mapped on the chart. More is possible but we are focusing on the short-term. This is a "get in and get out" type of trade.
Namaste.

Buy Trade Idea for COTIDescription
COTI (Currency of the Internet) is making waves in the crypto and fintech space with its unique focus on providing scalable, fast, and secure payment solutions. Below are the key fundamentals supporting a buy trade for COTI:
- **Next-Generation Payment Network:** COTI is designed as a fully encompassing fintech platform, enabling organizations to build their own payment solutions and digitize any currency, ensuring scalability and speed.
- **Innovative Trustchain Algorithm:** COTI uses a unique Trustchain consensus algorithm, reducing transaction costs and increasing the speed and volume of payments, making it ideal for both retail and institutional use cases.
- **Strong Use Case in Decentralized Finance (DeFi):** COTI is positioned as a key player in the DeFi ecosystem, facilitating seamless transactions and offering advanced DeFi services through its platform.
- **Strategic Partnerships and Adoption:** With growing partnerships, including integrations with leading payment processors and global organizations, COTI is gaining traction and increasing its market presence.
Given these fundamentals, COTI presents a compelling buy opportunity, driven by its strong position in the payments and decentralized finance sectors.
Disclaimer
Trading and investing in cryptocurrencies involve significant risks and may result in substantial losses. This content is provided for informational purposes only and should not be considered financial advice. Cryptocurrencies are volatile and influenced by a variety of market and economic factors. Always conduct your own research, assess your risk tolerance, and consult a financial advisor before making any investment decisions. Past performance is not indicative of future results, and market conditions may change unexpectedly.

COTIUSDTCOTI ~ 1D ✅
#COTI Managed to break this descending resistance with strong volume. and now faced with local resistance here. If retesting occurs,. This would be a good opportunity for short-term buying.


COTIUSDTWe can attempt to short COTIUSDT from specified level if it break HL , also there is bearish divergence occur indicate that it moves downward.
SL , TP mention in chart.

COTIUSDT Critical Moment Approaching – Will We See a Breakout?Yello, Paradisers! Are you ready for what could be a decisive move in #COTIUSDT? Let's dive into analysis.
💎We're seeing #COTI signs that a potential breakout may be on the horizon, and if it happens, we could be looking at a significant upward push toward our major resistance target.
💎However, there’s always the other side of the coin. If #COTI fails to break out of this current pattern, we could see the price drop back to test the $0.067 support level once again. This area has been tested multiple times, and each time, it has responded with a strong rebound and a fast recovery.
💎But here's the concern—if COTI fails to rebound after retesting this zone, it could signal a bearish move, with the next stop being the **major support at $0.05277.
💎For COTI to maintain its upward momentum, it needs to recover and reclaim the $0.067 support area. As per my analysis, the bullish outlook remains valid as long as the daily candle stays above this level. A close below that critical support would **invalidate** the bullish scenario, opening the door for further downward movement.
Remember, staying disciplined and following clear strategies are essential in these volatile times.
MyCryptoParadise
iFeel the success🌴

COTI ROADMAP (12H)From where we placed the red arrow on the chart, it seems that the COTI correction has started.
This correction seems to be a diametric.
From the red range, it can drop to the lower areas.
Closing a daily candle above the invalidation level will violate the analysis.
For risk management, please don't forget stop loss and capital management
Comment if you have any questions
Thank You

LONG COTIUSDTif the cotiusdt giver the breakput at this level we can see a good move, and make handsome profit.

COTI Technical Analysis in a Weekly TimeframeHello everyone, I’m Cryptorphic.
I’ve been sharing insightful charts and analysis for the past seven years.
Follow me for:
~ Unbiased analyses on trending altcoins.
~ Identifying altcoins with 10x-50x potential.
~ Futures trade setups.
~ Daily updates on Bitcoin and Ethereum.
~ High time frame (HTF) market bottom and top calls.
~ Short-term market movements.
~ Charts supported by critical fundamentals.
Now, let’s dive into this chart analysis:
COTI is in a bearish trend and will likely drop further toward the support range between $0.03566 and $0.0508. This support zone could be a good range for accumulation, and a rebound can be expected near this level.
Key levels:
- Support Range/Accumulation: $0.03566 to $0.0508
- Resistance/Target: $0.166
- Long-term Target: $0.694
DYOR, NFA.
Please hit the like button to support my content and share your thoughts in the comment section. Feel free to request any chart analysis you’d like to see!
Thank you!
#PEACE

LONG POSITION COTI/USDTwe can enter the LONG position at the specified entry points.
It is clear that risk management is followed

COTI Textbook Macro Accumulation Entering MarkupCOTI has a beautiful textbook accumulation finishing up here, it's about to enter the markup phase. Altcoin season is starting and this is going to be one of the big winners this cycle! I have targets all the way up to $0.98 based on the fib extensions for wave 5 - this impulsive structure is following all of the rules so far. Wave 4 bounced right at the top of Wave 1 just like it's supposed to.

COTI - March 2024COTI Projections Unleashed!
For those who've been with me since the beginning, you know the story of COTI - one of my first charts posted here, and a token I proudly hold significant positions in. We've ridden the COTI wave several times, banking huge profits along the way.
While I continue to be a proud HODLer for this bull run, trading COTI has also proven to be a lucrative venture. We've notched up triple-digit percentage profits multiple times, and here's the latest update – a potential buying opportunity in the projected zone!
The approach remains simple: stay disciplined. Whether you're a holder or a trader, discipline is key.
As always, ensure your stop-loss orders are in place, and let's execute our best money management practices. It's time to ride the COTI wave once again!

COTIUSDT Falling Wedge Pattern.COTIUSDT technical analysis update
COTI price is breaking the falling wedge resistance line on the daily chart and is trading above the 100 and 200 EMA. We can expect a gradual bullish move in the coming days.
Buy Level: Above $0.114
Stop Loss: $0.088

COTI COTI / USDT
Pruce is forming bullflag on weekly chart
This is bullish pattern,
A breakout here will confirm the bullish view in the coming weeks
Best of wishes
