COW/USDTKey Level Zone: 0.2540 - 0.2610
HMT v8 detected. The setup looks promising, supported by a previous upward/downward trend with increasing volume and momentum, presenting an excellent reward-to-risk opportunity.
HMT (High Momentum Trending):
HMT is based on trend, momentum, volume, and market struc
No news here
Looks like there's nothing to report right now


COW Analysis (12H)From the point where the red arrow is placed on the chart, the correction of COW has started. This correction appears to be a symmetrical pattern, and it now seems that we are at the end of wave H.
The green zone is where wave I could potentially end, offering a low-risk area for entry.
Targets ar

Psychological Traps Set by Market Makers to Ensnare InvestorsPsychological Traps Set by Market Makers to Ensnare Investors
Market Makers create a matrix of psychological traps designed to welcome "investors" when they enter the market. Every case is similar, built on a deep understanding of the behavioral psychology of the majority when participating in the

COWUSDT CHART ANALYSİS - EDUCATİONAL POSTUnderstanding Time Frames in Trading
Advantages and Disadvantages of Short-Term Trading
Short-term trading has plenty of advantages, such as the ability to capitalize on quick market movements and generate quick profits. On the other hand, it also comes with certain disadvantages, such as incre


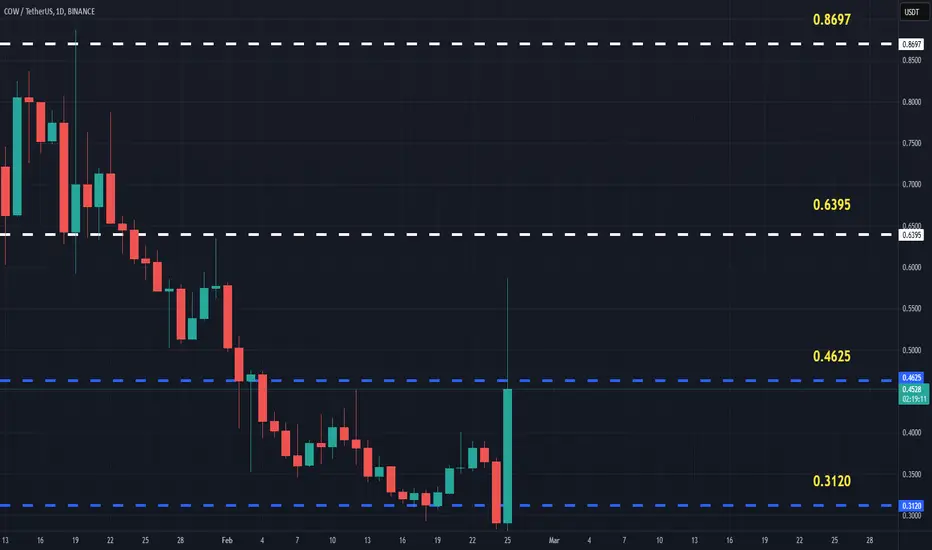
Cow/UsdtBINANCE:COWUSDT
The cow price is currently at **0.4222** 🐄, approaching its resistance levels. Resistance is sitting at **0.5000** ⬆️ and **0.5555** 📈. If it breaks through these levels, it could indicate further upward movement 🚀, but keep in mind, this is just some analysis, not financial advic


See all ideas
Summarizing what the indicators are suggesting.
Oscillators
Neutral
SellBuy
Strong sellStrong buy
Strong sellSellNeutralBuyStrong buy
Oscillators
Neutral
SellBuy
Strong sellStrong buy
Strong sellSellNeutralBuyStrong buy
Summary
Neutral
SellBuy
Strong sellStrong buy
Strong sellSellNeutralBuyStrong buy
Summary
Neutral
SellBuy
Strong sellStrong buy
Strong sellSellNeutralBuyStrong buy
Summary
Neutral
SellBuy
Strong sellStrong buy
Strong sellSellNeutralBuyStrong buy
Moving Averages
Neutral
SellBuy
Strong sellStrong buy
Strong sellSellNeutralBuyStrong buy
Moving Averages
Neutral
SellBuy
Strong sellStrong buy
Strong sellSellNeutralBuyStrong buy
Displays a symbol's price movements over previous years to identify recurring trends.