Buy Trade Strategy for COW: Backing MEV-Protected DEX EvolutionDescription:
This trading idea is centered on COW, the native token powering the CoW Protocol, a decentralized exchange (DEX) that uniquely focuses on protecting users from MEV (Maximal Extractable Value) attacks. COW enables a batch auction mechanism that matches orders peer-to-peer before accessing traditional liquidity pools, aiming for fairer and more cost-efficient trades. With growing concerns around MEV and gas efficiency in DeFi, CoW Protocol’s innovative architecture positions it as a promising infrastructure player in the decentralized trading space.
The COW token supports governance and aligns incentives among users, solvers, and liquidity providers, helping to build a more sustainable and democratic trading environment. As the protocol garners more attention and integration across DeFi tools, demand for COW may rise. That said, crypto markets are volatile, and broader adoption will depend on user trust, regulation, and technical execution.
Disclaimer:
This idea is shared for educational purposes only and should not be considered financial advice. Investing in cryptocurrencies like COW involves high risk, including the potential loss of all invested capital. Always conduct your own due diligence, understand the associated risks, and consult a licensed financial advisor before making any trading decisions. Past performance does not guarantee future results.
COWUSDT trade ideas

COW/USDTKey Level Zone: 0.3060 - 0.3120
LMT v2.0 detected.
The setup looks promising—price previously trended upward with rising volume and momentum, then retested this zone cleanly. This presents an excellent reward-to-risk opportunity if momentum continues to align.
Introducing LMT (Levels & Momentum Trading)
- Over the past 3 years, I’ve refined my approach to focus more sharply on the single most important element in any trade: the KEY LEVEL.
- While HMT (High Momentum Trading) served me well—combining trend, momentum, volume, and structure across multiple timeframes—I realized that consistently identifying and respecting these critical price zones is what truly separates good trades from great ones.
- That insight led to the evolution of HMT into LMT – Levels & Momentum Trading.
Why the Change? (From HMT to LMT)
Switching from High Momentum Trading (HMT) to Levels & Momentum Trading (LMT) improves precision, risk control, and confidence by:
- Clearer Entries & Stops: Defined key levels make it easier to plan entries, stop-losses, and position sizing—no more guesswork.
- Better Signal Quality: Momentum is now always checked against a support or resistance zone—if it aligns, it's a stronger setup.
- Improved Reward-to-Risk: All trades are anchored to key levels, making it easier to calculate and manage risk effectively.
- Stronger Confidence: With clear invalidation points beyond key levels, it's easier to trust the plan and stay disciplined—even in tough markets.
Whenever I share a signal, it’s because:
- A high‐probability key level has been identified on a higher timeframe.
- Lower‐timeframe momentum, market structure and volume suggest continuation or reversal is imminent.
- The reward‐to‐risk (based on that key level) meets my criteria for a disciplined entry.
***Please note that conducting a comprehensive analysis on a single timeframe chart can be quite challenging and sometimes confusing. I appreciate your understanding of the effort involved.
Important Note: The Role of Key Levels
- Holding a key level zone: If price respects the key level zone, momentum often carries the trend in the expected direction. That’s when we look to enter, with stop-loss placed just beyond the zone with some buffer.
- Breaking a key level zone: A definitive break signals a potential stop‐out for trend traders. For reversal traders, it’s a cue to consider switching direction—price often retests broken zones as new support or resistance.
My Trading Rules (Unchanged)
Risk Management
- Maximum risk per trade: 2.5%
- Leverage: 5x
Exit Strategy / Profit Taking
- Sell at least 70% on the 3rd wave up (LTF Wave 5).
- Typically sell 50% during a high‐volume spike.
- Move stop‐loss to breakeven once the trade achieves a 1.5:1 R:R.
- Exit at breakeven if momentum fades or divergence appears.
The market is highly dynamic and constantly changing. LMT signals and target profit (TP) levels are based on the current price and movement, but market conditions can shift instantly, so it is crucial to remain adaptable and follow the market's movement.
If you find this signal/analysis meaningful, kindly like and share it.
Thank you for your support~
Sharing this with love!
From HMT to LMT: A Brief Version History
HM Signal :
Date: 17/08/2023
- Early concept identifying high momentum pullbacks within strong uptrends
- Triggered after a prior wave up with rising volume and momentum
- Focused on healthy retracements into support for optimal reward-to-risk setups
HMT v1.0:
Date: 18/10/2024
- Initial release of the High Momentum Trading framework
- Combined multi-timeframe trend, volume, and momentum analysis.
- Focused on identifying strong trending moves high momentum
HMT v2.0:
Date: 17/12/2024
- Major update to the Momentum indicator
- Reduced false signals from inaccurate momentum detection
- New screener with improved accuracy and fewer signals
HMT v3.0:
Date: 23/12/2024
- Added liquidity factor to enhance trend continuation
- Improved potential for momentum-based plays
- Increased winning probability by reducing entries during peaks
HMT v3.1:
Date: 31/12/2024
- Enhanced entry confirmation for improved reward-to-risk ratios
HMT v4.0:
Date: 05/01/2025
- Incorporated buying and selling pressure in lower timeframes to enhance the probability of trending moves while optimizing entry timing and scaling
HMT v4.1:
Date: 06/01/2025
- Enhanced take-profit (TP) target by incorporating market structure analysis
HMT v5 :
Date: 23/01/2025
- Refined wave analysis for trending conditions
- Incorporated lower timeframe (LTF) momentum to strengthen trend reliability
- Re-aligned and re-balanced entry conditions for improved accuracy
HMT v6 :
Date : 15/02/2025
- Integrated strong accumulation activity into in-depth wave analysis
HMT v7 :
Date : 20/03/2025
- Refined wave analysis along with accumulation and market sentiment
HMT v8 :
Date : 16/04/2025
- Fully restructured strategy logic
HMT v8.1 :
Date : 18/04/2025
- Refined Take Profit (TP) logic to be more conservative for improved win consistency
LMT v1.0 :
Date : 06/06/2025
- Rebranded to emphasize key levels + momentum as the core framework
LMT v2.0
Date: 11/06/2025

CoW Protocol About to Enter Bullish Zone (214% Easy Target)'Next target' has 484% profits potential. This target is projected to hit mid-term, that is, within 3 months (90 days)... Boost & keep reading below!
Good afternoon my fellow Cryptocurrency trader, I hope you are having a wonderful week and day.
COWUSDT is about to enter the bullish zone, when the action moves above EMA55. The magenta line on the chart.
This altcoin is already bullish because it is no longer bearish. The low happened 7-April and as you can see, the market has been sideways since early February. 150 days. More than 5 months.
Notice how daily trading volume is almost flat but some days stand out with increased buying. You see green bars shooting up but never red bars. This reveals a bullish bias. We are witnessing the early days before a major bullish breakout. One that will lead to 200% and up to 500% profits mid-term. Long-term, there can be more.
Thank you for reading.
Another easy trade, huge profits, easy chart. Buy and hold.
Namaste.

COW/USDTKey Level Zone: 0.4100 - 0.4230
HMT v8.1 detected. The setup looks promising, supported by a previous upward/downward trend with increasing volume and momentum, presenting an excellent reward-to-risk opportunity.
HMT (High Momentum Trending):
HMT is based on trend, momentum, volume, and market structure across multiple timeframes. It highlights setups with strong potential for upward movement and higher rewards.
Whenever I spot a signal for my own trading, I’ll share it. Please note that conducting a comprehensive analysis on a single timeframe chart can be quite challenging and sometimes confusing. I appreciate your understanding of the effort involved.
Important Note :
Role of Key Levels:
- These zones are critical for analyzing price trends. If the key level zone holds, the price may continue trending in the expected direction. However, momentum may increase or decrease based on subsequent patterns.
- Breakouts: If the key level zone breaks, it signals a stop-out. For reversal traders, this presents an opportunity to consider switching direction, as the price often retests these zones, which may act as strong support-turned-resistance (or vice versa).
My Trading Rules
Risk Management
- Maximum risk per trade: 2.5%.
- Leverage: 5x.
Exit Strategy
Profit-Taking:
- Sell at least 70% on the 3rd wave up (LTF Wave 5).
- Typically, sell 50% during a high-volume spike.
- Adjust stop-loss to breakeven once the trade achieves a 1.5:1 reward-to-risk ratio.
- If the market shows signs of losing momentum or divergence, ill will exit at breakeven.
The market is highly dynamic and constantly changing. HMT signals and target profit (TP) levels are based on the current price and movement, but market conditions can shift instantly, so it is crucial to remain adaptable and follow the market's movement.
If you find this signal/analysis meaningful, kindly like and share it.
Thank you for your support~
Sharing this with love!
HMT v2.0:
- Major update to the Momentum indicator
- Reduced false signals from inaccurate momentum detection
- New screener with improved accuracy and fewer signals
HMT v3.0:
- Added liquidity factor to enhance trend continuation
- Improved potential for momentum-based plays
- Increased winning probability by reducing entries during peaks
HMT v3.1:
- Enhanced entry confirmation for improved reward-to-risk ratios
HMT v4.0:
- Incorporated buying and selling pressure in lower timeframes to enhance the probability of trending moves while optimizing entry timing and scaling
HMT v4.1:
- Enhanced take-profit (TP) target by incorporating market structure analysis
HMT v5 :
Date: 23/01/2025
- Refined wave analysis for trending conditions
- Incorporated lower timeframe (LTF) momentum to strengthen trend reliability
- Re-aligned and re-balanced entry conditions for improved accuracy
HMT v6 :
Date : 15/02/2025
- Integrated strong accumulation activity into in-depth wave analysis
HMT v7 :
Date : 20/03/2025
- Refined wave analysis along with accumulation and market sentiment
HMT v8 :
Date : 16/04/2025
- Fully restructured strategy logic
HMT v8.1 :
Date : 18/04/2025
- Refined Take Profit (TP) logic to be more conservative for improved win consistency

COW ANALYSIS🚀#COW Analysis : Pattern Formation
🔮As we can see in the chart of #COW that there is a formation Inverse Head And Shoulder Pattern and it's a bullish pattern. If the candle breaks and sustain above the neckline then a bullish move could be confirmed✅
🔰Current Price: $0.2790
⚡️What to do ?
👀Keep an eye on #COW price action. We can trade according to the chart and make some profits⚡️⚡️
#COW #Cryptocurrency #TechnicalAnalysis #DYOR

Trading opportunity for COWUSDTBased on technical factors there is a Sell position in :
📊 COWUSDT
🔴 Sell Now
🪫Stop loss 0.3620
🔋Target 0.1900
📏 R/R 1,2
💸RISK : 1%
We hope it is profitable for you ❤️
Please support our activity with your likes👍 and comments📝

COW Analysis (12H)From the point where the red arrow is placed on the chart, the correction of COW has started. This correction appears to be a symmetrical pattern, and it now seems that we are at the end of wave H.
The green zone is where wave I could potentially end, offering a low-risk area for entry.
Targets are marked on the chart.
A daily candle closing below the invalidation level will invalidate this analysis.
For risk management, please don't forget stop loss and capital management
Comment if you have any questions
Thank You

COW/USDTKey Level Zone: 0.2540 - 0.2610
HMT v8 detected. The setup looks promising, supported by a previous upward/downward trend with increasing volume and momentum, presenting an excellent reward-to-risk opportunity.
HMT (High Momentum Trending):
HMT is based on trend, momentum, volume, and market structure across multiple timeframes. It highlights setups with strong potential for upward movement and higher rewards.
Whenever I spot a signal for my own trading, I’ll share it. Please note that conducting a comprehensive analysis on a single timeframe chart can be quite challenging and sometimes confusing. I appreciate your understanding of the effort involved.
Important Note :
Role of Key Levels:
- These zones are critical for analyzing price trends. If the key level zone holds, the price may continue trending in the expected direction. However, momentum may increase or decrease based on subsequent patterns.
- Breakouts: If the key level zone breaks, it signals a stop-out. For reversal traders, this presents an opportunity to consider switching direction, as the price often retests these zones, which may act as strong support-turned-resistance (or vice versa).
My Trading Rules
Risk Management
- Maximum risk per trade: 2.5%.
- Leverage: 5x.
Exit Strategy
Profit-Taking:
- Sell at least 70% on the 3rd wave up (LTF Wave 5).
- Typically, sell 50% during a high-volume spike.
- Adjust stop-loss to breakeven once the trade achieves a 1.5:1 reward-to-risk ratio.
- If the market shows signs of losing momentum or divergence, ill will exit at breakeven.
The market is highly dynamic and constantly changing. HMT signals and target profit (TP) levels are based on the current price and movement, but market conditions can shift instantly, so it is crucial to remain adaptable and follow the market's movement.
If you find this signal/analysis meaningful, kindly like and share it.
Thank you for your support~
Sharing this with love!
HMT v2.0:
- Major update to the Momentum indicator
- Reduced false signals from inaccurate momentum detection
- New screener with improved accuracy and fewer signals
HMT v3.0:
- Added liquidity factor to enhance trend continuation
- Improved potential for momentum-based plays
- Increased winning probability by reducing entries during peaks
HMT v3.1:
- Enhanced entry confirmation for improved reward-to-risk ratios
HMT v4.0:
- Incorporated buying and selling pressure in lower timeframes to enhance the probability of trending moves while optimizing entry timing and scaling
HMT v4.1:
- Enhanced take-profit (TP) target by incorporating market structure analysis
HMT v5 :
Date: 23/01/2025
- Refined wave analysis for trending conditions
- Incorporated lower timeframe (LTF) momentum to strengthen trend reliability
- Re-aligned and re-balanced entry conditions for improved accuracy
HMT v6 :
Date : 15/02/2025
- Integrated strong accumulation activity into in-depth wave analysis
HMT v7 :
Date : 20/03/2025
- Refined wave analysis along with accumulation and market sentiment
HMT v8 :
Date : 16/04/2025
- Fully restructured strategy logic

Bullish Divs on 4hr but macro is a poo show80% down this year. Have some chainmail gloves on if you're catching this knife. Might be a starting point to ladder in. Erc20 leverage on eth?

Psychological Traps Set by Market Makers to Ensnare InvestorsPsychological Traps Set by Market Makers to Ensnare Investors
Market Makers create a matrix of psychological traps designed to welcome "investors" when they enter the market. Every case is similar, built on a deep understanding of the behavioral psychology of the majority when participating in the market. Let’s take a case study with COWUSDT.
As you can see, on the D1 (daily) cycle, COW has dropped by approximately 77% from its peak to the current bottom. But overall, do you think the market just plummeted straight to the bottom in one go, with the amplitude measured at 77%? The answer is no. As you observe, the chart shows numerous downward waves and plenty of upward waves. The total energy of the declines must outweigh the energy of the increases because COW is in a downtrend. The net result of this relationship is -77%, meaning the COW asset has lost 77% of its value from its peak.
The upward movements subtly influence your behavioral psychology. In the first wave, the market only dropped by -34%, but shortly after, it rebounded by 24%, meaning your asset balance only took a 10% hit in terms of capital. If you bought $1,000 worth of COW, this drop would nominally feel like you only lost $100. Then, the journey of ups and downs continues—declines followed by rises. These rises are merely temporary corrective waves within the broader downtrend. For individual investors, they might still feel happy because, at times, even when their assets suffer significant losses, the market adjusts the next day, reducing the magnitude of the decline. You feel happy about that. Then your mind tells you, “Don’t overreact, folks—look, the market’s bouncing back already. See? We’re holders; this nominal loss doesn’t mean anything. We haven’t sold yet, so it’s not a real loss, just on paper.”
But the market delivers multiple blows, causing your asset to lose nearly all its value and sit there for a long enough time that your investment becomes inefficient in terms of both time and value.
This COW case is based on the D1 chart—it’s short-term. But if it were a different asset on a different cycle, like the monthly (M) chart, you might not even realize which side of the slope it’s on. If you keep buying or holding based on psychology, you’ll end up paying a price.
Wishing you successful investing!

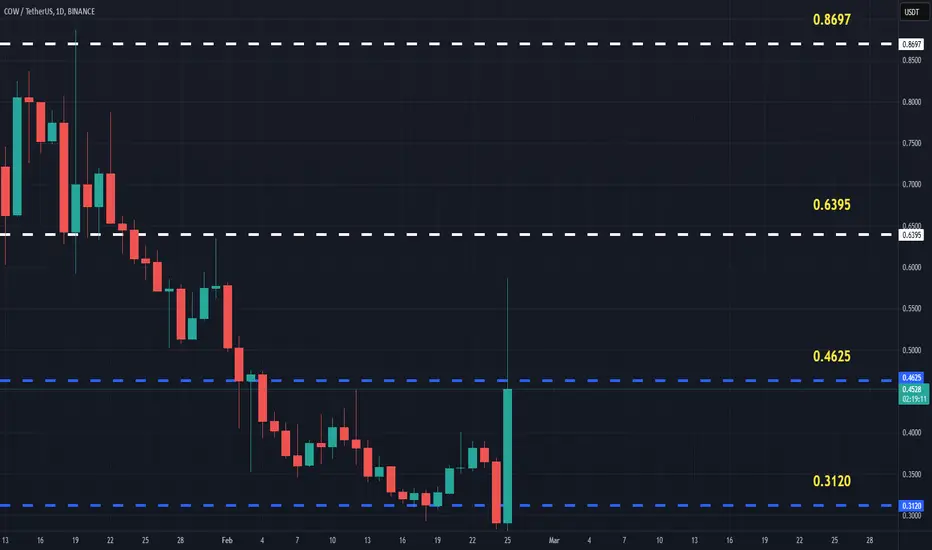
COWUSDT(CoWProtocol) Updated till 25-02-25COWUSDT(CoWProtocol) Daily timeframe range. while many alts today creating new low. it held its local low and had a retrace. 0.4625 is recent resistance confirm close above can push it further. market is unstable but better if it stay above 0.3120.
COWUSDT CHART ANALYSİS - EDUCATİONAL POSTUnderstanding Time Frames in Trading
Advantages and Disadvantages of Short-Term Trading
Short-term trading has plenty of advantages, such as the ability to capitalize on quick market movements and generate quick profits. On the other hand, it also comes with certain disadvantages, such as increased stress levels due to frequent decision-making, higher transaction costs due to more frequent trades, and the potential for false signals.
Advantages and Disadvantages of Medium-Term Trading
Medium-term trading provides traders with a balanced approach to trading, allowing them to capture short-term trends while still considering long-term movements. This approach offers advantages such as reduced stress compared to short-term trading and fewer transaction costs.
Advantages and Disadvantages of Long-Term Trading
Long-term trading allows traders to capture significant market trends and potentially generate substantial profits. It offers advantages like reduced stress levels due to fewer trades and lower transaction costs. However, it requires patience and discipline, as traders may have to withstand temporary market fluctuations and maintain positions for an extended period.
To conclude, the best time frame to trade in any market depends on various factors, including market volatility, trader’s strategy and goals, and risk tolerance. Traders should carefully consider these factors and select the time frame that aligns with their trading style and objectives. We strongly recommend traders to use 1D- daily time frame in the first year of their crypto trading life, and 1W- weekly time frame if they trade in stock market.

$COW ANALYSIS! COW is testing the red resistance zone 🟥.
✅ If breakout is successful, the first target is the green line level 🟩

Cow/UsdtBINANCE:COWUSDT
The cow price is currently at **0.4222** 🐄, approaching its resistance levels. Resistance is sitting at **0.5000** ⬆️ and **0.5555** 📈. If it breaks through these levels, it could indicate further upward movement 🚀, but keep in mind, this is just some analysis, not financial advice!

cowusdtIn the 4-hour timeframe, the price action has provided a strong entry trigger based on candlestick analysis.
The price has built a base around the previous liquidity zone , indicating a potential upward move.

cowusdtIn the **4-hour timeframe**, the price action has provided a **strong entry trigger** based on candlestick analysis.
The price has **built a base around the previous liquidity zone**, indicating a potential upward move.
We are entering a position accordingly. 🚀

COWUSDT (CoWProtocol) Updated till 20-01-25COWUSDT (CoWProtocol) Daily timeframe range. another alt with fairly new PA and close to price discovery. these kind of alt do offers lots of opportunity as its fresh. it will try for 0.8832 resistance but price action needs to stay above 0.5933 for that.

COW as it seems, cow it is following the retrace setup to send it long... lets see next 6=8 hours
nfa dyor


COWUSDTgoing up and all details on the chart based on new strategy looking for 3 candles inside each other we call it arrow shark startegy

COW After doing some research on the project website, markets that i operates, analyzing the way it performed last 10 days, market conditions, market trends, buy and sell volumes, i think this is how it has to do the next 5-7 days, things could change in a bit but overall should be ;ike this

CoW Protocol | Trump’s Secret Weapon for Milking CryptoTrump Used COW to Milk Crypto and He’s MOOOving Big Bucks!
Cow pumped 100% since our first signal also shot up over 30% couple of days ago after World Liberty Financial (WLFI), a DeFi project connected to none other than Donald Trump, executed a $ 2.5 million trade to grab 759.36 ETH through CoW
But we know all Dogs and Frogs in crypto zoo What is CoW Protocol !?
CoW Protocol is like the wild west of trading – totally free and unrestrained, it’s a decentralized protocol that uses Batch Auctions to figure out the best price for your trades. It’s not just any auction, though – it's all about finding the sweet spot where traders’ needs align, aka the "Coincidence of Wants" (CoWs). This magic happens when multiple buyers and sellers meet at the same price. The protocol pulls liquidity from every nook and cranny of the blockchain to make sure no one is left high and dry.
Instead of relying on the usual suspects like Automated Market Makers (AMMs) or Central Limit Order Books (CLOBs), CoW Protocol does its thing by running batch auctions, where multiple trades happen at once. These auctions are like a giant, hyper-efficient sale at a market where the best negotiator wins. The "solver" who can get the best deal—by finding matching CoWs or hunting down the cheapest liquidity—gets to settle the batch. So, it's like a shopping spree, but for crypto.
The real kicker? CoW Protocol saves you money. How? It optimizes gas fees, reduces liquidity provider costs, and gives you some sweet protection from front-running and miner extractable value (MEV)—stuff that normally eats away at your profits. If the market is a battlefield, CoW Protocol is like having an impenetrable shield to keep your wallet safe.
CowSwap: The CoW Protocol’s Trading Buddy
CowSwap is like the Uber of CoW Protocol—it’s the trading platform built on top of CoW, acting as a Meta DEX aggregator that finds you the best prices by bouncing between different AMMs and aggregators. CowSwap's mission? To get you the best deal possible, depending on which venue has the most liquidity at the time. No more guessing which exchange has the best price!
CoW Protocol Price Today
CoW Protocol's price today is a healthy $1.15, up by a cool +33% in the last 24 hours. It's like it woke up and decided to crush it.With a circulating supply of 293.4 million tokens and a max supply of 1 billion, there's plenty of CoW to go around. In the last 24 hours, $232.95 million worth of CoW tokens changed hands.
It’s rocking 24 markets and 19 exchanges, with Binance being the busiest one. At the moment, CoW Protocol has a tiny 0.01% share of the entire crypto market, but it’s sitting pretty with a market cap of $341 million.

Cowusdt trading opportunityCowusdt is displaying indications of a potential three-drive formation, with the designated target zone identified as the area for selling off. It is crucial to closely monitor the price action upon reaching this level. We invite you to share your perspectives on this coin, and kindly consider leaving your likes to show support.
