If not now, when?FDV comparison of other Cryptocurrency Exchanges:
BNB (Binance) - $94.39B
BGB (Bitget) - $6.58B
MX (MEXC) - $3.47B
CRO (Crypto.com) - $2.72B
FDV of DEX Exchange tokens:
UNI (Uniswap) : $9.84B
Ray (Raydium) : $2.88B
Cake (PancakeSwap) : $1.17B
Let's see how this goes from here.
CROUSD trade ideas

Cronos road to half of ath?What Is Cronos ?
Cronos (CRO) is the native cryptocurrency token of Cronos Chain — a decentralized, open-source blockchain developed by the Crypto.com payment, trading and financial services company.
Cronos Chain is one of the products in Crypto.com’s lineup of solutions designed to accelerate the global adoption of cryptocurrencies as a means of increasing personal control over money, safeguarding user data and protecting users’ identities. The CRO blockchain serves primarily as a vehicle that powers the Crypto.com Pay mobile payments app.
In the future, Crypto.com plans to expand the reach of the CRO platform to power its other products as well. CRO went live in November-December 2018.
Total supply: 30B CRO !
Max. supply: --
Circulating supply: 26.57B CRO
Good entry now, 0.10 usdt. Targets: 0.30 usdt, 0.60 usdt or again ath.
This is only my idea guys.
This is not financial advice !
Please do your analysis and consider investing !! Thanks for supp.

Cronos (CRO) - Bullish Swing - ResurectionCOINBASE:CROUSD been mostly #Bearish, but things are about to change.
Eventually it found its bottoms.
That's when I loaded #Longs around the 6 and 7 Cents Levels.
Eventually I took profit on the #HODL #Trades at 19 Cents a pop.
* all well documented in the related idea.
What's Next for OKX:CROUSDT ?
As the #BreakOut is now confirmed, a #Bullish Swing is about to start.
That would be the #ElliottWave #Impulse (#MotiveWave).
#AltSeason has started, and MARKETSCOM:BITCOIN is adding fuel.
#AltCoins will most likely get pushed by the #BitcoinDominance ( CRYPTOCAP:BTC.D ) #Retracement.
#TotalMarketCap ( CRYPTOCAP:TOTAL3 & CRYPTOCAP:OTHERS ) are also showing signs of new #ATH coming.
COINBASE:CROUSDC #TechnicalAnalysis
- #ElliottWave A-B-C Sequence
- Primary ⓒ (white) #Impulse
- #Fibonacci Time Zones
- #Fibonacci Retracements Confluence
- #Cypher #Harmonic
My #Long Levels On COINBASE:CROUSD
HODL:
- Entry @ 14 Cents
- TP1 @ 40 Cents
- TP2 @ 60 Cents
#Futures ( CRYPTOCOM:CROUSD.P )
- Moderate Entry @ 14 Cents
- Conservative Entry @ 10 Cents
- TP1 @ 40 Cents
- TP2 @ 60 Cents

CROUSD is tempting.. Good level for BUYAs price rejected on its 61.8 retracement, made a good reversal candle on daily,
I believe CROUSD will have a good upward movement in upcoming days.
BUY!
CHEEERRRS...!!!

CRO 30 Min TA by ChartMasterAI
Let's dive into an in-depth technical analysis (TA) of the CRO/USD 1-hour chart provided, breaking down each element:
Price Action Analysis
Current Price: The price of CRO/USD is at 0.13663, which is down by 21.25% from the previous period, indicating a strong bearish trend.
Trend: The chart shows a clear downtrend, with the price making lower highs and lower lows. This is characteristic of a bearish market where sellers dominate.
Support and Resistance:
Support: The immediate support level is around 0.1300, which has been tested multiple times and could act as a psychological support due to the round number.
Resistance: The resistance is around 0.1500, where the price has previously struggled to break through, acting as a ceiling.
Fibonacci Retracement Levels
The chart includes Fibonacci retracement levels which are used to identify potential reversal points:
0.236 (0.13753): This level has been breached, indicating a deep retracement.
0.382 (0.13521): The price is currently near this level, which could act as a minor support.
0.5 (0.13344): Below the current price, this could be the next support if the price continues to fall.
0.618 (0.13145): A deeper Fibonacci level, potentially significant if the price drops further.
0.786 (0.12881): The deepest level on the chart, indicating a strong bearish move if reached.
Indicators Analysis
Volume:
There's a note that the data vendor doesn't provide volume data for this symbol, which limits our ability to analyze trading activity directly. However, the absence of volume spikes during the downtrend suggests the bearish move might be driven by lack of buying interest rather than heavy selling.
Stochastic RSI (3, 3, 14, close):
Current Reading: -0.00 (extremely oversold).
Explanation: The Stochastic RSI is an oscillator that ranges from 0 to 100, with readings below 20 typically indicating oversold conditions. Here, it's at -0.00, which is beyond the normal range, suggesting an extreme oversold condition. This might indicate that the selling pressure is possibly overdone, and a short-term bounce could be expected. However, in strong downtrends, oversold conditions can persist.
Chande Momentum Oscillator (ChandeMO) (9, close):
Current Reading: -74.12 (bearish momentum).
Explanation: The ChandeMO measures momentum by comparing the sum of gains and losses over a period. A reading below -50 indicates strong bearish momentum. At -74.12, it's deeply in bearish territory, reinforcing the current downtrend.
MACD (12, 26, close):
Current Values: MACD line at -0.00028, Signal line at -0.00009, Histogram at 0.00019.
Explanation: The MACD (Moving Average Convergence Divergence) consists of the MACD line (12-period EMA - 26-period EMA), the Signal line (9-period EMA of MACD), and the histogram (difference between MACD and Signal lines).
The MACD line is below the Signal line, which is a bearish signal.
The histogram turning positive suggests a slight decrease in bearish momentum, but since both lines are negative, the overall trend remains bearish. This could hint at a potential short-term relief rally or consolidation before possibly continuing the downtrend.
Market Sentiment and Potential Scenarios
Bearish Sentiment: The overall sentiment remains bearish given the price action, Fibonacci retracement levels, and momentum indicators. The strong downtrend, lack of significant buying volume (though not shown), and deep oversold conditions in Stochastic RSI with strong bearish momentum in ChandeMO all point towards continued selling pressure.
Short-term Potential: Given the extreme oversold condition of the Stochastic RSI, there's a possibility of a short-term bounce or consolidation, especially if the price hits the support at 0.1300 or the Fibonacci level around 0.13344. However, without a change in the broader trend, this might only be a temporary respite.
Long-term Outlook: For a reversal, watch for:
A break above the resistance at 0.1500 with volume confirmation (if available in future analysis).
Positive divergences in momentum indicators like the MACD or ChandeMO.
A sustained move above key Fibonacci levels, particularly the 0.382 level.
Conclusion
The CRO/USD chart shows a strong bearish trend with potential for short-term relief due to oversold conditions. However, for a more sustainable recovery, more bullish signals are needed. Traders should watch for support levels and look for confirmation from momentum indicators before considering long positions, while bearish traders might look for opportunities to short on any bounces until a clear reversal pattern emerges. Always consider using stop-loss orders to manage risk, especially in volatile markets like cryptocurrencies.

Cronos: Dive!Cronos has dived into our beige Target Zone between $0.1322 and $0.0884 and should soon reach the projected low of the green wave . In our Zone, the coin should succeed in a bullish reversal, and the following impulsive wave should propel the price significantly above the resistance at $0.23. As CRO has fulfilled the minimum requirements for the wave correction by entering our Zone, it might even head above the $0.23 mark immediately.

Cronos $CRO💰 Cronos GETTEX:CRO
Timeframe: W
An altcoin that still has growth potential. The price recently broke through the triangle resistance trendline, suggesting a possible breakout upwards. I’m targeting the area around 1.00.
#CRO #Crypto #Trading #Cryptocurrency #Investing #CryptoNews #StockMarket #Stocks

CRO Chart TA by GrokAI
Analyzing the provided chart for technical insights:
Price Movement: The price has been on an upward trajectory since late December, moving from around $0.14 to testing the $0.1650 level. It's currently facing resistance around $0.1650, as indicated by the price action at this level.
Volume: There's a noticeable increase in volume as the price approaches and tests the resistance level. This could signify strong buying interest or potential selling pressure at this resistance. If the price breaks through with sustained high volume, it could confirm a breakout.
MACD: The MACD shows a bullish crossover with the MACD line crossing above the signal line, but it's quite close to the zero line. This suggests that while bullish momentum is present, it's not particularly strong. A move further above the zero line with increasing histogram bars would strengthen the bullish case.
Stochastic RSI: The Stochastic RSI is overbought, which often signals that an asset might be due for a correction or at least a period of consolidation. However, in strong uptrends, assets can remain overbought for extended periods.
RSI Divergence Indicator: The chart shows bear divergences on the RSI indicator, where the price makes higher highs but the RSI does not, indicating potential weakening momentum. This could precede a price correction if the RSI continues to diverge negatively.
Stock RSI: The RSI is currently at 57.90, which is neither overbought nor oversold, suggesting room for movement in either direction. The RSI has been trending upwards, aligning with the price trend, but the recent bear divergences are a cautionary sign.
Summary: The chart displays a bullish trend with the price testing significant resistance around $0.1650. The volume increase at this level could either confirm a breakout if sustained or indicate potential resistance if it drops off. The MACD supports a bullish view but with caution due to its proximity to the zero line. The overbought Stochastic RSI and RSI bear divergences suggest that despite the bullish price action, there's a risk of a correction or consolidation.
Action: For those considering long positions, look for a confirmed breakout above the resistance with strong volume for confirmation of the upward trend. For potential short positions or taking profits, watch for signs of rejection at this resistance level or if the RSI divergences lead to a price pullback. Always consider your risk management strategy in light of these technical indicators.

Cronos: Target Zone AheadCronos (CRO) has recently been steering a less volatile sideways course. We have identified a beige Target Zone between $0.13 and $0.08, which should catch the low of the ongoing wave in green, thus presenting an opportunity to open long positions. However, if the price directly breaches the resistance at $0.23, we will have to consider the green wave alt. as complete, and the outlined Target Zone will be missed. We assign a 33% probability to this alternative scenario.

#Cronos $CROUSD PlanCRYPTO:CROUSD Is currently seeking demand. The closest significant demand located around the 0.1200 : 0.1000 zone. Pay attention to this price range as it is anticipated to bounce off.
#CRYPTO #CRO #CRONOS #CROUSD #CRYPTO.COM #CRYPTOCURRENCY #CRYPTOANALYSIS #AHMEDMESBAH

#Cronos $CROUSD Is testing a breakout wedge#Cronos CRYPTOCOM:CROUSD is currently testing a significant breakout wedge where it is anticipated to bounce off it.
In case of a daily close below 0.1300 there could be a free fall back to 0.0800
A daily close above 0.2400 is a breakout and will unlock a new zone up to 0.4500
#Cronos #Cro #Crypto #CryptoCurrency #Crypto.com

CRO UPDATE:We have formed the green structure, creating a work structure. Attention to those trading the orange level: I recommend waiting until the green structure is completed. This means we enter at the lower end of our box, with a stop loss below the range low.

Cronos to $0.25 !!Cronos has recovered solidly from the big drop and its pink structure is still intact. We climbed from there but got pushed down by the red bearish level. Now, I'm expecting a move down into the orange zone, from where we might see an upward push that'll take us past resistance and up to the 25-cent target.

CRO turning area for huge profitsWith the completion of the purple sequence and simultaneously hitting our pink resistance, Chronos has created a scenario where a correction is likely. I anticipate that we will break through our BC correction level to the downside. At that point, I will open a long position and target our designated levels.

CRO could increase its price between (+72%) to (+126%)CRO is looking very strong with weekly bullish divergences and the monthly timeframe momentum shifting to bullish, moneyflow increasing is favoring higher prices. The target is between fibonacci levels, fibonacci extension levels, monthly level and value area low/point of control from the last bull run. A weekly candle close above $0,178 will be very important to validate this idea.
TARGET: $0,35 to $0,46 up to (+126%)

So bullish on $CROThere are mamy fundamentals pointing toward bullish signals , as I’ve laid out in the chart I feel as though it’s setting up for another short term rise in price.
Not financial advice!
DYOR

crousdt ideaDaily structure. See weekly for more clear view.
Line horizontal is key point, can take profit or buy zone.
Expect price to range and slowly climb up

CRONOS DAILY BREAKDOWN Wed.Dec.4.2024Like and Comments would be appreciated :D Not Financial Advice, Just my outlook/opinion

CRO to .32 centsSeeing high highs. Hopefully cro can push and break through current resistance level. This is a short term trade. I believe cro will definitely hit a dollar next year.
I’m no expert just sharing my thoughts

Cryptocom in Bearland- Like most altcoins, CRO remains deep in its bear market.
- Until BTC rallies significantly, altcoins will likely stay overshadowed.
- BTC dominance (BTC.D) is climbing near 60%, putting pressure on altcoins.
- As always, check the bubbles, follow the trends
- Everything you need is in the chart.
- What’s the best approach?
- Be patient and continue DCA.
- Buy at the good time.
Buying CRO in this market:
Option 1: Wait for a return to the bottom around $0.05—(ideally a full-buy range).
Option 2: Wait for a breakout and weekly close above $0.10 for confirmation.
- Whether trading or holding, consider taking partial profits on the way up.
- For the short term, consider taking profit around $0.50, as there’s resistance in this area.
- For those waiting on the altcoin bull run, a max target of $1.5 to $2.5 is reasonable.
Happy Tr4Ding !

Cronos CRO In Trouble - BUY & HODLCronos can go bust, but even so, it's on Sale.
CROUSD / CROUSDT will go straight bull at one point.
So, I am still buying these poopy coins on each major fall they have.
Yeah, that's what I do.. putting my money into a black hole.
My next good BUY LEVEL: $0.03 .
Who knows, maybe I'll actually get rich.
My Technicals on CRO:
* Elliott Wave A-B-C Pattern
* Fibonacci Retracements
* Fibonacci Time Zones
* Double Bottom
* Cycle Analysis
* Bullish Divergence
Fibonacci Time Zones tell me that the beginning of '23 will be amazing!

CROUSD - Above 200MA Weekly candle has firmly poised itself above the 200MA, a point which was previously rejected.
This is an extremely bullish sign on this Weekly timeframe
Indicator Analysis

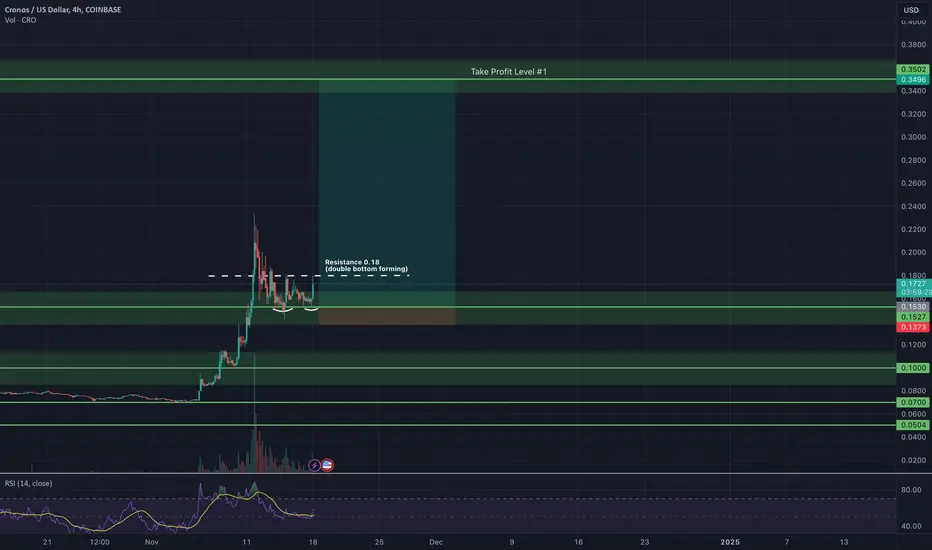
Take the risk or lose the chance. Seeing the previous 0.15 level of resistance now becoming the support level for CRO following the elections. Each election cycle usually is followed by a swift bull run. I'm all in brothers. This is it. Lambo land is on the other side. I can see it. I can smell it. Still optimistic about the 0.35 level.
To the moon
- Big Dawg