CRO to the moon or the toilethere is the 3rd cro update
hopefully we done playing around or we get some what of a relief rally that would make this play out
chart for the potential entry, wait for retest, and i added decent short incase we go the other way make a plan for both
bullish divergence on the mac D and the RSI
CROUSDT trade ideas

CRO daily chart still intact?CRO (Crypto.com) daily chart still looking intact?
Im staying Nuetral at the moment bc its charting a
bear pennant but the RSI had hit the very bottom,
and the DeMark 9 Indicator aslo is reading it
hit the very bottom which is a 80% probablilty,
that Bars Pattern you see would be what it looks like
if the same bull run it has had in the past would repeat
again. look how it matched exaclty up where
the DeMark showed that its ready to move upward.
the price targets are shown on the right side above
the current price, supports are listed on the right below
the current price. Im actually leaning more bullish
than bearish...I see us begin to move upward from now to the next 4 wweks
for a bull run..

CRO trendline breakout hey everybody
wait for a clear retest on 0.43 then you can long
you can also find better entry around 0.43 on 4h chart
we need to see closing this 4h candle above 0.43 then retesting on it !
please be careful because BTC getting close to 40k resistance so could be a chance to fail and all cryptos coming down with it !
not financial advice!

Cup and handle on 30m CRYPTO.COM Coin CRO ?Is there a Cup and handle forming on the 30m CRYPTO.COM Coin CRO ?


$CRO : about this gianthello everyone.
h r u today?
i am feeling good about $CRO,it gives good signs.
first, it broke the resistance line of the descending channel ,it could move towards a traditional resistance line at 0.48$,
or it retests the channel line and then rises.
second, the presence of a very weak volume on the monthly chart support this idea,
the next month will be great for the coin🤑
what do you think?

Bullish play is still on 📊Let see where it wanna go
Target 1,05 is still in play and thats around +200 % gain from the 0,31 mark.
remember we are in the bear market even thu some are still technical to the upside ( like CRO )
But it all depends on how the market will react.
If the course stays over 0,31 the bull are still in play , if we break that we can see a down side on -25 % to the 0,20 mark ( biggest CRO support )
and that means we are in a bear market with CRO aswell.
Lets find out where is gonna go to in the next couple of mouths ( stay alert to the overall market aswell since they are in charge atm )

CRO is here to stay!one of the top coins to DCA long term
top marketing team, top exchange, top app, etc.
i am expecting final BTC dump to flush out all weak hands, hopefully we will see .22-28 CRO
cheers

CYPTO.COM (CRO) GOING FOR (0.33) SUPPORT RETESTKUCOIN:CROUSDT looks like it has broke its upwards momentum and is now heading towards the 0.33 support.
I expect the support to hold
------------------------------------------------------------------------------------------------------------------------------------------------------------------------------------------------
If you enjoyed this post and agree with me, a like and a sub would be very nice : )
If you have any other ideas or simply disagree, manifest yourself in the comments ⬇️⬇️⬇️
Stay updated for more content
Have a nice Day : ) Bye!
----------------------------------------------------------------------------------------------------------------------------------------------------------------------------------------------


CRO update Risk warning, disclaimer: the above is a personal market judgment based on published information and historical chart data on Tradingview, all analysis is only subjective. Hope investors consider, I am not responsible for your investment decision. Thank you.
Good luck

CROAccording to weakly time frame $CRO is about to lose 50% of it's value. I'm starting to accumulate now at 0.4 all the way down to 0.25
tarets are $1 - $2 - $ 2.4
Good luck

Harmonic pattern $CROi used ABCD pattern for this and i know that's just the start for it if it didn't break the C of course

CROUSD (1H) Bullish reversalHi Traders
CROUSD (1H Timeframe)
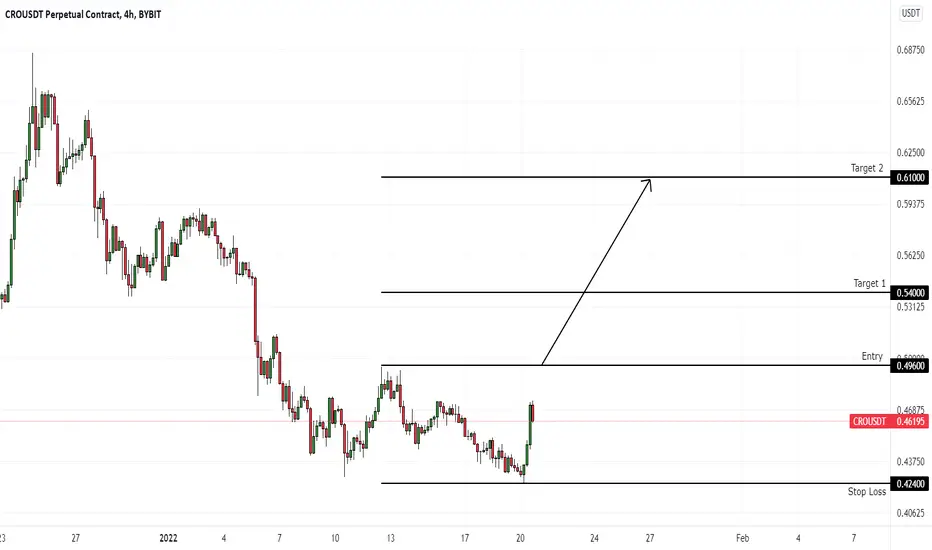
Waiting for the upward break of 0.496 resistance level, which will complete a bullish trend reversal pattern to go LONG. Only the downward break of 0.424 would cancel the bullish scenario.
Trade details
Entry: 0.496
Stop loss: 0.424
Take profit 1: 0.540
Take profit 2: 0.610
Score: 4
Strategy: Bullish reversal
CRO long setup- Multi-month downtrend
- Price seems to have bottomed out
- Broke 50EMA (as in late december)
- MACD curling up ( " " " " " " ")
- MACD histogram green (" " " " " " )
Looking for either support found at the 50 EMA or a clean breakout + retest of the 100 EMA (purple)
However, since we're in a clear downtrend for CRO it is also likely that we'll see a rejection from the 100 EMA and a further move down. Despite this very strong bullish candle.
What would you do?

CRO ( Wait for The breakout )CRO has been on a down trend for 2 months , no room is left we'll see a big move in the coming days .

CRO is Approaching in its Buying Zone The Back Ground and Psychological Level of 0.40$
After making the high of 0.9550, the bulls of CRO gave up; in its deep correction, the first leg down was 33.50%, while in a second attempt, it lost more than this. But When it shed 50% from its all-time high, we see a decent bounce back to 0.48 to 0.68, which is almost a gain of 40 percent from the current price. Now in its third leg down, it is trading near the strong support zone and a psychological level of 0.40. It also becomes almost 40% correction from the 0.68 to 0.40 level.
Point:
A decent buying interest lies in the support zone marked on the chart, a dip below 0.40 will attract many buyers, and this will be an opportunity that CRO traders will not want to miss out. A psychological and important level that is hard to break. While on the upper side, 0.50 is a resistance tested two times and was failed on its third attempt.
Pay Attention
It will be a good buying opportunity when the price visits the 0.40 level but pay close attention to the daily close; it should not breach the lower level.
Risk / Reward and Holding Period
Hold it at least for two quarters; I expect it above 1$ at the end of Jun2022.
It is not financial advice; always do your research.
Please, feel free to ask your question; write it in the comments below, and I will answer.

Crypto.com Chain ($CRO) FIBCrypto.com Chain ($CRO) FIB: $CRO DTF testing $0.4420 FIB support 5 times in 10 days. Oscillators suggest that this FIB won't hold and that a re-test of the BB LB is in order

CRO 🕊 updatehere are a few cro targets i got for now.. iif we push up, we could see more downside as well.
make sure to DYOR and follow proper risk management. and stay green

CROUSDT is testing the dynamic resistanceThe market is testing an important supply zone as you can see on the daily timeframe. (the upper chart).
On the 4h Timeframe (lower chart) the price had a breakout from the triangle after a false breakout but got a rejection from the previous support now new resistance.
Now the price is testing the dynamic resistance around 0.5$ and static 4h resistance.
How we can approach this scenario?
We'd like to see a clear breakout from the dynamic resistance and retest the previous resistance as new support.
0.55$ could be a safe place to apply our strategies and open a new long position.
–––––
Follow the Shrimp 🦐
Keep in mind.
🟣 Purple structure -> Monthly structure.
🔴 Red structure -> Weekly structure.
🔵 Blue structure -> Daily structure.
🟡 Yellow structure -> 4h structure.
⚫️ Black structure -> <4h structure.

The CRO is struggling to get out of the relegation channelThe CRO makes a top exit from the Relegation Channel, which allows him to attempt an attack for $ 0.49 along with 0.236 Fib Retracement. However, the $ 0.454 support line is still an important point.

Simple but smartHi guys
We hit the roof of the canal. If we react to the ceiling, the price is likely to fall.
Buying only makes sense if the channel ceiling is broken upwards and the channel price is high
Do not care about shadows
If you liked this analysis, please like and follow 🙏
