My Thoughts on the current state of CROMy Thoughts on the current state of CRO.
CRO is its token and is used on Crypto.com.
this token has received a nice pop from the "LA Stadium Deal"
while Crypto.com continues to make these bold headlines their user base will increase and their cion will rise in the long term.
you can see there is a nice bullish trend with this cion.
CROUSDT trade ideas

CRO Bullish 📈CRO looks set to have another rally.
It looks like it has formed its support and can break out in the coming days to the upside.

Crypto.com Chain ($CRO)Crypto.com Chain ($CRO) touching both $0.7288 resistance and $0.6675 support as MACD crosses over and RSI losing strength. Nothing can go up forever without paying the penalty

CROUSDT inverse head shoulderCROUSDT could break out of a beautiful IHS after CRO showed some bullish divergence on MACD and RSI at the .886 fib level. and on the left shoulder MACD printed some hidden bullish divergence .
If CRO manages to close a 4h above the neckline of the IHS, it would confirm the breakout and one could open a long. (not finacial advice)
Target of the measured move of the IHS coincides with the .618 and is def a the first profit taking level.
Lets hope BTC can keep rallyin and bring some confidence back to the market.

CROUSDT Complex momentum-shifting-structureCRO been goin crazy in the last couple weeks and it all started with the legendary inverse head and shoulder pattern that formed from june to end of july and broke the neckline in early august. From there CRO been mooning from below $0.1 and hit a ATH around $0.98 on Nov. 24.
Since then CRO sold off after showin bearish divergences on the daily rsi and to me it was quite difficult to tell what CROUSDT is actually doing. But with more data theres more clarity. Its quite astonishing to see all the Patterns that the Chart throws at us.
Instead of callin for exact patterns Names or deciding for one over the other, one should look at what this patterns trying to tell us as traders and analysts.
CRO made a lower low double bottom, broke a supply line (dragon or creek) and flipped it to a support, while forming higher lows and painting another inverse head and shoulder pattern, inside of a potential ascending triangle. All in all its a complex momentum-shifting-structure which could lead to a continuation of the Rally. Also short timeframe oscilators imply that this could be the new bottom for CRO.
With all this intel its getting pretty easy to manage risk here. If CROUSDT can continue to make higher lows and doesnt fall below $0.65 and doesnt break the demand line of the potential ascending triangle its safu.
There are 2 Ways to trade this either with a stop loss around the demand line for a short term trade or with a SL below $0.65 for a short swing trade. But its a small structure at high premium levels so i would not recommend to actually act on this setup. No Value at those levels even tho it could go much higher from here.
Altough there were alot of technical arguments for CRO, the pumpage we saw in the last weeks been mostly fundamental. Crypto.com launched the Beta for their CRONOS EVM-Chain Mainnet on Nov 9. which is revolutinary because the company combines defi with cefi and enables frictionless transfer of defi gains directly on to their visa cards. I used alot of farms and stuff on other chains, but never felt as safe as on CRONOS since CDC is heavily compliant with regulators and alot of projects on chain are financed by CDC so the chance of rugpulls reduces drasitically. I also generate enough passive income thru the Dapps that i was able to quit my job.
this is no financal advice or CRO shilling, just my honest opinion about the asset i monitor the most because i hold 75% of my networth in CRO and multiplied my BTC holdings since march 21 thanks to this asset.


CROAs for CRO, it looks like a triangle consolidation pattern. Notice volume drying up as it consolidated. Might have a strong breakout above or below soon

UpsideCro is currently sitting on an ascending triangle.
Enter $0.69 and HODL, still has a potential to go down a bit but the markets won’t drop too low with a $2.5 trillion market cap.

CRO SHORTCRO (crypto.com) is a great project for long investment
But now while the market is all red you can take your chance trading in short term
JUST AN IDEA

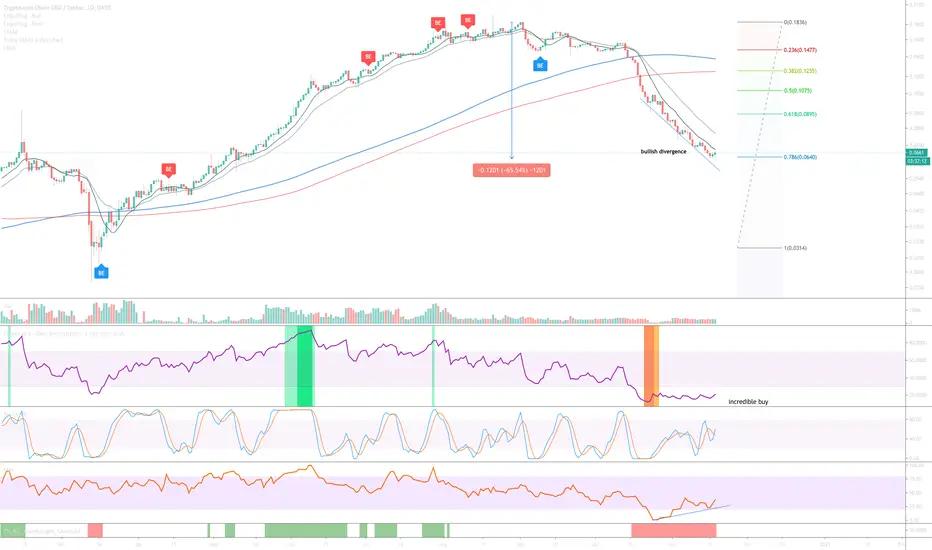
CRO / USD - Bullish divergenceFollowing a 65% correction and oversold condition (orange column) the above 1-day chart is now showing a number of bullish indicators that a reversal is imminent. The facts:
1) Bullish divergence between price action and Money Flow.
2) Price action has retraced to the golden ratio, the 0.786.
4-day chart below is printing a Dragonfly DOJI however we can’t confirm until the next candle is printed. Nonetheless, we have a oversold condition.
Good luck!
Cro scalping!!!Cro has passed a strong resistance and Pullback has confirmed and now you can buy it....the black lines are our targets

CROUSDT - Close to the resistance area and entry timingKUCOIN:CROUSDT
4H trend chart
-
CRO has already broken out the downtrend line.
But it is so close to the resistance area , so the safer way to buy is wait it to stand above 0.777(blue horizontal ray)
If price can take out 0.777 without long upper shadow line, trading strategy as below.
-
Profit Targets:
a) 0.8199----Fib(1)
b) 0.8688~0.8886----Fib(1.272~1.382)
c) 0.9311----Fib(1.618)
Stop losses:
a) 0.6851-----Red horizontal ray
-
If you like this analysis, smash the "like button" and leave a comment below to share your thoughts
or let me know what crypto you want to see!
Trading is a reflection of yourself. Learn more daily and be ready for every opportunity.
Have a nice trading!

croSo far, everything has gone according to the calculations
We have to wait to see the magic of math
Good luck

CRYPTO.COM can go to $1+ only if it can survive $0.66 TestRapid adoption and ton of marketing with latest rebranding of STAPLES center brought so many buyers. Now the overall crypto market is still in consolidation mode ahead of the final dip this last days of November.
should be able to go to $1.00 with small pullback to $0.80 or retest of
$0.66 and buyers take control there. IF sellers take control there it can be pushed down further all the way to $0.50 to the least and worst case scenario a huge wick on a candle to liquidate longs at $0.38
Always try to place the some orders below ur entry to be able to get in during that liquidations which doesnt last long.
Targets $0.80->$1.00
Stop $0.66

CRO = huge buying opportunity if market remains bullishCRO = huge buying opportunity if market remains bullish
Ideal Entry .70
Target .90+
Stoploss under .65
Crypto.com is doing so many extremely bullish things, if they keep up the hype, they would easily overtake coinbase.
Especially with the holiday season and everyone meeting up with friends and families.
There is literally no other company out there that is pushing crypto adoption better than Crypto.com.
Supporting them at this point is like supporting the pillar and foundation of cryptocurrency.

$1 for the next bull run for CRO!Using Fib Retracement/Extention and Elliots Waves to determine the trend impulse and the correction, I was able to establish a solid prediction of the next target price. Hope it's comprehensive! Please share your thoughts :)

CRO Price update 25th of NovemberKUCOIN:CROUSDT
We saw a good run on CRO that played out pretty well as my previous analysis of the coin back in mid November. CRO is currently retracing back to the lower support at around 0.7 $ area we could see a bounce sooner but I think 0.7 cent is on the table seeing the explosive growth we got in the last 2 weeks without a real retracement. After some consolidation I think CRO is going to go up again and finally hit that 1$ milestone this year.

CRO 1 HOURCRO looking to form a head-n-shoulders pattern possibly with a very drastic move to the downside.

Watching for a pullback to 0.60 to buy the dipMy Chart markup says it all. Hope you guys catch this move!


CRO/USDTHi Guys,
I hope you are all fine, Here is my analysis for your review.
Please hit like and follow.
Thanks
Crypto VJ

CRO to .34 $CRO just completed a smaller head and shoulders pattern with a nice bounce back shortly after. Bitcoin is on the brink of breaking down further and if it does, this larger HnS could play out violently.
Be careful out there CRO Bag Holders. Rug pull looking likely very soon. At least the marketing is good!

Next Target 91cts?Possible Cup & Handle or Inverted Head & Shoulders predicting next Target at 91cts.
What do you think about? Let us know! Hugs and Good Luck! 🤞😉👍
